Modeling Changes in Microbiome
Last updated: 2020-06-17
Checks: 6 1
Knit directory: Fiber_Intervention_Study/
This reproducible R Markdown analysis was created with workflowr (version 1.6.2). The Checks tab describes the reproducibility checks that were applied when the results were created. The Past versions tab lists the development history.
The R Markdown is untracked by Git. To know which version of the R Markdown file created these results, you’ll want to first commit it to the Git repo. If you’re still working on the analysis, you can ignore this warning. When you’re finished, you can run wflow_publish to commit the R Markdown file and build the HTML.
Great job! The global environment was empty. Objects defined in the global environment can affect the analysis in your R Markdown file in unknown ways. For reproduciblity it’s best to always run the code in an empty environment.
The command set.seed(20191210) was run prior to running the code in the R Markdown file. Setting a seed ensures that any results that rely on randomness, e.g. subsampling or permutations, are reproducible.
Great job! Recording the operating system, R version, and package versions is critical for reproducibility.
Nice! There were no cached chunks for this analysis, so you can be confident that you successfully produced the results during this run.
Great job! Using relative paths to the files within your workflowr project makes it easier to run your code on other machines.
Great! You are using Git for version control. Tracking code development and connecting the code version to the results is critical for reproducibility.
The results in this page were generated with repository version a16e6ef. See the Past versions tab to see a history of the changes made to the R Markdown and HTML files.
Note that you need to be careful to ensure that all relevant files for the analysis have been committed to Git prior to generating the results (you can use wflow_publish or wflow_git_commit). workflowr only checks the R Markdown file, but you know if there are other scripts or data files that it depends on. Below is the status of the Git repository when the results were generated:
Ignored files:
    Ignored:    .Rhistory
    Ignored:    .Rproj.user/
    Ignored:    code/.Rhistory
    Ignored:    reference-papers/Dietary_Variables.xlsx
    Ignored:    reference-papers/Johnson_2019.pdf
    Ignored:    renv/library/
    Ignored:    renv/staging/

Untracked files:
    Untracked:  analysis/glme_microbiome_genus_subset.Rmd
    Untracked:  analysis/glme_microbiome_phylum.Rmd
    Untracked:  data/analysis-data/DataDictionary_TOTALS_2018Record.xls
    Untracked:  fig/figure5_glmm_genus.pdf
    Untracked:  fig/figure5_glmm_phylum.pdf
    Untracked:  fig/figure5_glmm_phylum.png
    Untracked:  tab/results_glmm_microbiome_genus.csv
    Untracked:  tab/results_glmm_microbiome_phylum.csv
    Untracked:  tab/tables_results_2020-06-08.zip
    Untracked:  tab/tables_results_2020-06-08/

Unstaged changes:
    Modified:   analysis/data_processing.Rmd
    Deleted:    analysis/glme_microbiome.Rmd
    Modified:   analysis/index.Rmd
    Modified:   analysis/microbiome_diet_trends.Rmd
    Modified:   code/get_cleaned_data.R
    Modified:   code/microbiome_statistics_and_functions.R
    Modified:   fig/figure2.pdf
    Modified:   fig/figure3.pdf
    Modified:   fig/figure4.pdf
    Modified:   fig/figure4_final_microbiome_diet_variables_over_time.pdf
    Modified:   fig/figure4_legend.pdf
    Modified:   fig/figure5_glmm.pdf
Note that any generated files, e.g. HTML, png, CSS, etc., are not included in this status report because it is ok for generated content to have uncommitted changes.
There are no past versions. Publish this analysis with wflow_publish() to start tracking its development.
This page contains the investigation of the changes over time.
Data prep
This is only to recode some variables to ease interpretation.
microbiome_data$meta.dat <- microbiome_data$meta.dat %>%
  mutate(intB = ifelse(Intervention=="B", 1,0),
         time = as.numeric(Week) - 1,
         female = ifelse(Gender == "F", 1, 0),
         hispanic = ifelse(Ethnicity %in% c("White", "Asian", "Native America"), 1, 0))
Phylum Level Microbiome and Intervention
We will build up to the effect of the intervention by investigating covariates to see if we can exclude them from model with intervention. Due to only having 11 people, we will only estimate 1 random effect per model (random intercepts). All other effects are fixed, but we will only estimate up to 2 effects. Meaning we can only include two covariates in each model at a time.
In all models, \(h(.)\) is an arbitrary link function. We selected the Poisson model for the outcomes so the link function is the log link.
For all significance test, we will use \(p < 0.05\) as the level to declare significance, but we will largely focus on magnitude of effects.
Unconditional Model
This is a random intercepts model (worst case). No covariates are included.
\[\begin{align*} h\left(Y_{ij}\right)&=\beta_{0j} + r_{ij}\\ \beta_{0j}&= \gamma_{00} + u_{0j}\\ \end{align*}\]
phylum.fit0 <- glmm_microbiome(mydata=microbiome_data,model.number=0,
                               taxa.level="Phylum", link="poisson",
                               model="1 + (1|SubjectID)")
#########################################
#########################################
Model:  Actinobacteria ~ 1 + (1 | SubjectID)
<environment: 0x000000003fc897b0>

Link:    poisson


Intraclass Correlation (ICC):   0.4905836

Fixed Effects (change in log)

                   Outcome Estimate Std. Error z value Pr(>|z|)
(Intercept) Actinobacteria  2.74459    0.30057 9.13131        0


Random Effects (SD on log scale)

 Groups    Name        Std.Dev.
 SubjectID (Intercept) 0.98134

Significance test not available for random effects

#########################################
#########################################
Model:  Bacteroidetes ~ 1 + (1 | SubjectID)
<environment: 0x000000003fc897b0>

Link:    poisson


Intraclass Correlation (ICC):   0.1771389

Fixed Effects (change in log)

                  Outcome Estimate Std. Error  z value Pr(>|z|)
(Intercept) Bacteroidetes     7.97    0.13995 56.94866        0


Random Effects (SD on log scale)

 Groups    Name        Std.Dev.
 SubjectID (Intercept) 0.46397

Significance test not available for random effects

#########################################
#########################################
Model:  Cyanobacteria ~ 1 + (1 | SubjectID)
<environment: 0x000000003fc897b0>

Link:    poisson


Intraclass Correlation (ICC):   0.9437219

Fixed Effects (change in log)

                  Outcome Estimate Std. Error  z value Pr(>|z|)
(Intercept) Cyanobacteria -1.06818     1.6666 -0.64093  0.52156


Random Effects (SD on log scale)

 Groups    Name        Std.Dev.
 SubjectID (Intercept) 4.095

Significance test not available for random effects

#########################################
#########################################
Model:  Euryarchaeota ~ 1 + (1 | SubjectID)
<environment: 0x000000003fc897b0>

Link:    poisson


Intraclass Correlation (ICC):   0.8160485

Fixed Effects (change in log)

                  Outcome Estimate Std. Error  z value Pr(>|z|)
(Intercept) Euryarchaeota -1.19078    0.86784 -1.37213  0.17002


Random Effects (SD on log scale)

 Groups    Name        Std.Dev.
 SubjectID (Intercept) 2.1062

Significance test not available for random effects

#########################################
#########################################
Model:  Firmicutes ~ 1 + (1 | SubjectID)
<environment: 0x000000003fc897b0>

Link:    poisson


Intraclass Correlation (ICC):   0.1341399
Fixed Effects (change in log)

               Outcome Estimate Std. Error  z value Pr(>|z|)
(Intercept) Firmicutes  7.95503    0.11873 67.00139        0


Random Effects (SD on log scale)

 Groups    Name        Std.Dev.
 SubjectID (Intercept) 0.3936

Significance test not available for random effects

#########################################
#########################################
Model:  Lentisphaerae ~ 1 + (1 | SubjectID)
<environment: 0x000000003fc897b0>

Link:    poisson
Warning in checkConv(attr(opt, "derivs"), opt$par, ctrl = control$checkConv, :
Model failed to converge with max|grad| = 0.0470305 (tol = 0.002, component 1)
Intraclass Correlation (ICC): 0.8560092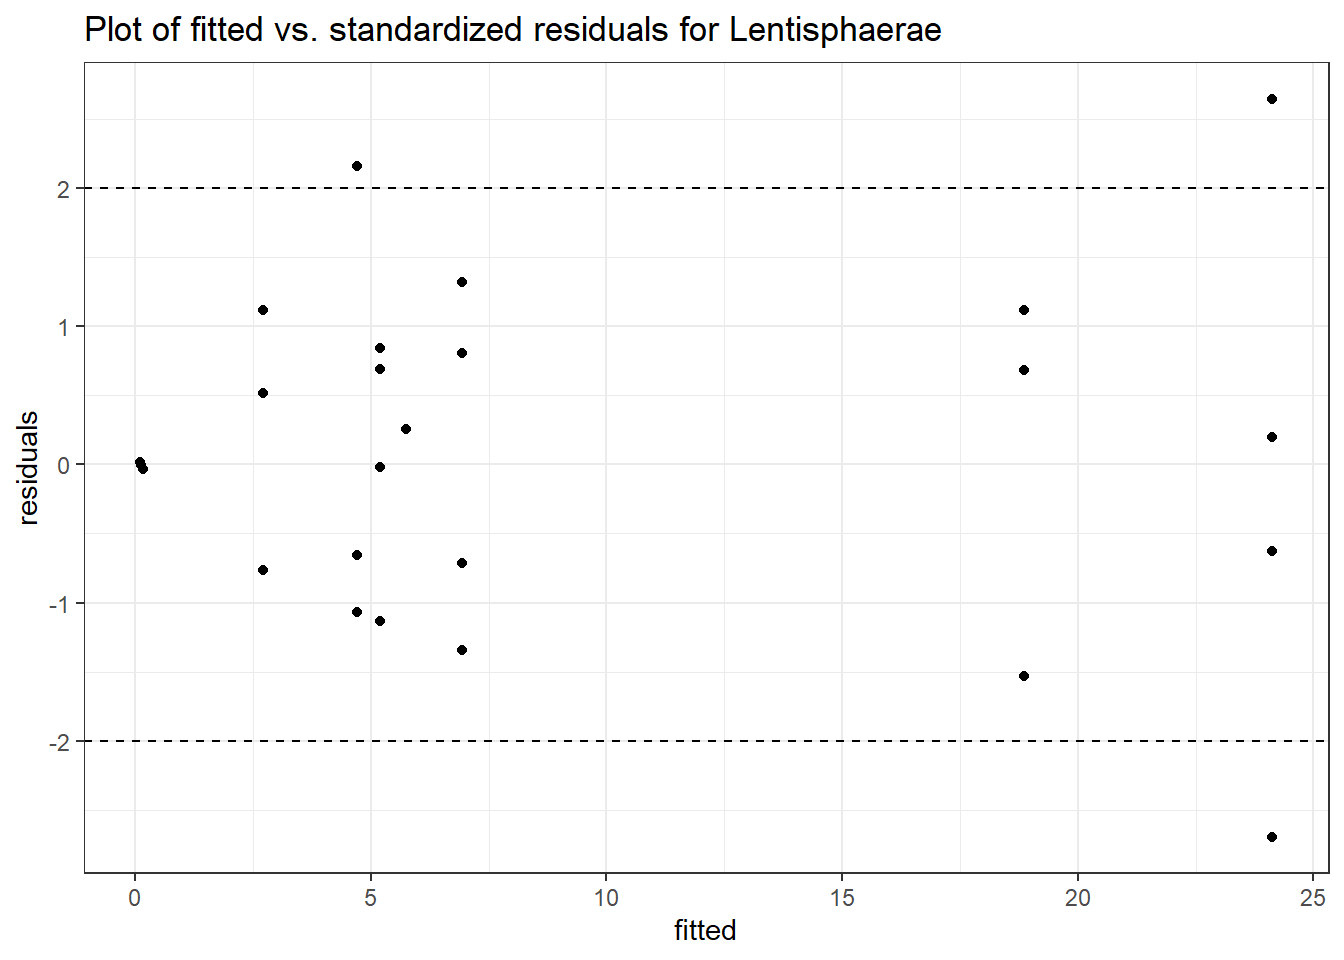

Fixed Effects (change in log)

                  Outcome Estimate Std. Error  z value Pr(>|z|)
(Intercept) Lentisphaerae  0.27284     0.0015 181.4693        0


Random Effects (SD on log scale)

 Groups    Name        Std.Dev.
 SubjectID (Intercept) 2.4382

Significance test not available for random effects

#########################################
#########################################
Model:  Proteobacteria ~ 1 + (1 | SubjectID)
<environment: 0x000000003fc897b0>

Link:    poisson


Intraclass Correlation (ICC):   0.08266202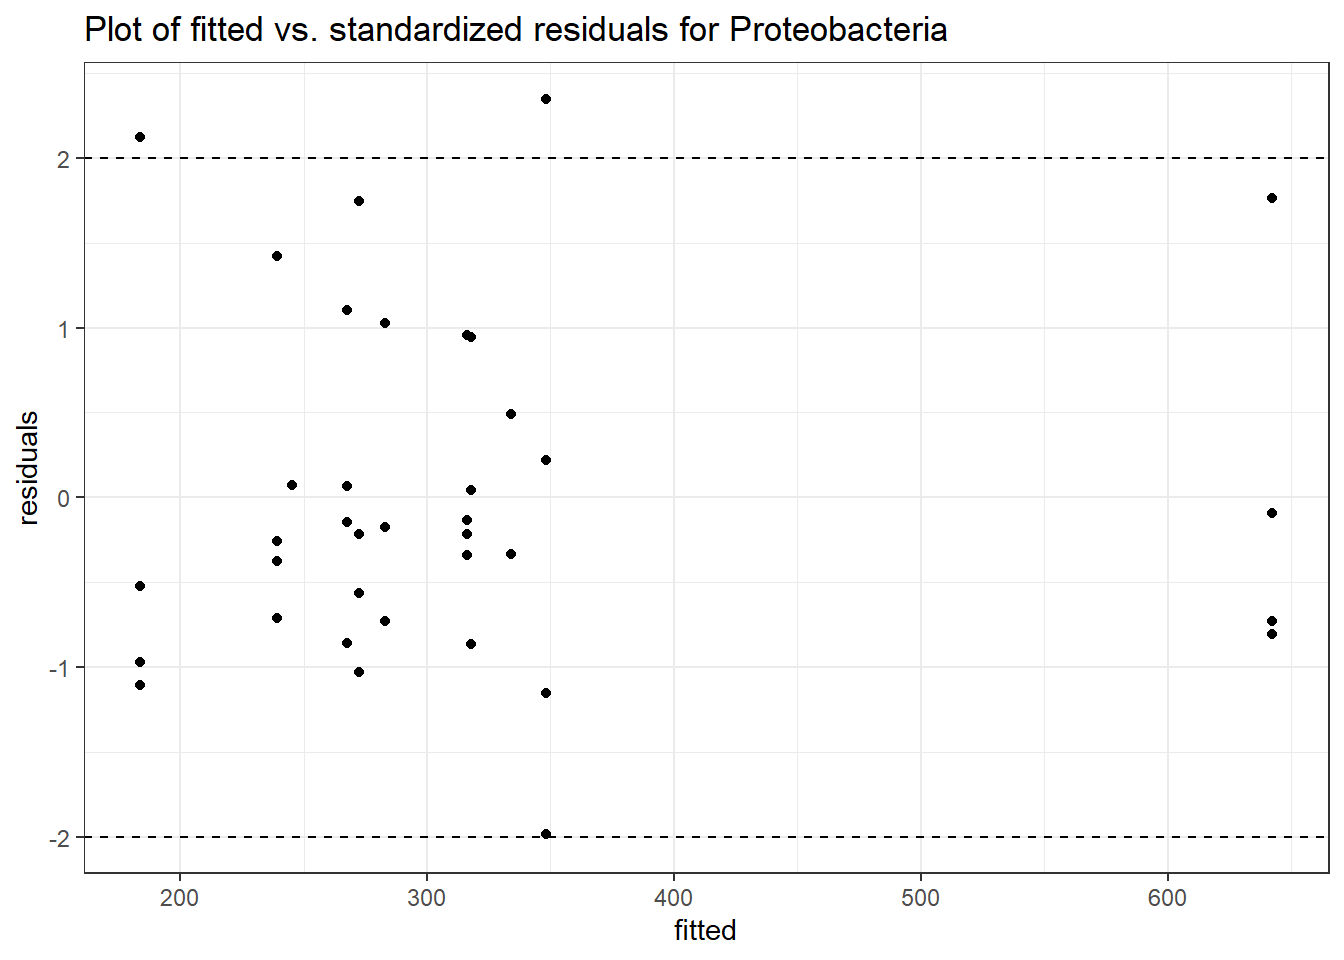

Fixed Effects (change in log)

                   Outcome Estimate Std. Error  z value Pr(>|z|)
(Intercept) Proteobacteria  5.69779    0.09114 62.51624        0


Random Effects (SD on log scale)

 Groups    Name        Std.Dev.
 SubjectID (Intercept) 0.30018

Significance test not available for random effects

#########################################
#########################################
Model:  Tenericutes ~ 1 + (1 | SubjectID)
<environment: 0x000000003fc897b0>

Link:    poisson


Intraclass Correlation (ICC):   0.9143442
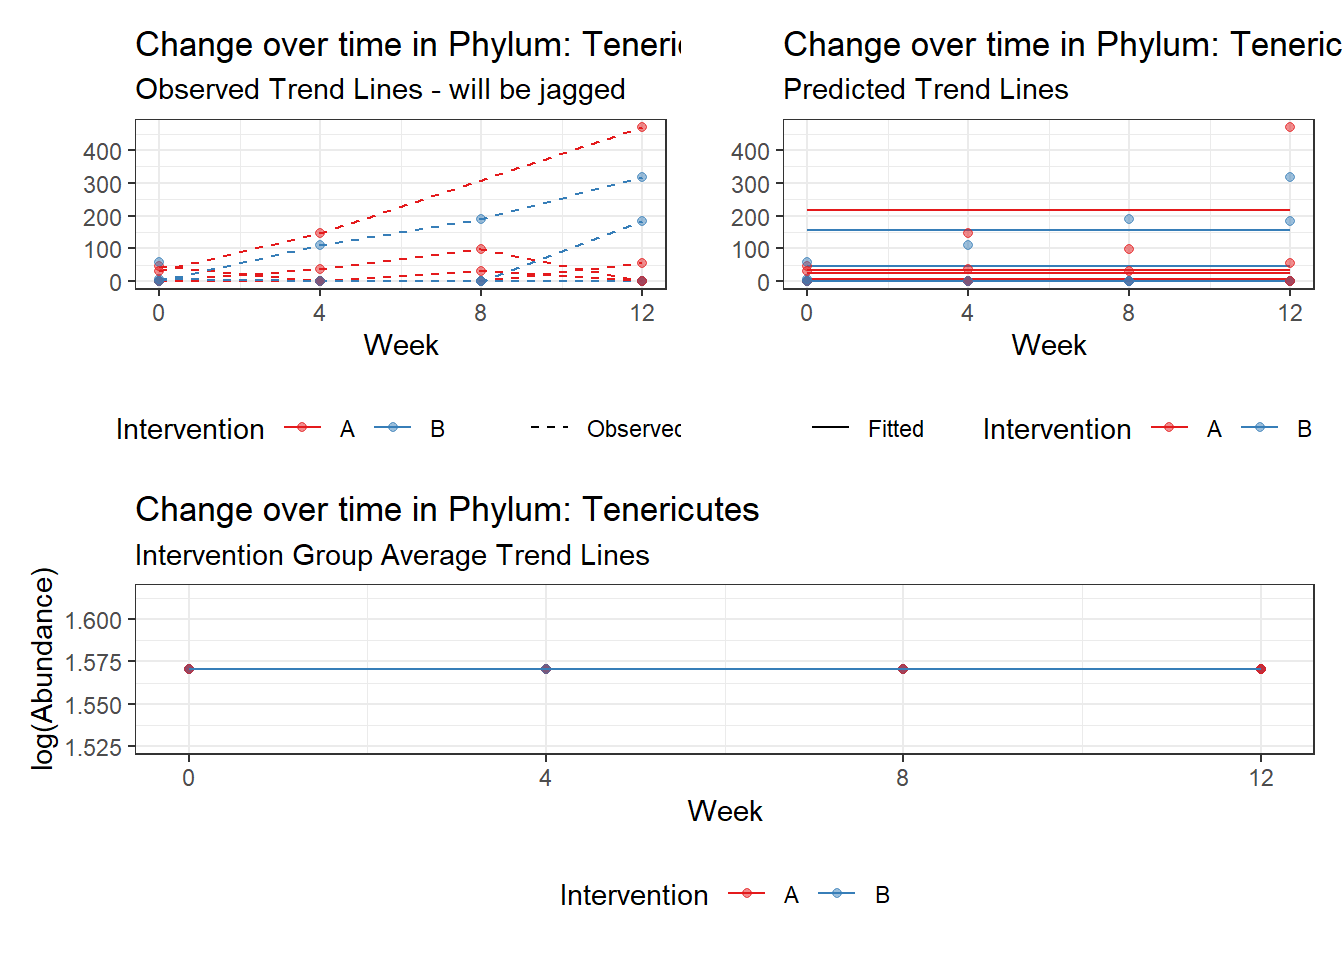
Fixed Effects (change in log)

                Outcome Estimate Std. Error z value Pr(>|z|)
(Intercept) Tenericutes  1.57029    1.02318 1.53472  0.12485


Random Effects (SD on log scale)

 Groups    Name        Std.Dev.
 SubjectID (Intercept) 3.2672

Significance test not available for random effects

#########################################
#########################################
Model:  Verrucomicrobia ~ 1 + (1 | SubjectID)
<environment: 0x000000003fc897b0>

Link:    poisson


Intraclass Correlation (ICC):   0.8607519
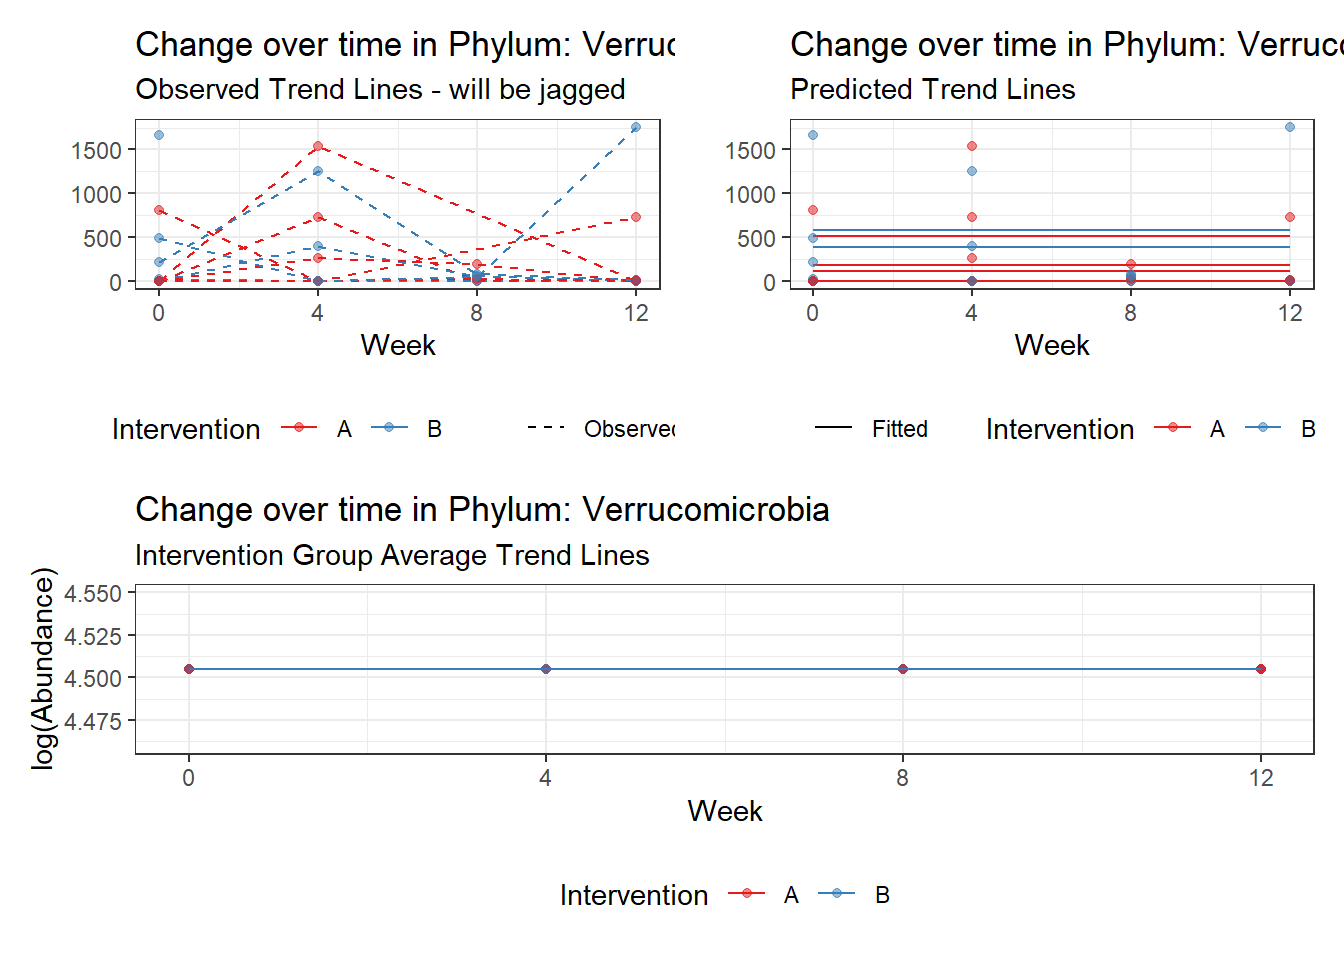
Fixed Effects (change in log)

                    Outcome Estimate Std. Error z value Pr(>|z|)
(Intercept) Verrucomicrobia  4.50476    0.75627 5.95654        0


Random Effects (SD on log scale)

 Groups    Name        Std.Dev.
 SubjectID (Intercept) 2.4862

Significance test not available for random effects
phylum.fit0b <- glmm_microbiome(mydata=microbiome_data,model.number=0,
taxa.level="Phylum", link="negbinom",
model="1 + (1|SubjectID)")
#########################################
#########################################
Model:  Actinobacteria ~ 1 + (1 | SubjectID)
<environment: 0x000000004e7b2968>

Link:    negbinom


Intraclass Correlation (ICC):   0.3549161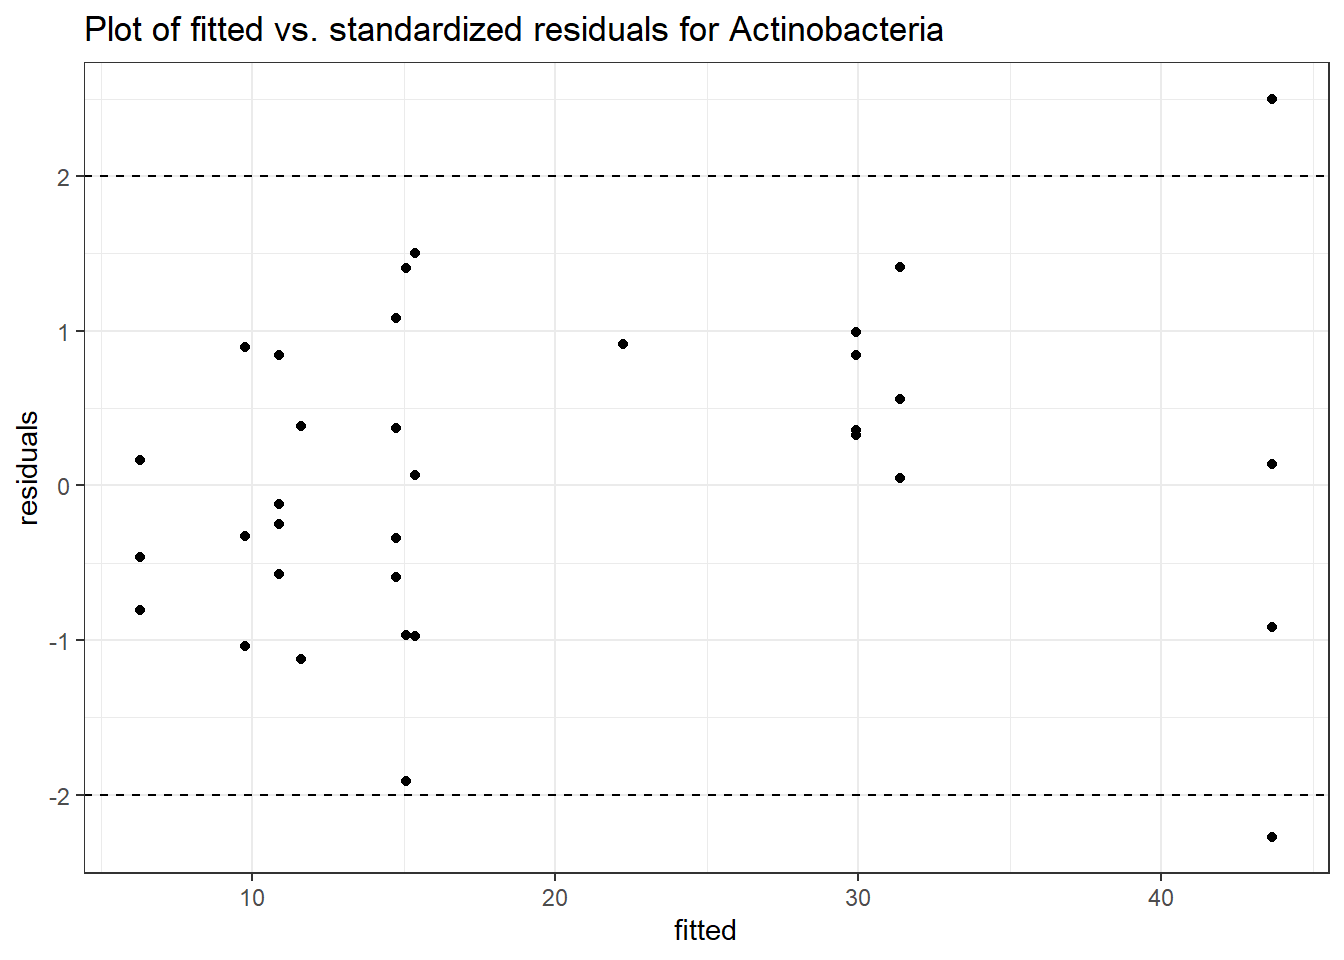

Fixed Effects (change in log)

                   Outcome Estimate Std. Error z value Pr(>|z|)
(Intercept) Actinobacteria  2.79811    0.31298 8.94033        0


Random Effects (SD on log scale)

 Groups    Name        Std.Dev.
 SubjectID (Intercept) 0.74175

Significance test not available for random effects

#########################################
#########################################
Model:  Bacteroidetes ~ 1 + (1 | SubjectID)
<environment: 0x000000004e7b2968>

Link:    negbinom


Intraclass Correlation (ICC):   0.1323578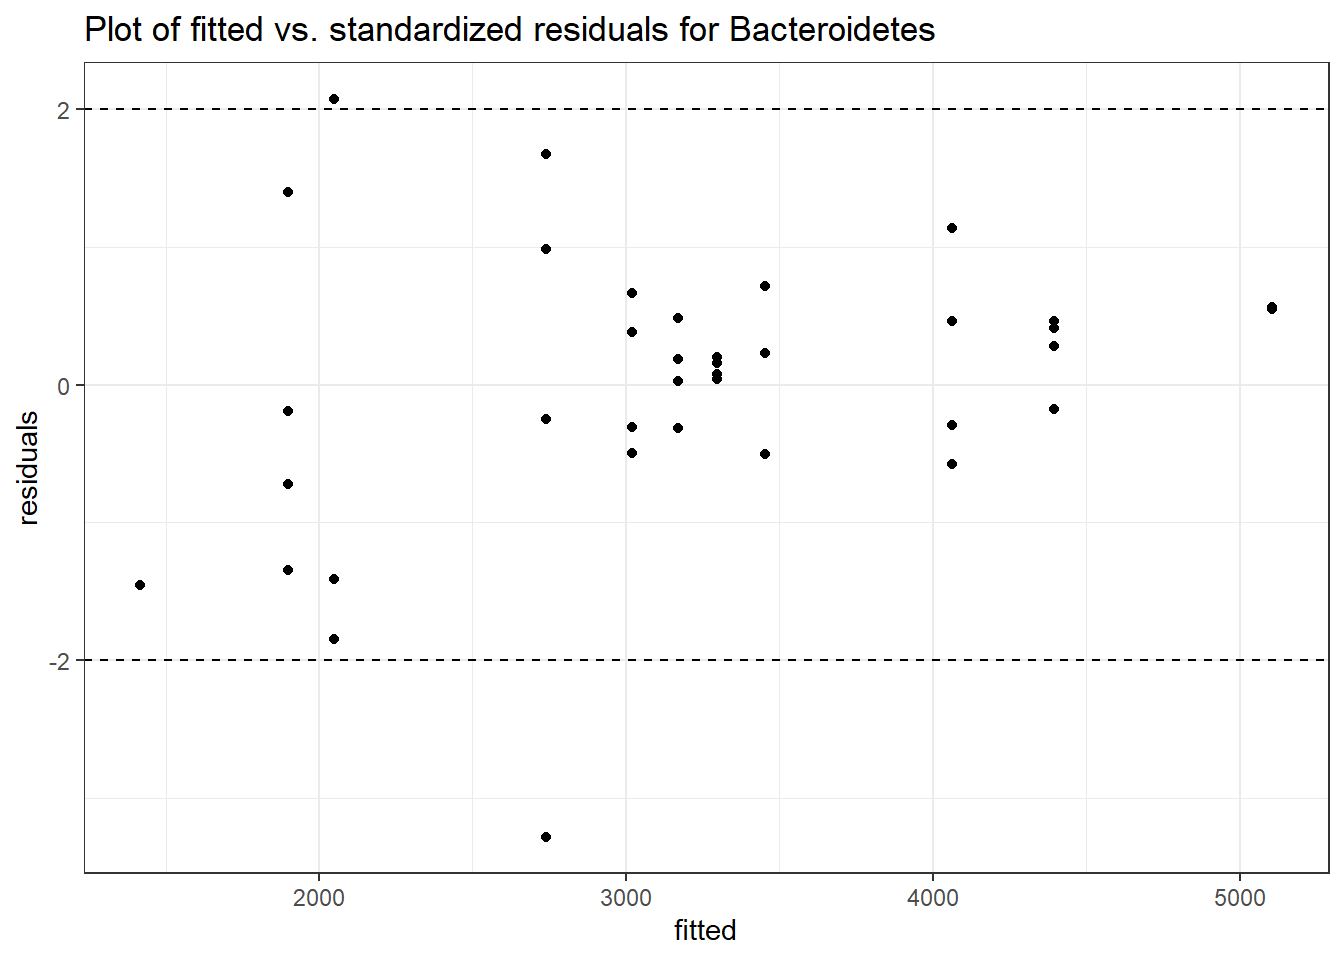
Fixed Effects (change in log)

                  Outcome Estimate Std. Error  z value Pr(>|z|)
(Intercept) Bacteroidetes  7.99127    0.12634 63.25006        0


Random Effects (SD on log scale)

 Groups    Name        Std.Dev.
 SubjectID (Intercept) 0.39057

Significance test not available for random effects

#########################################
#########################################
Model:  Cyanobacteria ~ 1 + (1 | SubjectID)
<environment: 0x000000004e7b2968>

Link:    negbinom
Warning in theta.ml(Y, mu, weights = object@resp$weights, limit = limit, :
iteration limit reachedWarning in sqrt(1/i): NaNs produced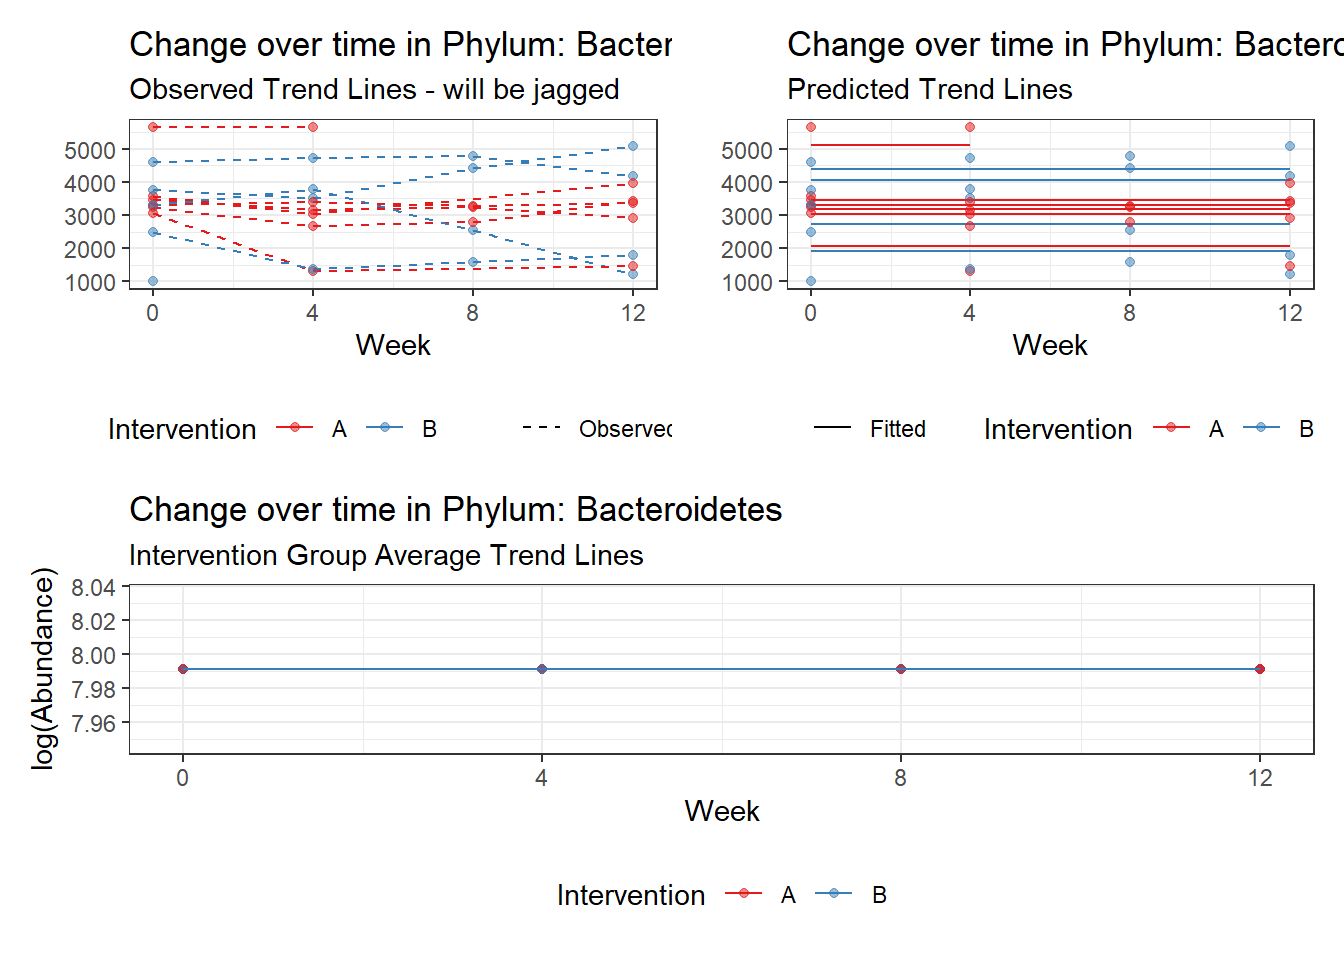
Intraclass Correlation (ICC): 0.9438998
Fixed Effects (change in log)

                  Outcome Estimate Std. Error  z value Pr(>|z|)
(Intercept) Cyanobacteria -1.07647    1.65978 -0.64856  0.51662


Random Effects (SD on log scale)

 Groups    Name        Std.Dev.
 SubjectID (Intercept) 4.1019

Significance test not available for random effects

#########################################
#########################################
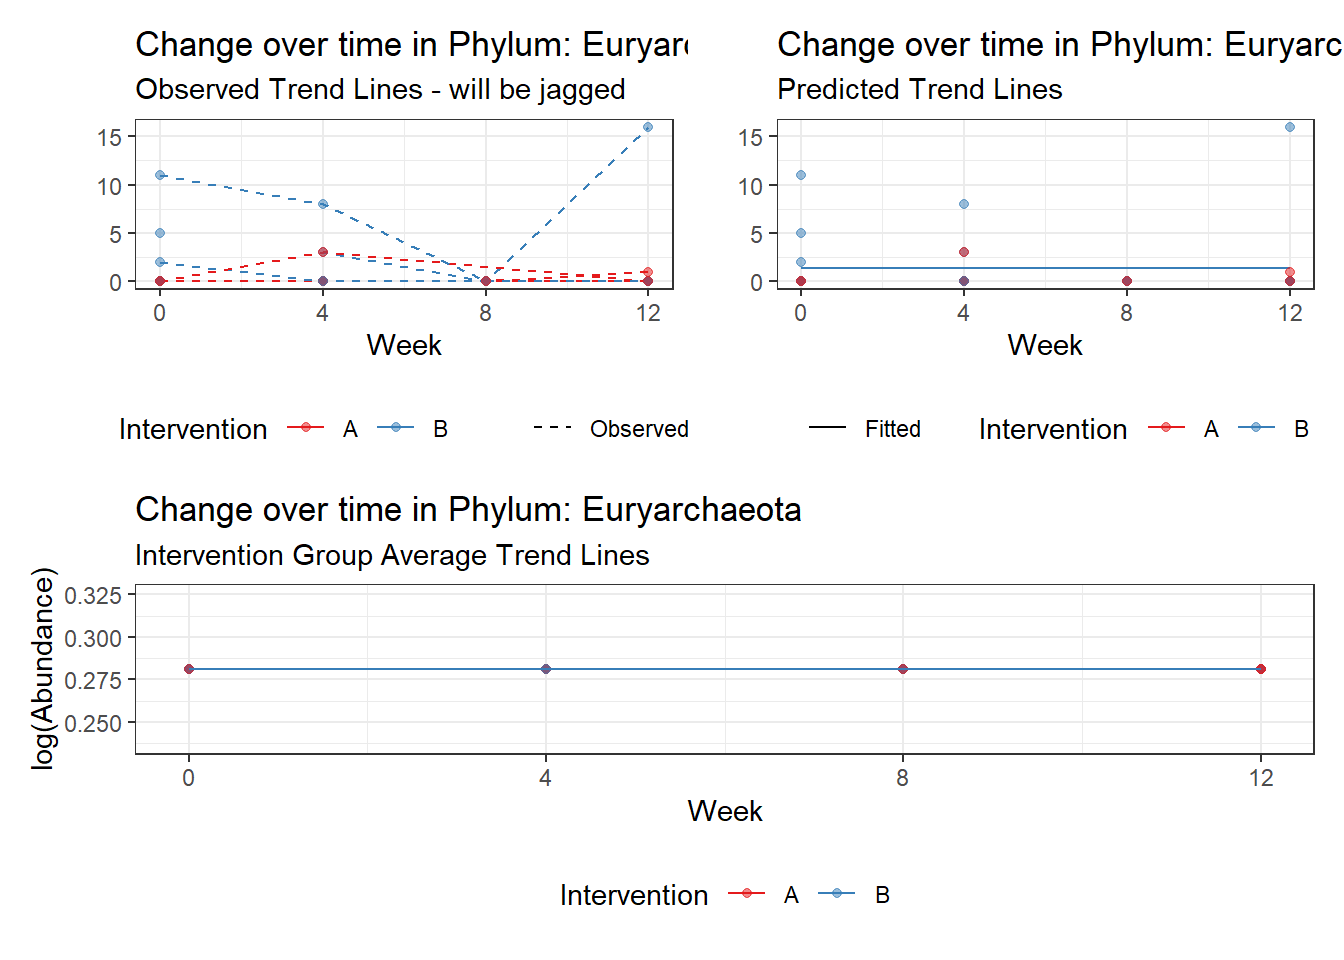
Model:  Euryarchaeota ~ 1 + (1 | SubjectID)
<environment: 0x000000004e7b2968>

Link:    negbinom
boundary (singular) fit: see ?isSingular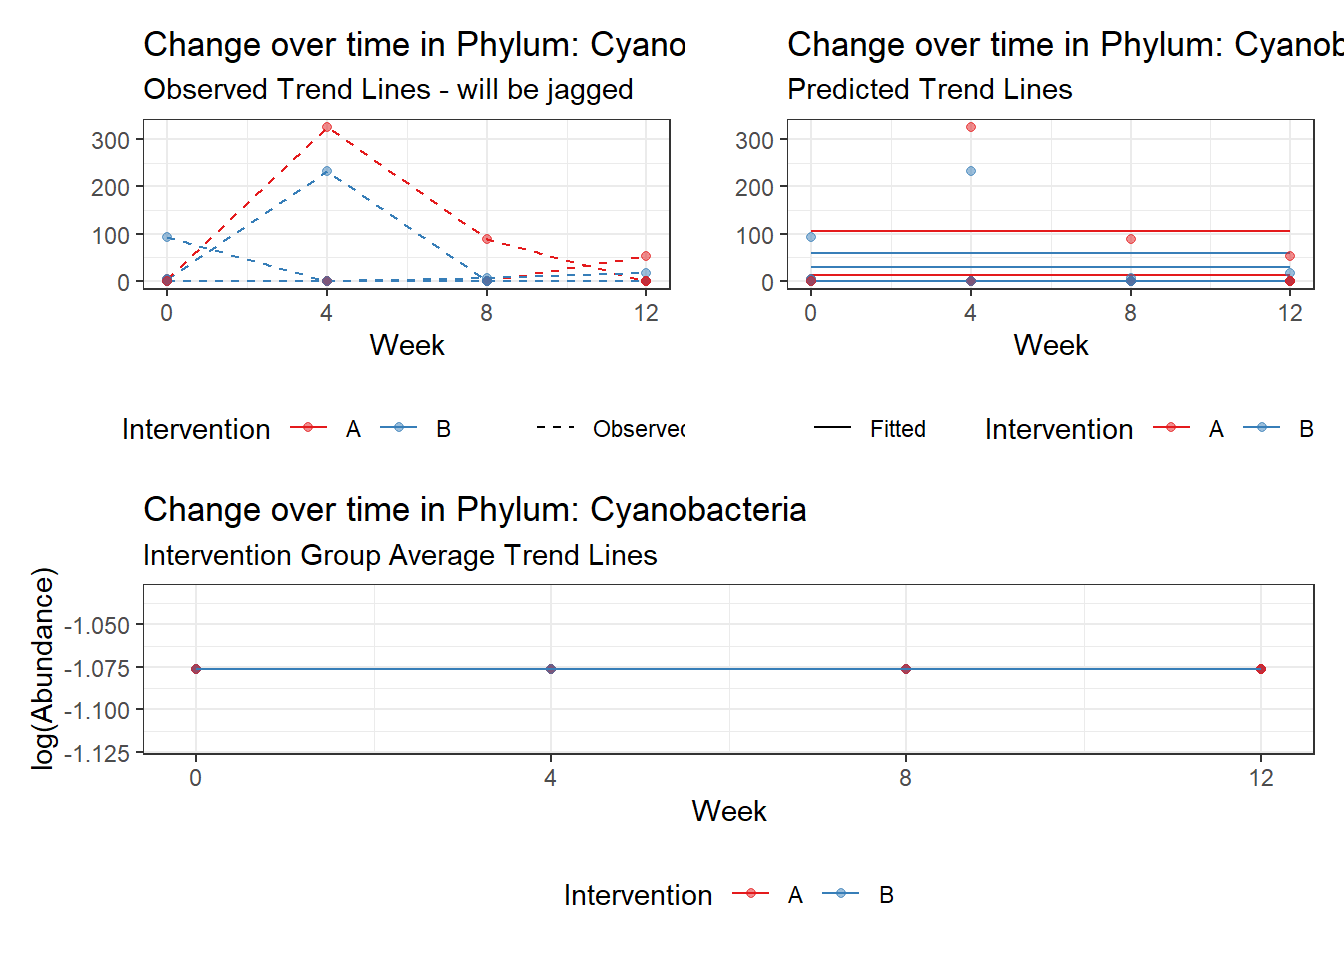
Intraclass Correlation (ICC): 0
Fixed Effects (change in log)

                  Outcome Estimate Std. Error z value Pr(>|z|)
(Intercept) Euryarchaeota   0.2809    0.56099 0.50072  0.61657


Random Effects (SD on log scale)

 Groups    Name        Std.Dev.
 SubjectID (Intercept) 0

Significance test not available for random effects

#########################################
#########################################
Model:  Firmicutes ~ 1 + (1 | SubjectID)
<environment: 0x000000004e7b2968>

Link:    negbinom


Intraclass Correlation (ICC):   0.12232
Fixed Effects (change in log)

               Outcome Estimate Std. Error  z value Pr(>|z|)
(Intercept) Firmicutes  7.95573     0.1162 68.46622        0


Random Effects (SD on log scale)

 Groups    Name        Std.Dev.
 SubjectID (Intercept) 0.37332

Significance test not available for random effects

#########################################
#########################################
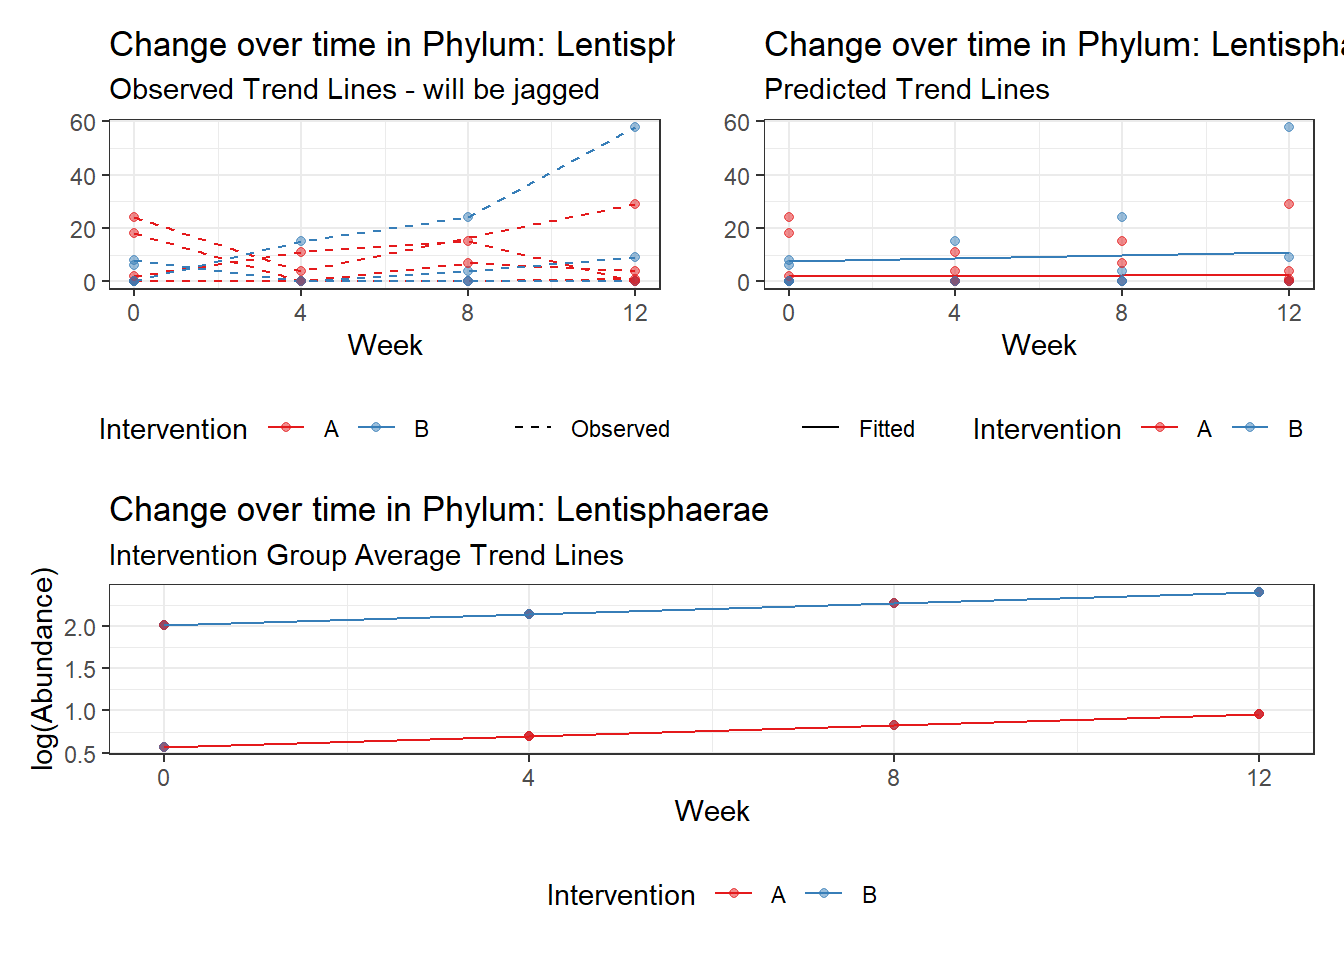
Model:  Lentisphaerae ~ 1 + (1 | SubjectID)
<environment: 0x000000004e7b2968>

Link:    negbinom
Warning in checkConv(attr(opt, "derivs"), opt$par, ctrl = control$checkConv, :
Model failed to converge with max|grad| = 0.0470305 (tol = 0.002, component 1)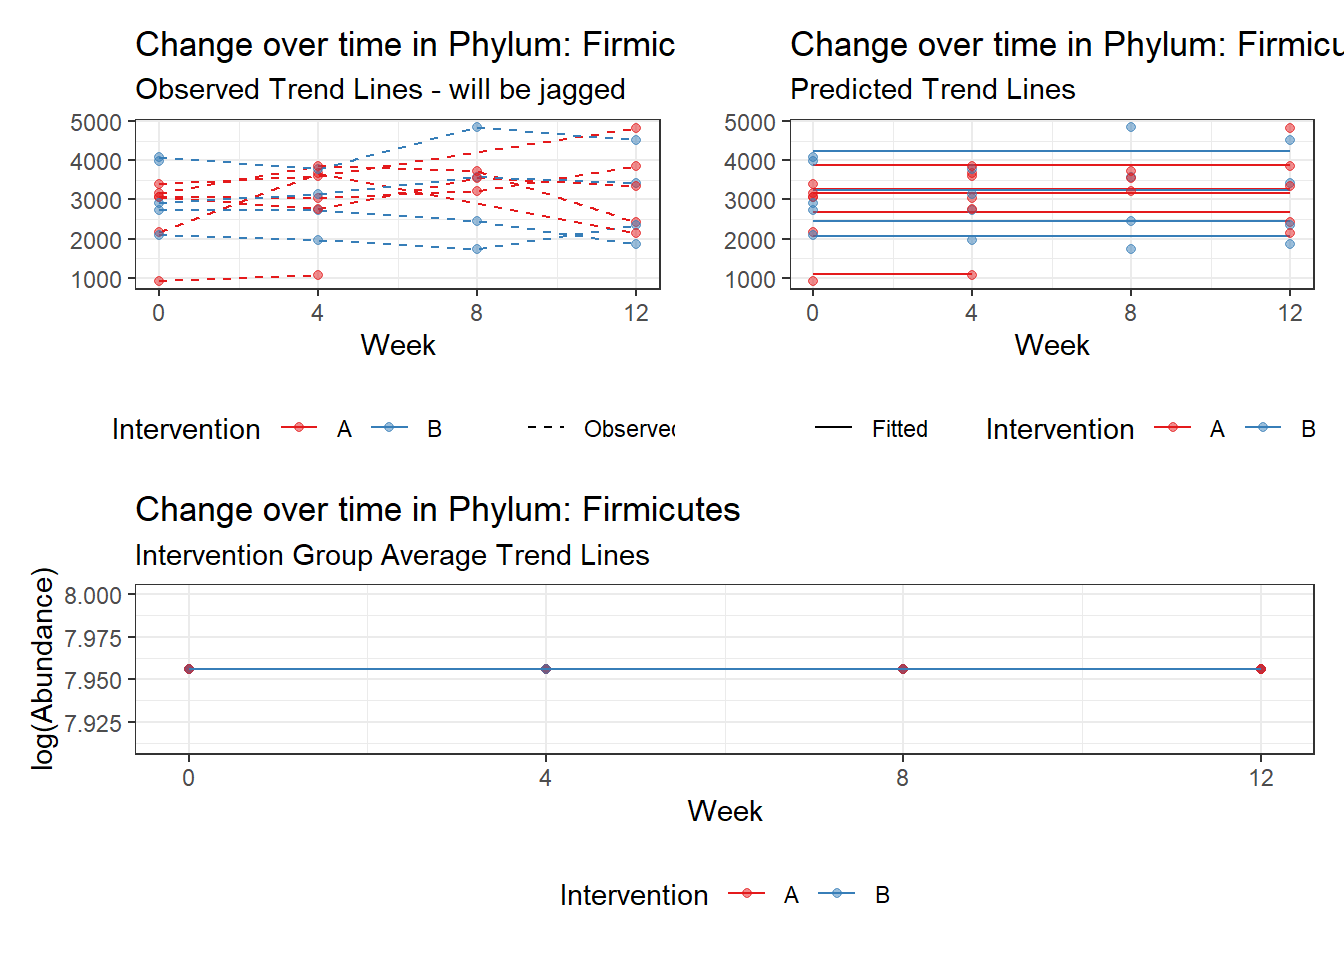
Intraclass Correlation (ICC): 0.8198321

Fixed Effects (change in log)

                  Outcome Estimate Std. Error z value Pr(>|z|)
(Intercept) Lentisphaerae  0.39317    0.85549 0.45959  0.64581


Random Effects (SD on log scale)

 Groups    Name        Std.Dev.
 SubjectID (Intercept) 2.1332

Significance test not available for random effects

#########################################
#########################################
Model:  Proteobacteria ~ 1 + (1 | SubjectID)
<environment: 0x000000004e7b2968>

Link:    negbinom


Intraclass Correlation (ICC):   0.02528622
Fixed Effects (change in log)

                   Outcome Estimate Std. Error  z value Pr(>|z|)
(Intercept) Proteobacteria   5.7389    0.11704 49.03538        0


Random Effects (SD on log scale)

 Groups    Name        Std.Dev.
 SubjectID (Intercept) 0.16107

Significance test not available for random effects

#########################################
#########################################
Model:  Tenericutes ~ 1 + (1 | SubjectID)
<environment: 0x000000004e7b2968>

Link:    negbinom
Warning in theta.ml(Y, mu, weights = object@resp$weights, limit = limit, :
iteration limit reached
Warning in theta.ml(Y, mu, weights = object@resp$weights, limit = limit, : NaNs
produced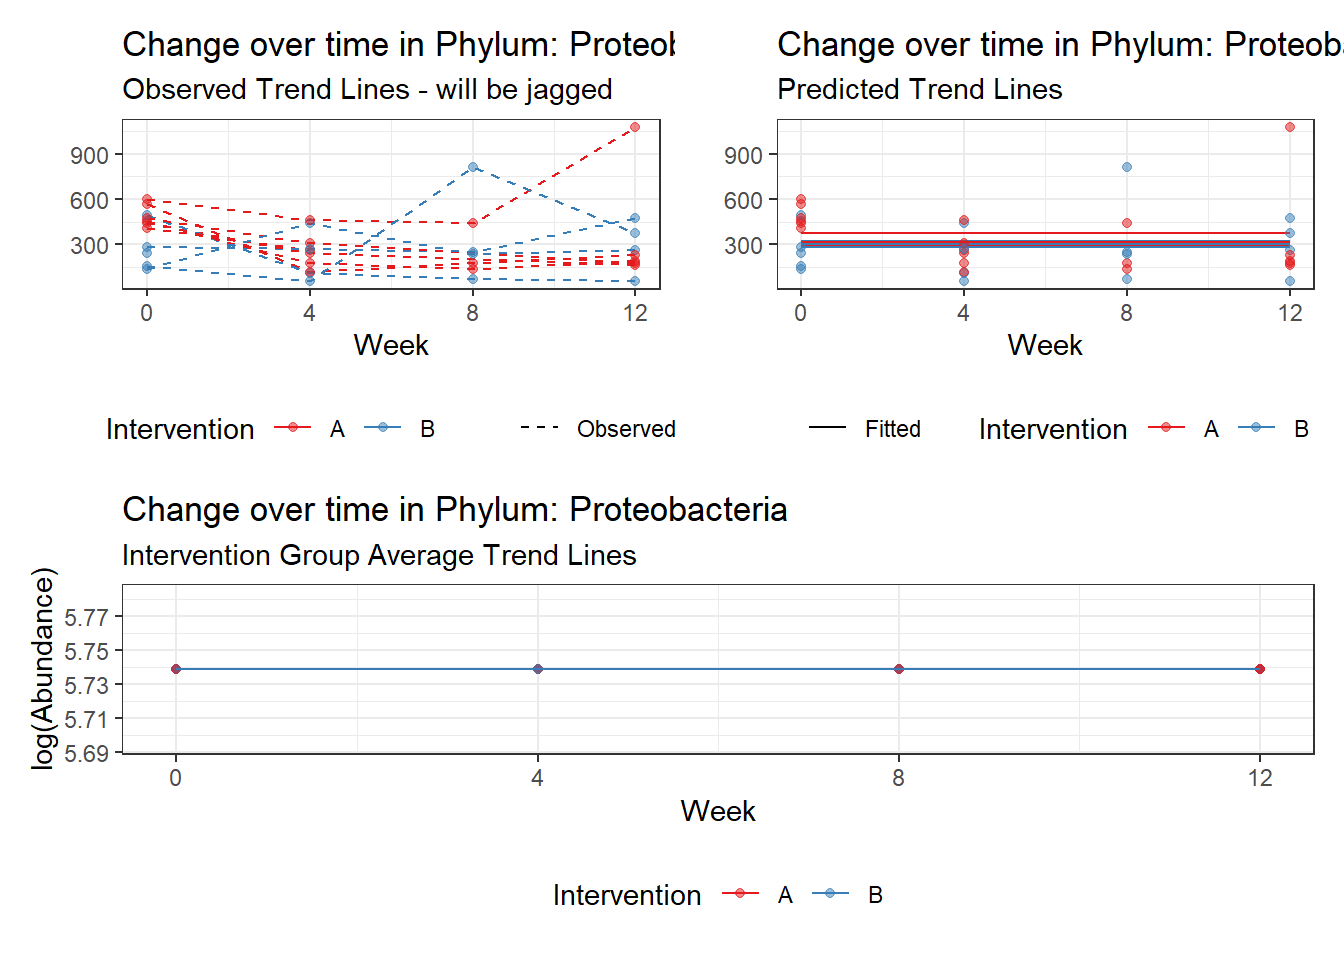
Intraclass Correlation (ICC): 0.915808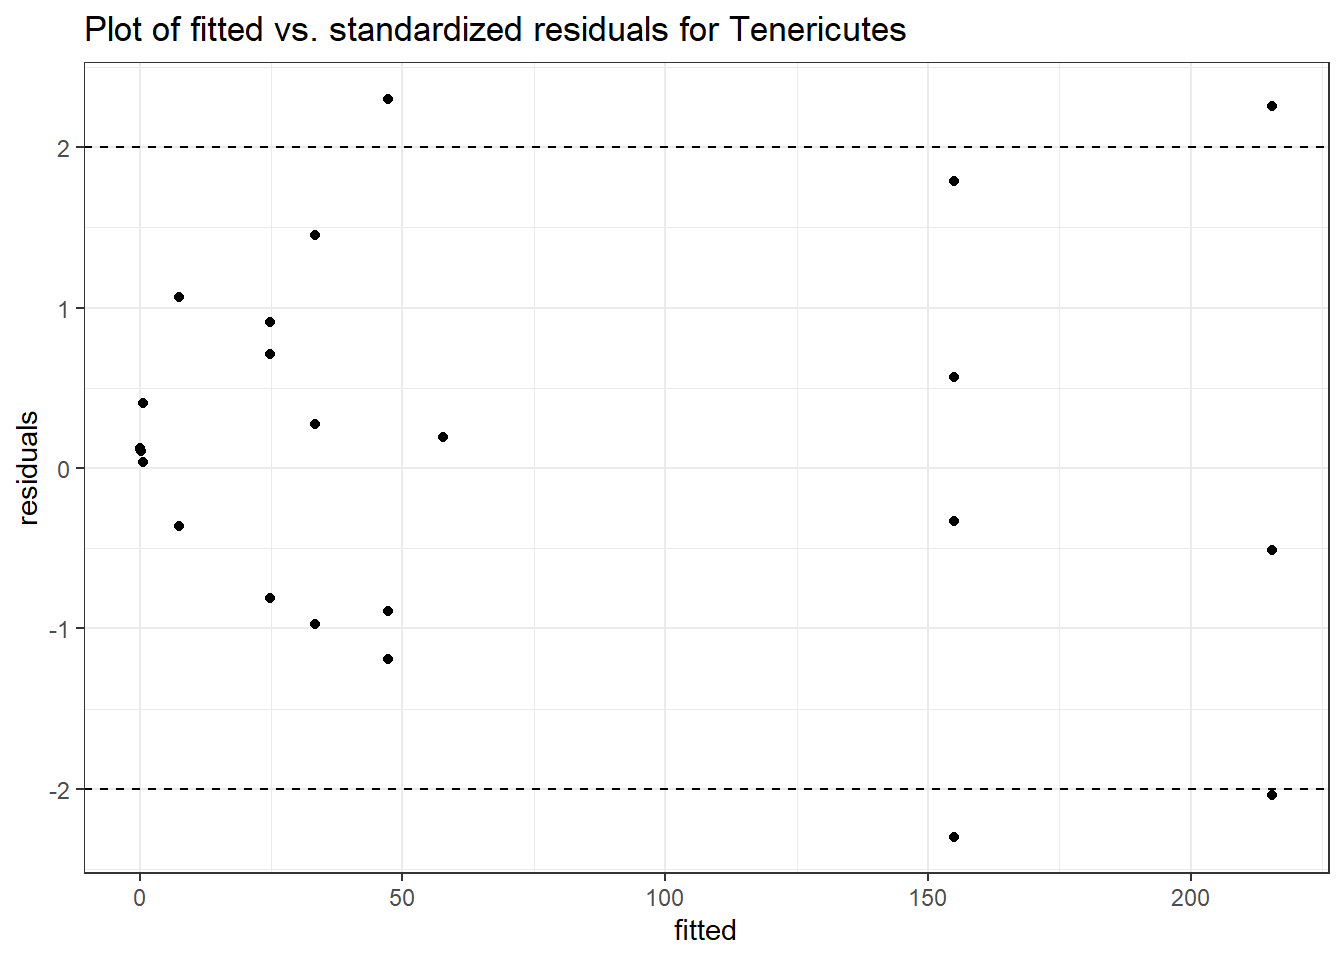
Fixed Effects (change in log)

                Outcome Estimate Std. Error z value Pr(>|z|)
(Intercept) Tenericutes  1.54525    1.07089 1.44296  0.14903


Random Effects (SD on log scale)

 Groups    Name        Std.Dev.
 SubjectID (Intercept) 3.2981

Significance test not available for random effects

#########################################
#########################################
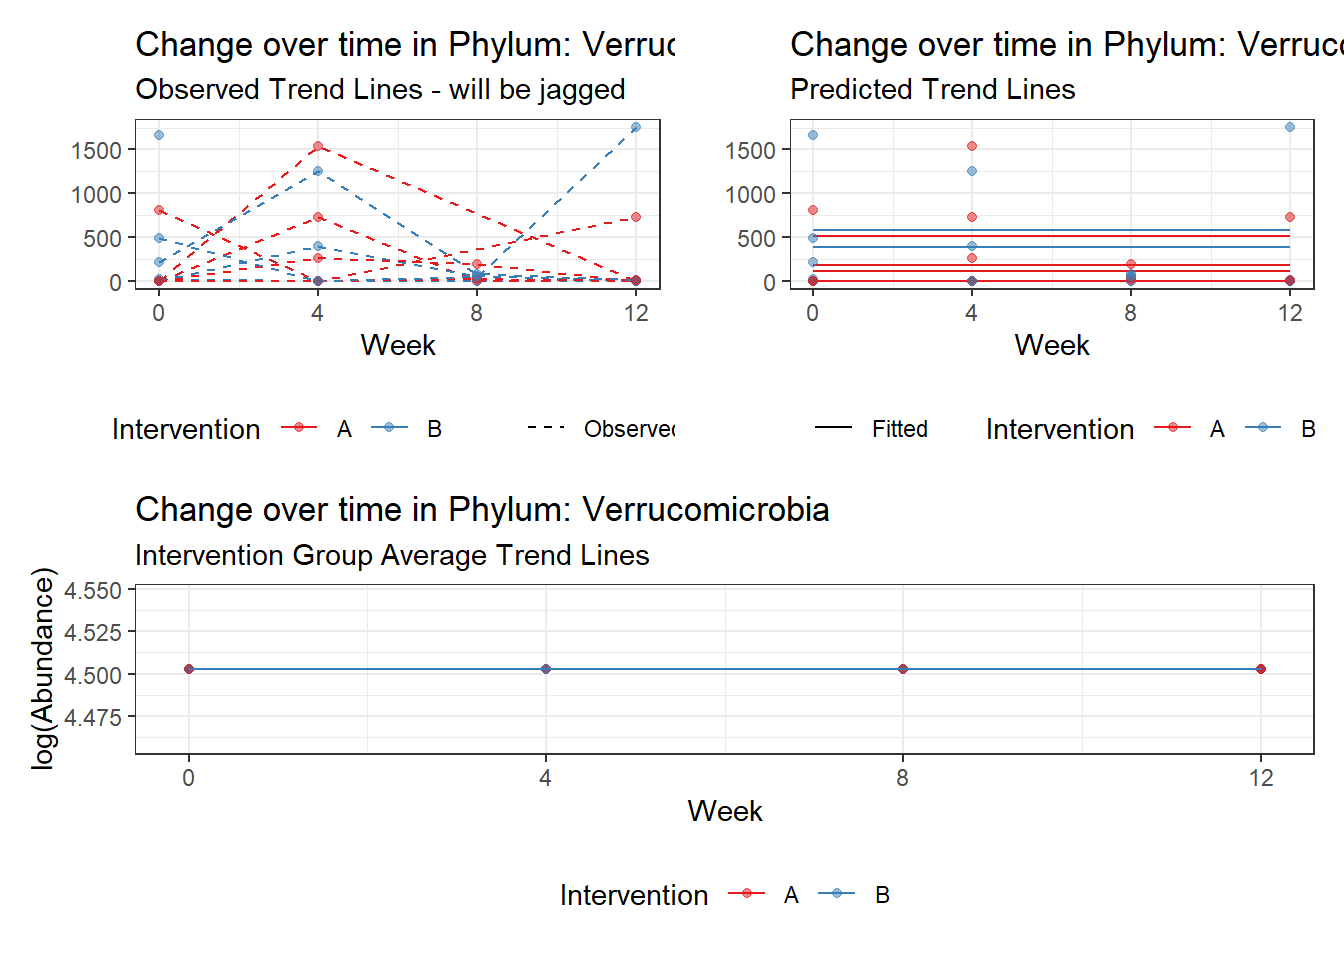
Model:  Verrucomicrobia ~ 1 + (1 | SubjectID)
<environment: 0x000000004e7b2968>

Link:    negbinom
Warning in theta.ml(Y, mu, weights = object@resp$weights, limit = limit, :
iteration limit reached
Warning in theta.ml(Y, mu, weights = object@resp$weights, limit = limit, : NaNs
produced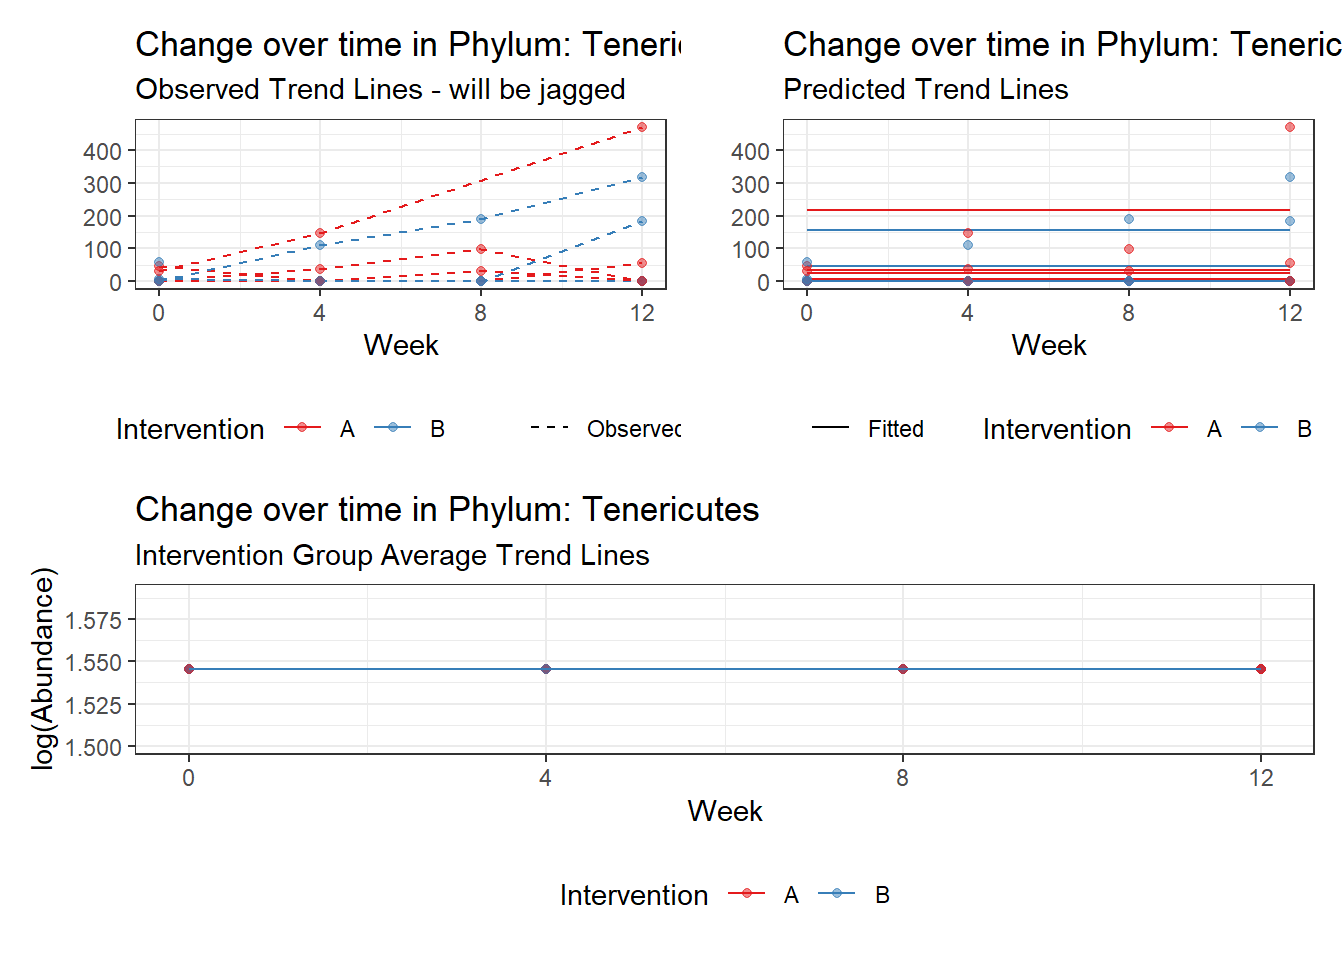
Intraclass Correlation (ICC): 0.8611513
Fixed Effects (change in log)

                    Outcome Estimate Std. Error z value Pr(>|z|)
(Intercept) Verrucomicrobia  4.50251    0.75647 5.95201        0


Random Effects (SD on log scale)

 Groups    Name        Std.Dev.
 SubjectID (Intercept) 2.4904

Significance test not available for random effects
Fixed Effect of Time
\[\begin{align*} h\left(Y_{ij}\right)&=\beta_{0j} + \beta_{1j}*(Week)_{ij}+ r_{ij}\\ \beta_{0j}&= \gamma_{00} + u_{0j}\\ \beta_{1j}&= \gamma_{10}\\ \end{align*}\]
phylum.fit1 <- glmm_microbiome(mydata=microbiome_data,model.number=1,
                               taxa.level="Phylum", link="poisson",
                               model="1 + time + (1|SubjectID)")
#########################################
#########################################
Model:  Actinobacteria ~ 1 + time + (1 | SubjectID)
<environment: 0x00000000381f96c0>

Link:    poisson


Intraclass Correlation (ICC):   0.4983818

Fixed Effects (change in log)

                   Outcome Estimate Std. Error z value Pr(>|z|)
(Intercept) Actinobacteria  2.50315    0.30833 8.11831        0
time        Actinobacteria  0.17905    0.03052 5.86651        0


Random Effects (SD on log scale)

 Groups    Name        Std.Dev.
 SubjectID (Intercept) 0.99677

Significance test not available for random effects

#########################################
#########################################
Model:  Bacteroidetes ~ 1 + time + (1 | SubjectID)
<environment: 0x00000000381f96c0>

Link:    poisson


Intraclass Correlation (ICC):   0.1810136

Fixed Effects (change in log)

                  Outcome Estimate Std. Error   z value Pr(>|z|)
(Intercept) Bacteroidetes  8.00956    0.14184  56.46826        0
time        Bacteroidetes -0.03231    0.00265 -12.17927        0


Random Effects (SD on log scale)

 Groups    Name        Std.Dev.
 SubjectID (Intercept) 0.47013

Significance test not available for random effects

#########################################
#########################################
Model:  Cyanobacteria ~ 1 + time + (1 | SubjectID)
<environment: 0x00000000381f96c0>

Link:    poisson


Intraclass Correlation (ICC):   0.944816

Fixed Effects (change in log)

                  Outcome Estimate Std. Error  z value Pr(>|z|)
(Intercept) Cyanobacteria -0.79541    1.68718 -0.47144  0.63732
time        Cyanobacteria -0.27255    0.03201 -8.51538  0.00000


Random Effects (SD on log scale)

 Groups    Name        Std.Dev.
 SubjectID (Intercept) 4.1378

Significance test not available for random effects

#########################################
#########################################
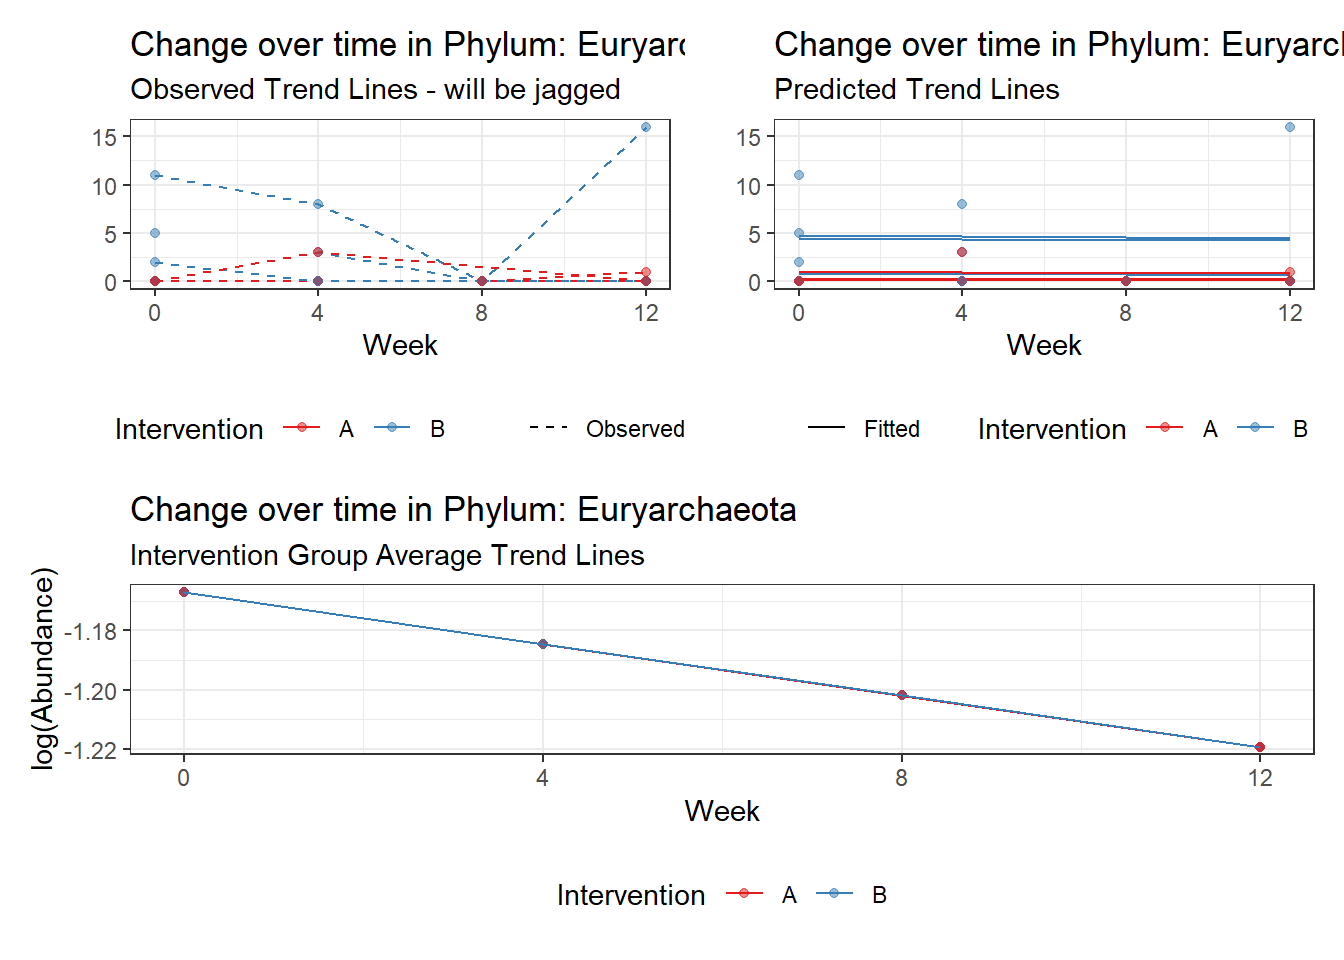
Model:  Euryarchaeota ~ 1 + time + (1 | SubjectID)
<environment: 0x00000000381f96c0>

Link:    poisson


Intraclass Correlation (ICC):   0.8154851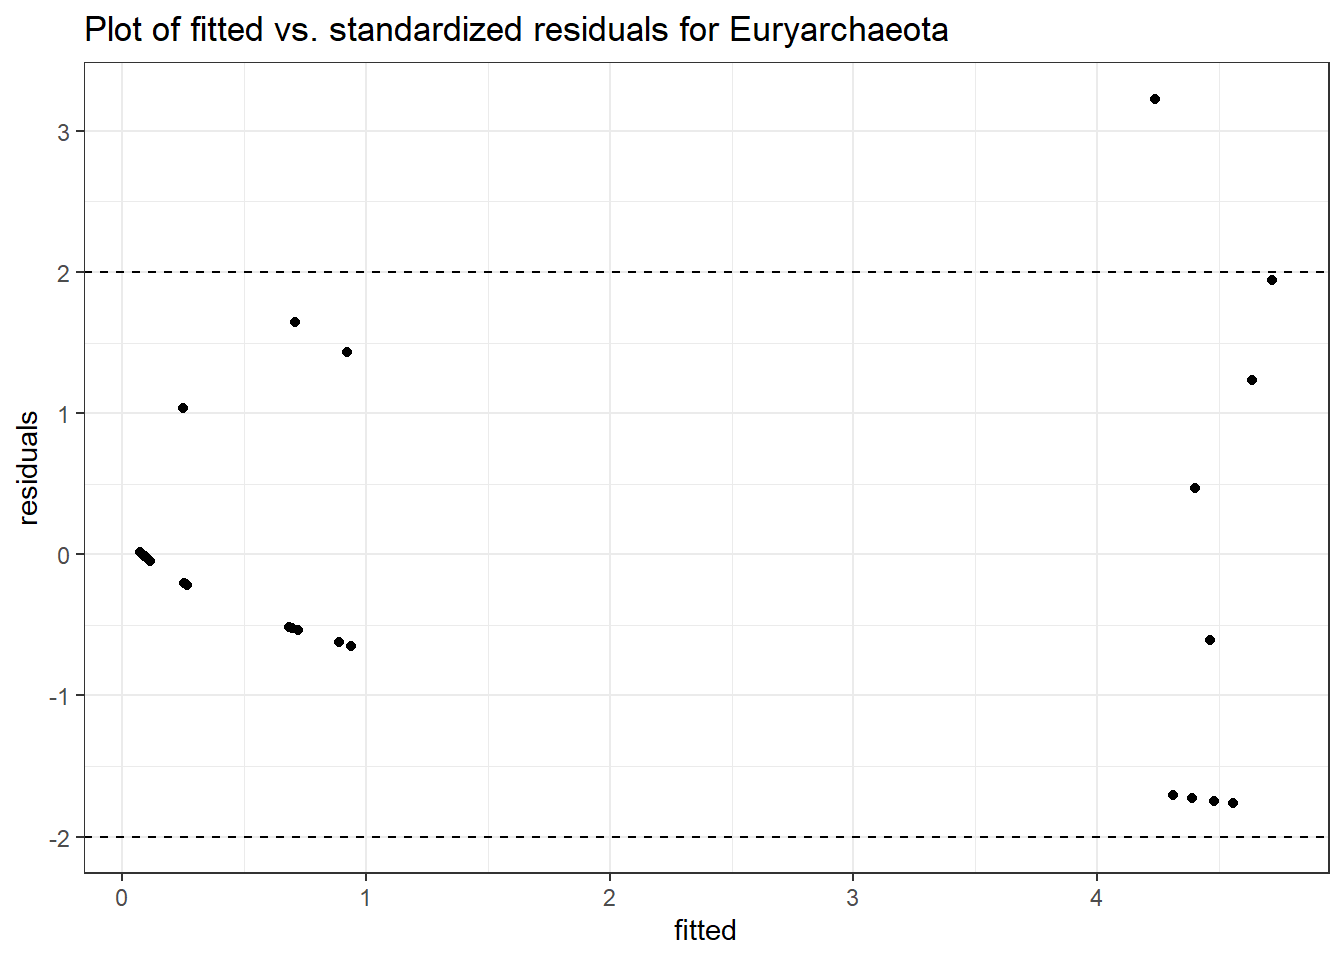
Fixed Effects (change in log)

                  Outcome Estimate Std. Error  z value Pr(>|z|)
(Intercept) Euryarchaeota -1.16699    0.88479 -1.31895  0.18718
time        Euryarchaeota -0.01744    0.13284 -0.13128  0.89555


Random Effects (SD on log scale)

 Groups    Name        Std.Dev.
 SubjectID (Intercept) 2.1023

Significance test not available for random effects

#########################################
#########################################
Model:  Firmicutes ~ 1 + time + (1 | SubjectID)
<environment: 0x00000000381f96c0>

Link:    poisson


Intraclass Correlation (ICC):   0.1323942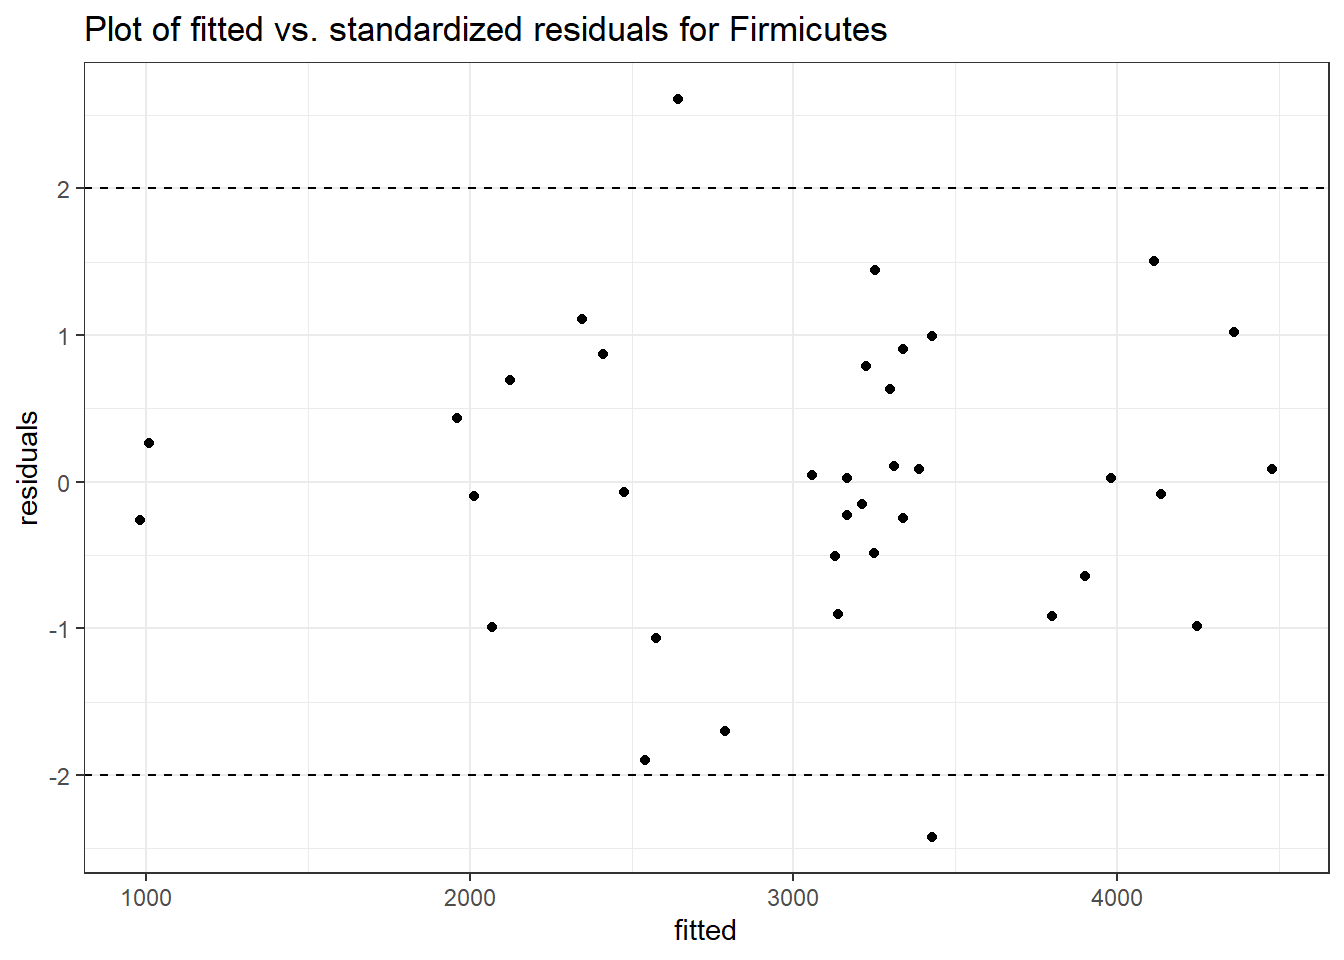

Fixed Effects (change in log)

               Outcome Estimate Std. Error  z value Pr(>|z|)
(Intercept) Firmicutes  7.92162    0.11788 67.19813        0
time        Firmicutes  0.02657    0.00267  9.96805        0


Random Effects (SD on log scale)

 Groups    Name        Std.Dev.
 SubjectID (Intercept) 0.39064

Significance test not available for random effects

#########################################
#########################################
Model:  Lentisphaerae ~ 1 + time + (1 | SubjectID)
<environment: 0x00000000381f96c0>

Link:    poisson


Intraclass Correlation (ICC):   0.8556128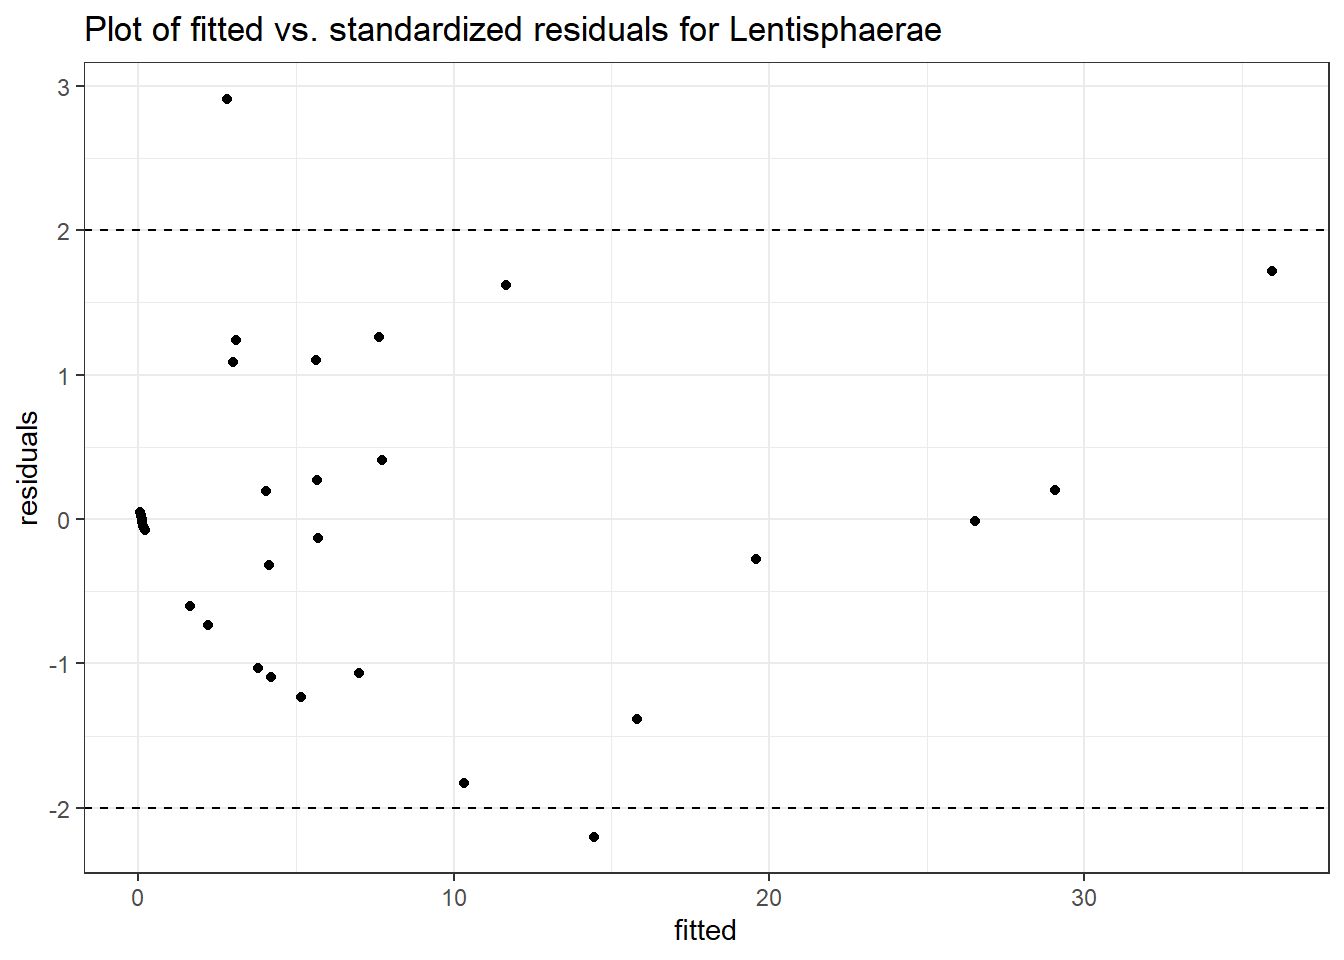

Fixed Effects (change in log)

                  Outcome Estimate Std. Error  z value Pr(>|z|)
(Intercept) Lentisphaerae -0.15789    0.86771 -0.18197  0.85561
time        Lentisphaerae  0.30395    0.05824  5.21848  0.00000


Random Effects (SD on log scale)

 Groups    Name        Std.Dev.
 SubjectID (Intercept) 2.4343

Significance test not available for random effects

#########################################
#########################################
Model:  Proteobacteria ~ 1 + time + (1 | SubjectID)
<environment: 0x00000000381f96c0>

Link:    poisson


Intraclass Correlation (ICC):   0.08443468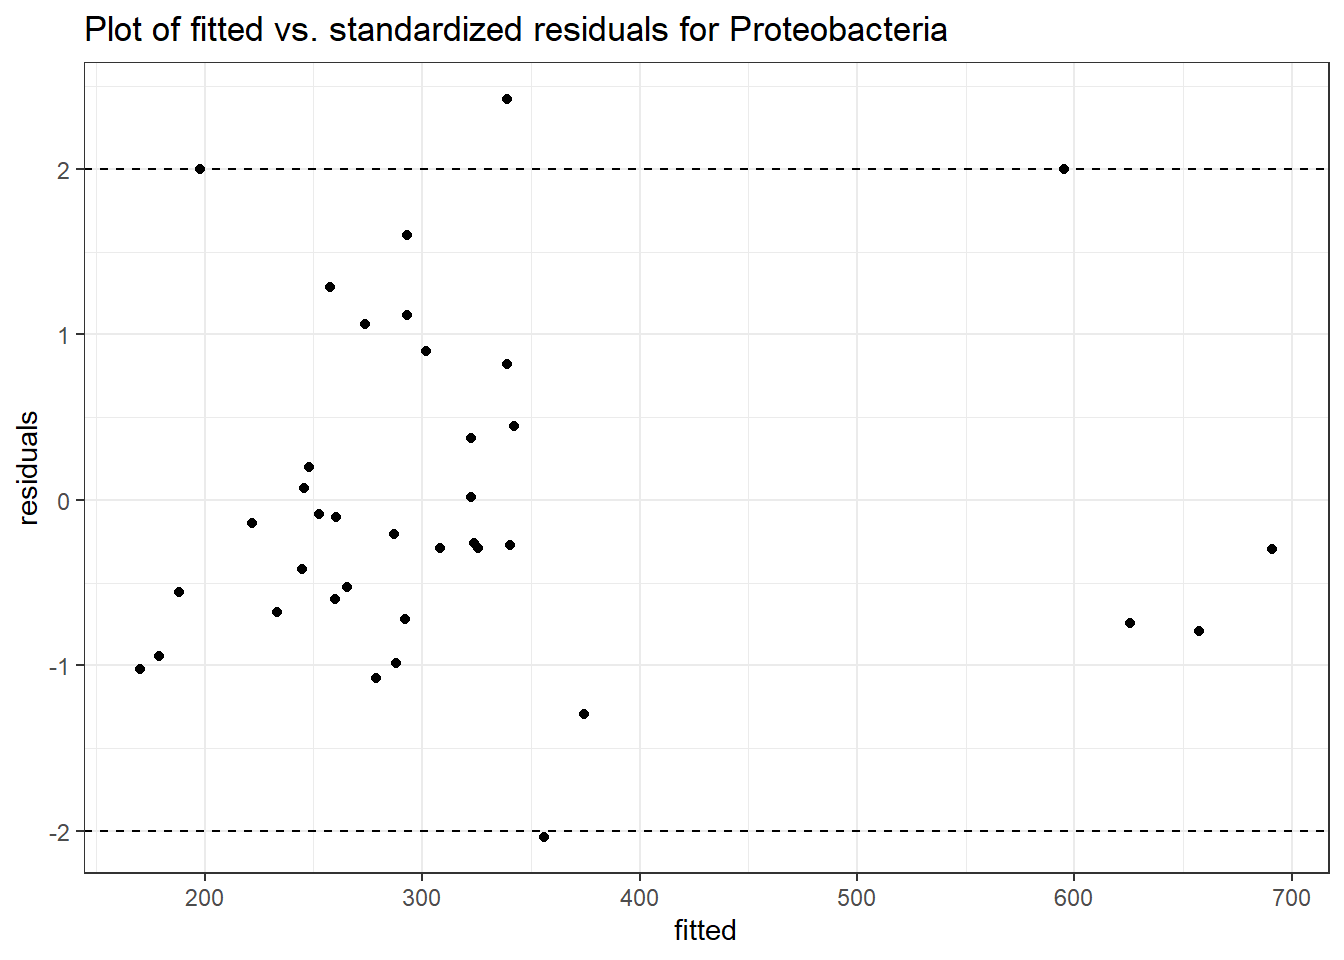
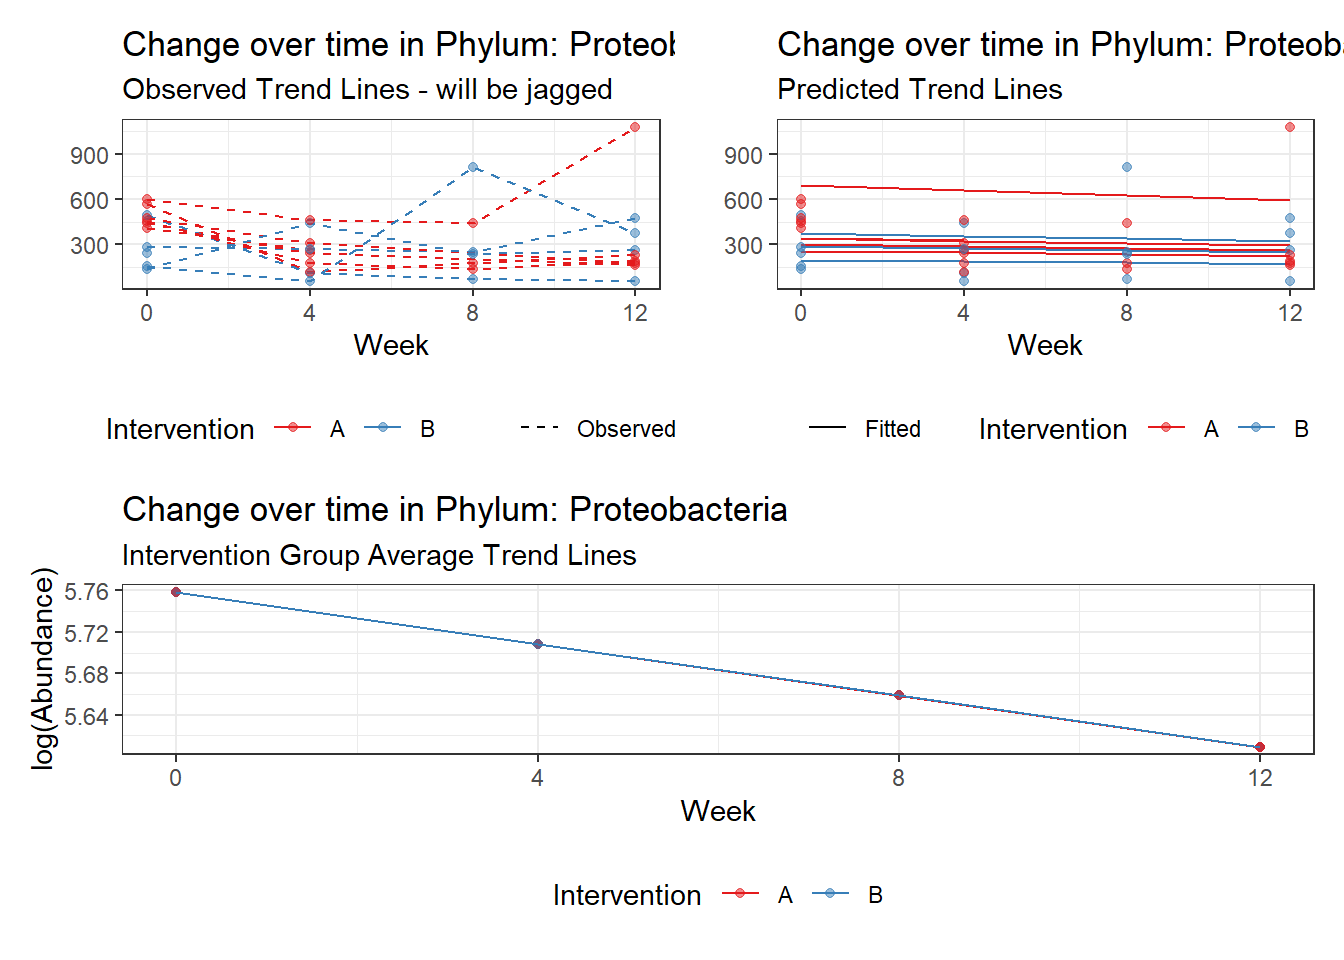
Fixed Effects (change in log)

                   Outcome Estimate Std. Error  z value Pr(>|z|)
(Intercept) Proteobacteria  5.75835    0.09273 62.10061        0
time        Proteobacteria -0.04969    0.00838 -5.93193        0


Random Effects (SD on log scale)

 Groups    Name        Std.Dev.
 SubjectID (Intercept) 0.30368

Significance test not available for random effects

#########################################
#########################################
Model:  Tenericutes ~ 1 + time + (1 | SubjectID)
<environment: 0x00000000381f96c0>

Link:    poisson


Intraclass Correlation (ICC):   0.9163098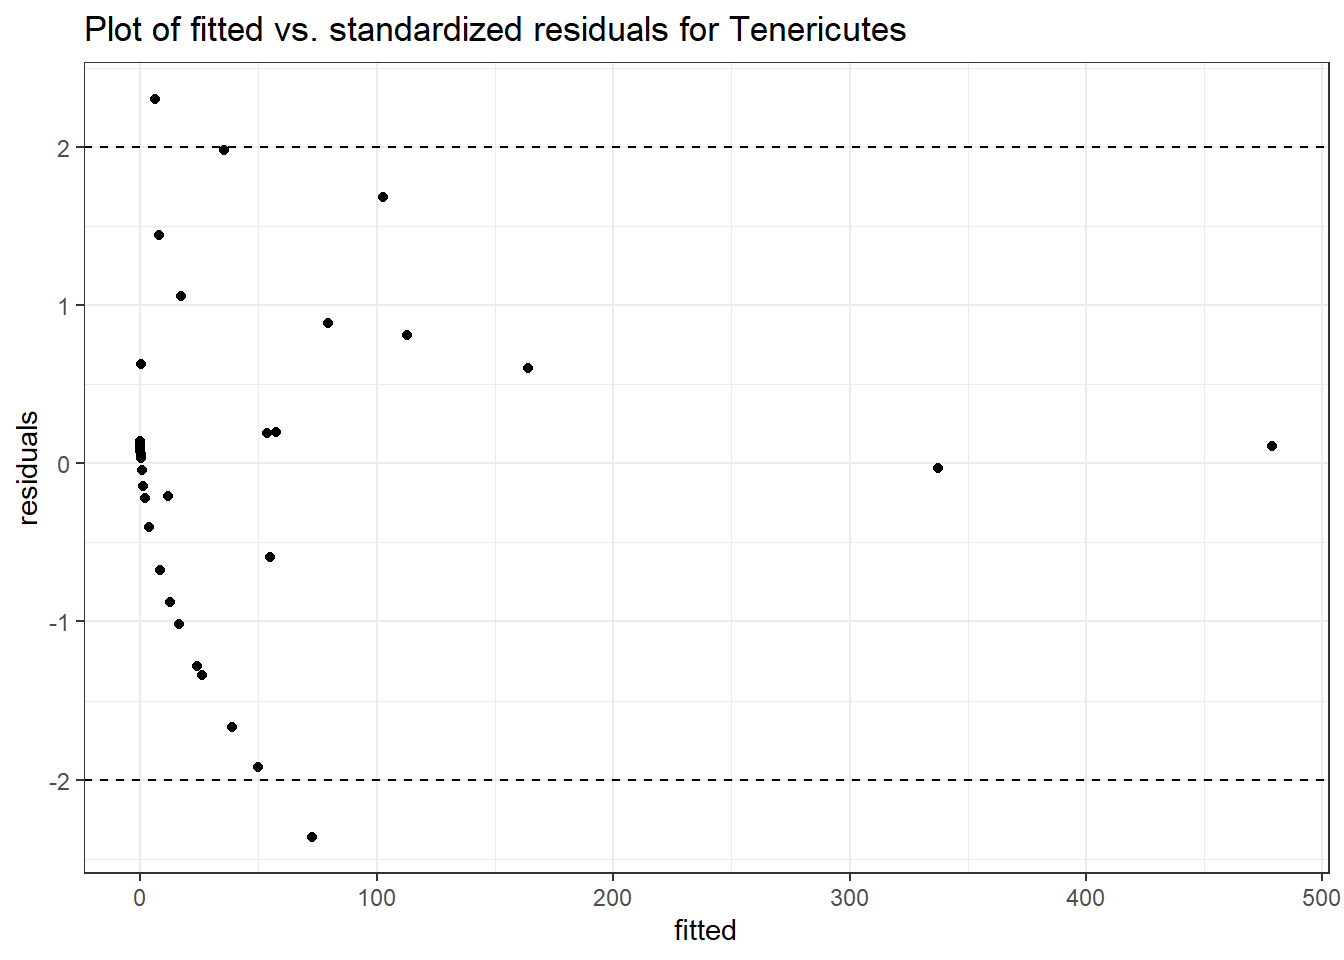
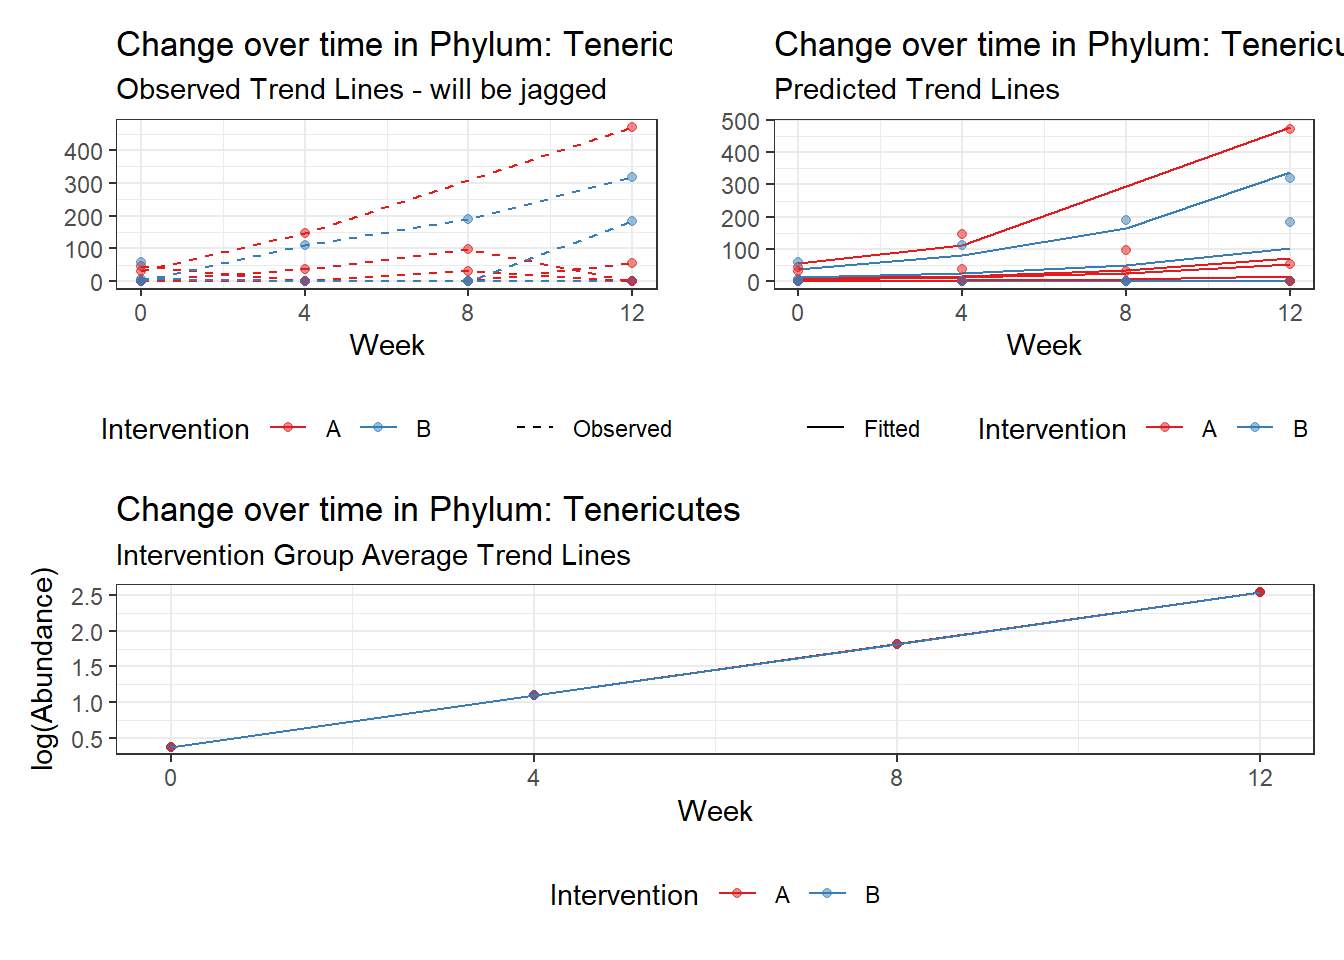
Fixed Effects (change in log)

                Outcome Estimate Std. Error  z value Pr(>|z|)
(Intercept) Tenericutes  0.37537    1.03749  0.36181  0.71749
time        Tenericutes  0.72193    0.02489 29.01006  0.00000


Random Effects (SD on log scale)

 Groups    Name        Std.Dev.
 SubjectID (Intercept) 3.3089

Significance test not available for random effects

#########################################
#########################################
Model:  Verrucomicrobia ~ 1 + time + (1 | SubjectID)
<environment: 0x00000000381f96c0>

Link:    poisson


Intraclass Correlation (ICC):   0.8607546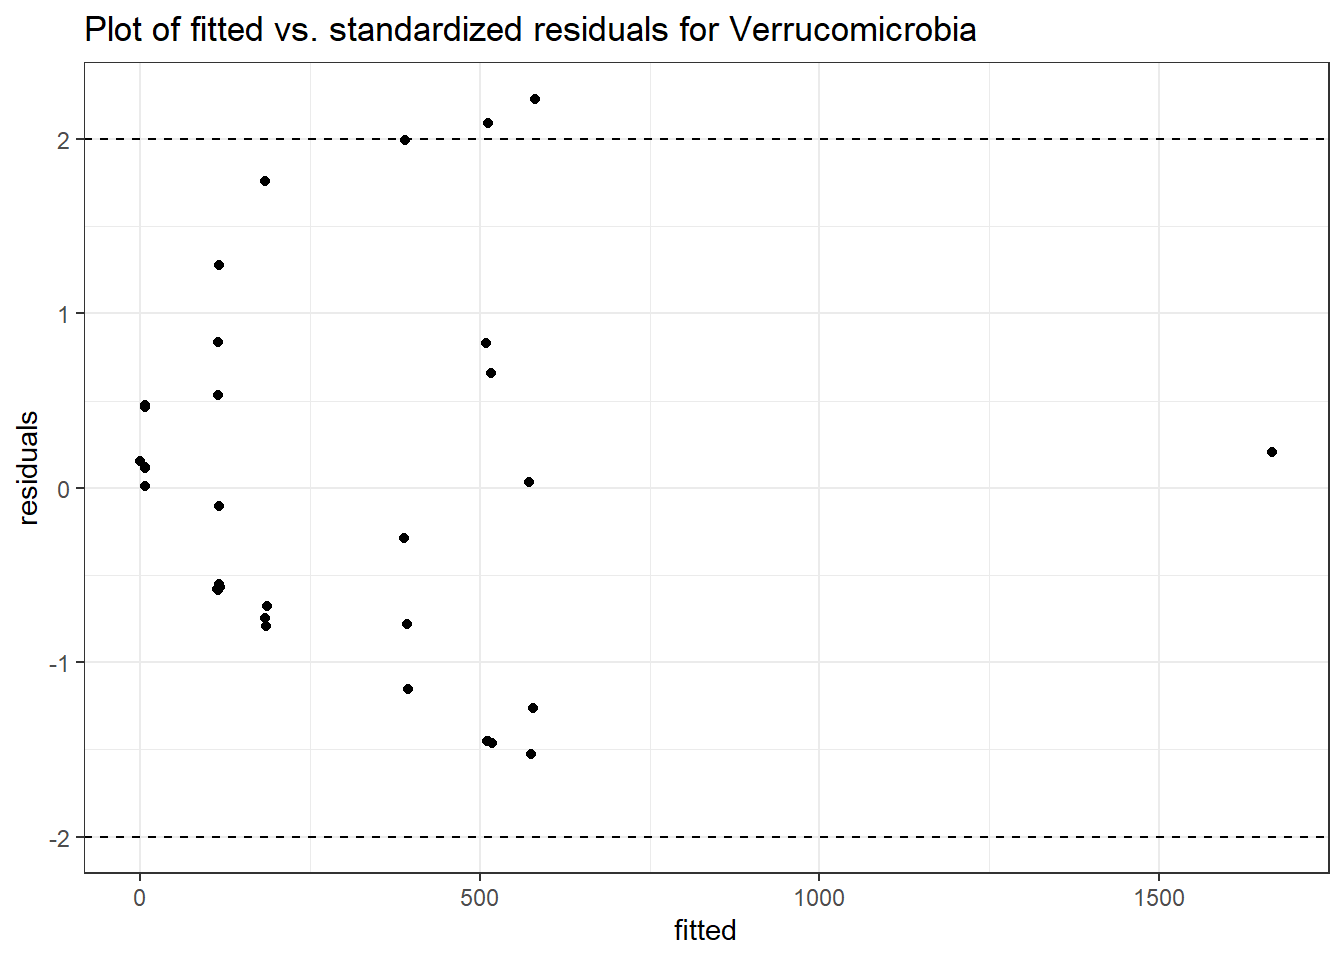
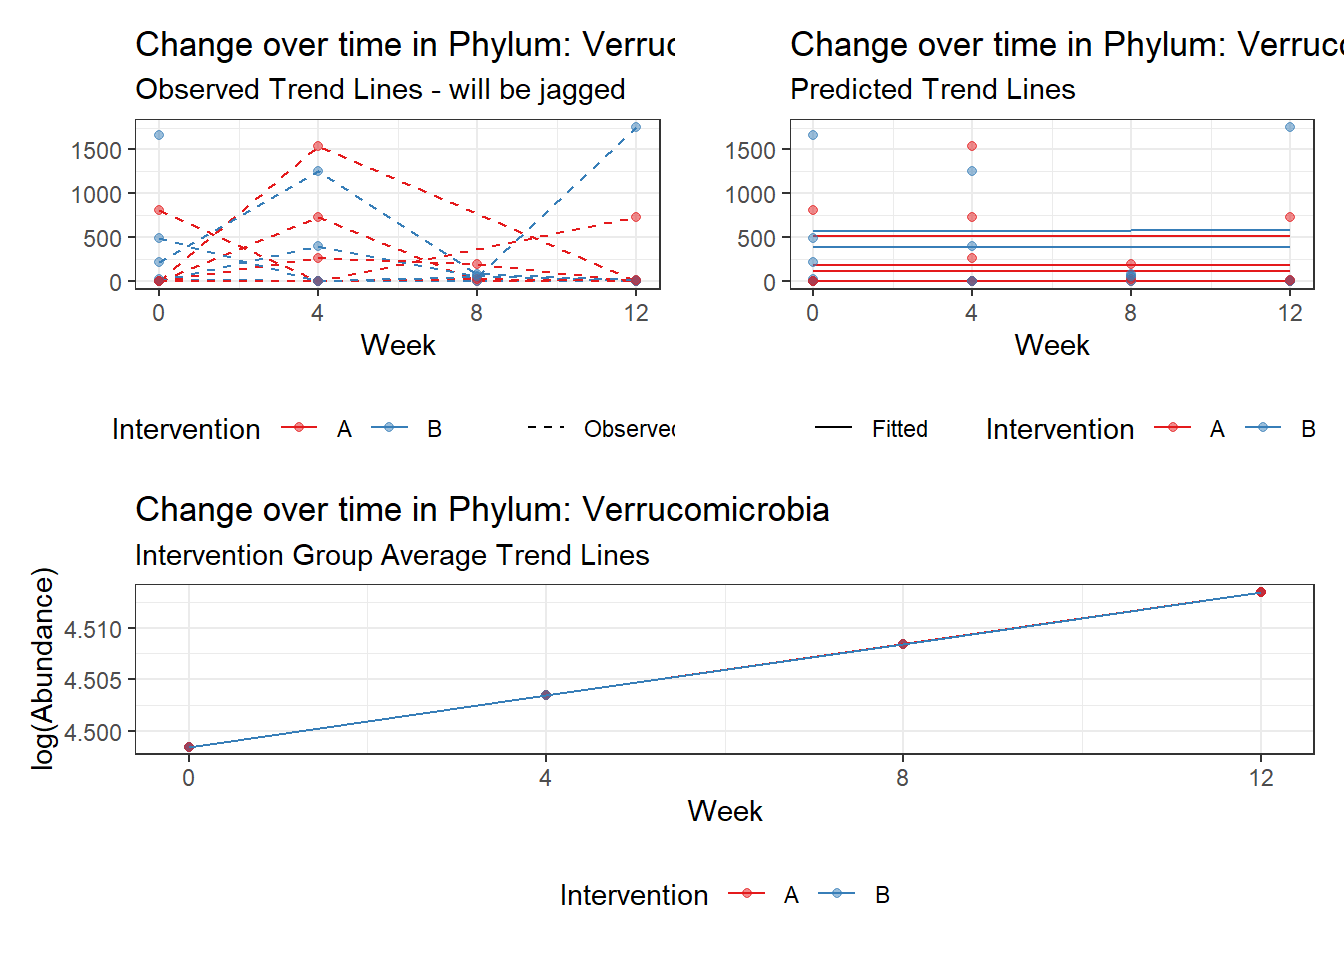
Fixed Effects (change in log)

                    Outcome Estimate Std. Error z value Pr(>|z|)
(Intercept) Verrucomicrobia  4.49846    0.75628 5.94816  0.00000
time        Verrucomicrobia  0.00500    0.00920 0.54317  0.58701


Random Effects (SD on log scale)

 Groups    Name        Std.Dev.
 SubjectID (Intercept) 2.4863

Significance test not available for random effects
phylum.fit1b <- glmm_microbiome(mydata=microbiome_data,model.number=1,
taxa.level="Phylum", link="negbinom",
model="1 + time + (1|SubjectID)")
#########################################
#########################################
Model:  Actinobacteria ~ 1 + time + (1 | SubjectID)
<environment: 0x000000003e389128>

Link:    negbinom


Intraclass Correlation (ICC):   0.375019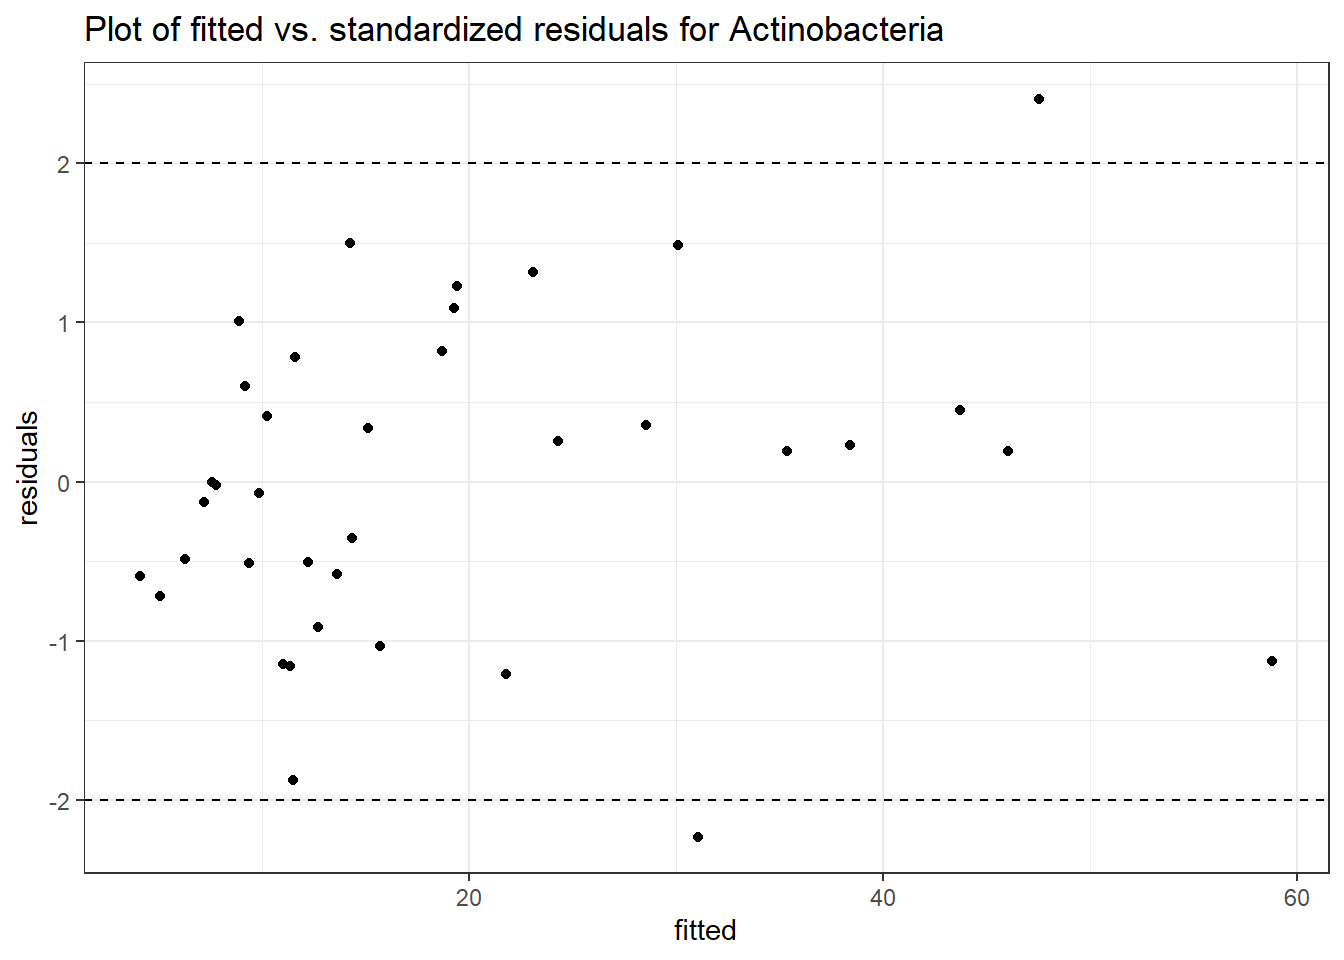
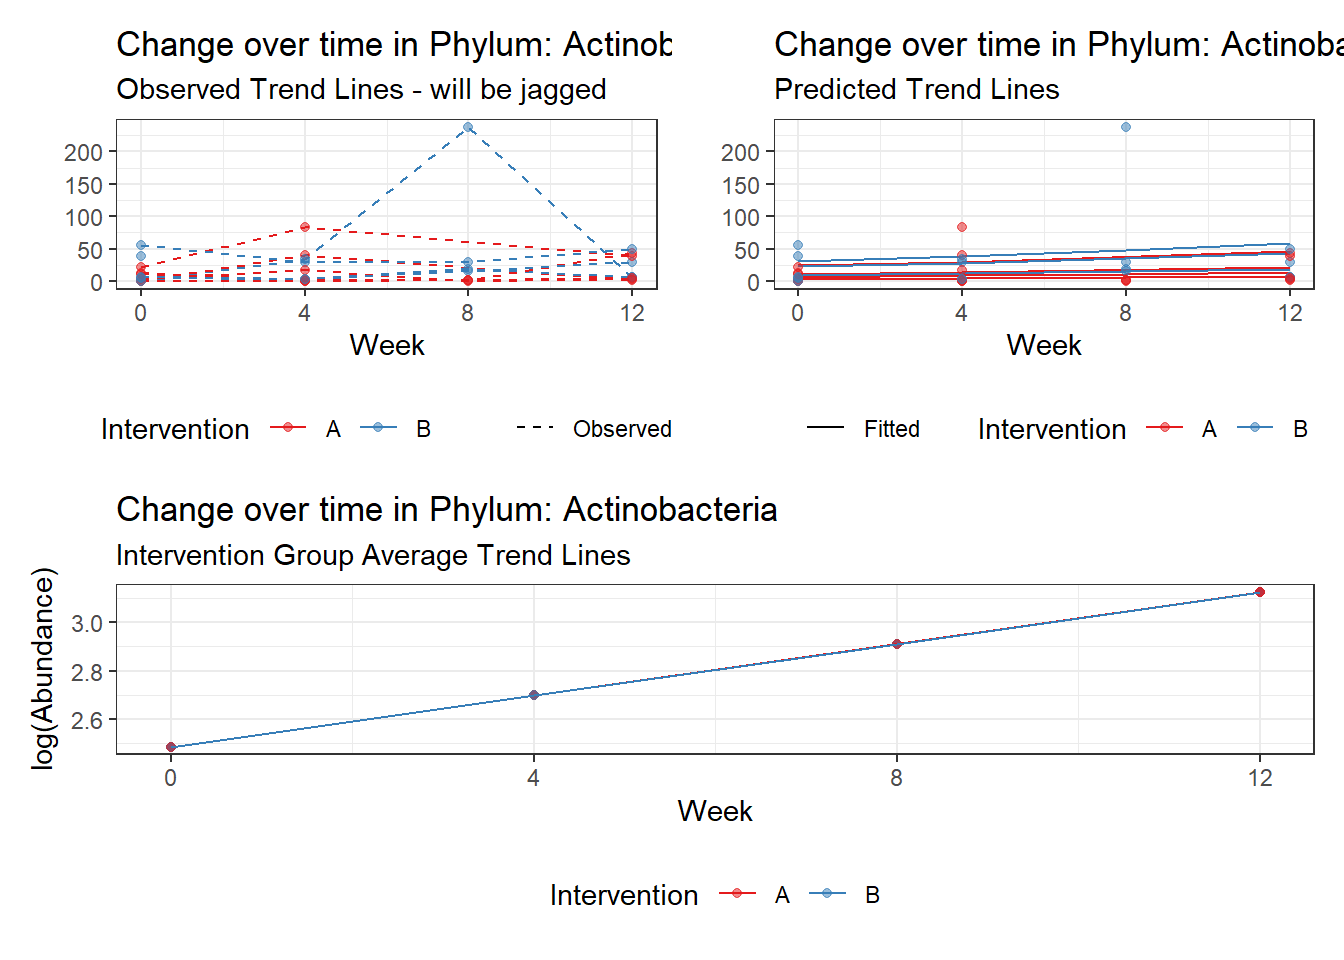
Fixed Effects (change in log)

                   Outcome Estimate Std. Error z value Pr(>|z|)
(Intercept) Actinobacteria  2.48613    0.40363 6.15948  0.00000
time        Actinobacteria  0.21298    0.18887 1.12762  0.25948


Random Effects (SD on log scale)

 Groups    Name        Std.Dev.
 SubjectID (Intercept) 0.77463

Significance test not available for random effects

#########################################
#########################################
Model:  Bacteroidetes ~ 1 + time + (1 | SubjectID)
<environment: 0x000000003e389128>

Link:    negbinom


Intraclass Correlation (ICC):   0.142895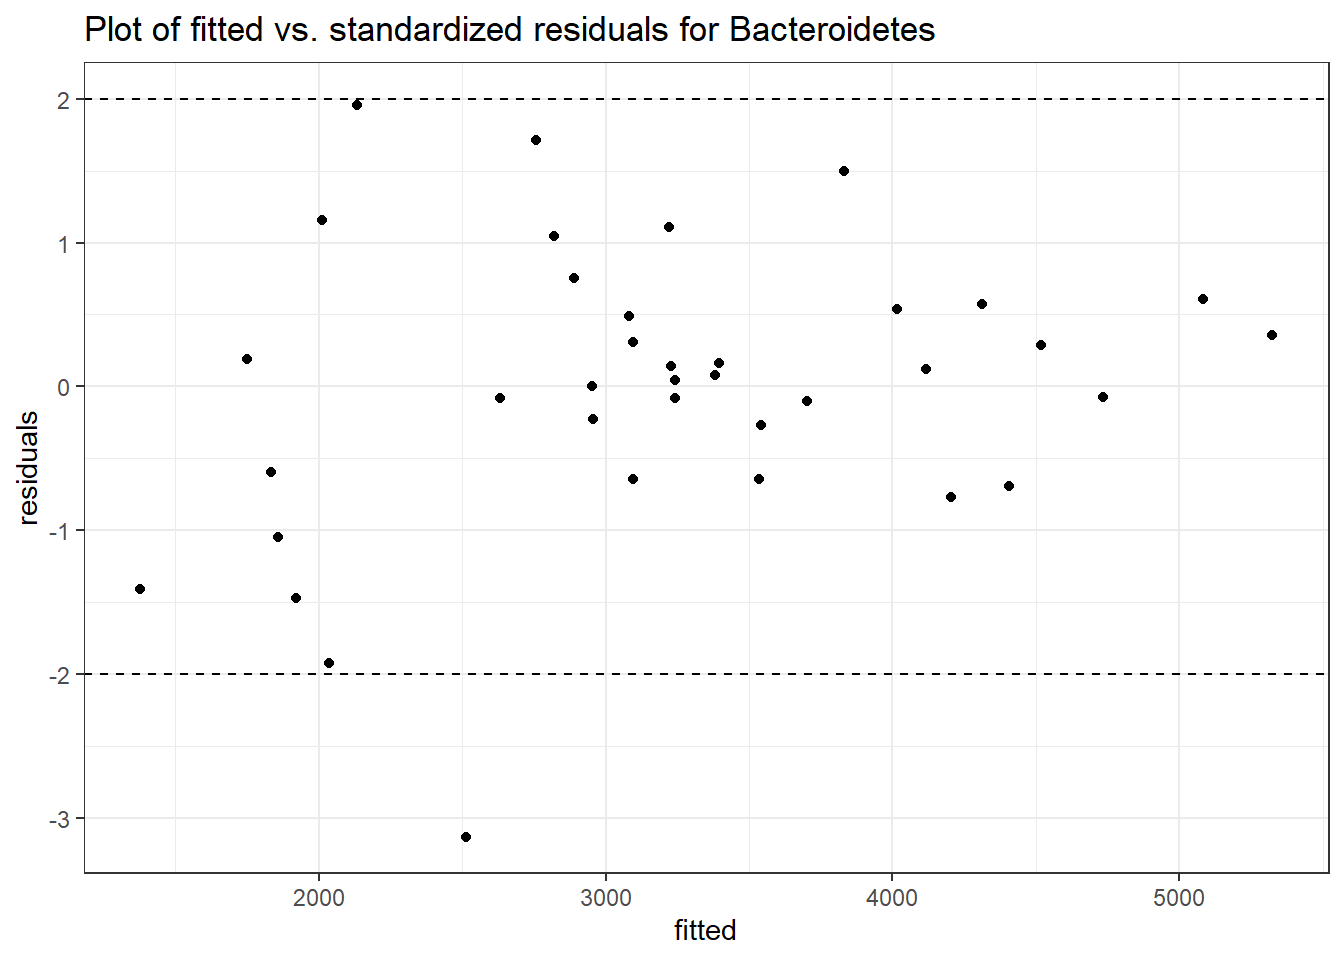
Fixed Effects (change in log)

                  Outcome Estimate Std. Error  z value Pr(>|z|)
(Intercept) Bacteroidetes  8.04573    0.13769 58.43425  0.00000
time        Bacteroidetes -0.04644    0.03485 -1.33276  0.18261


Random Effects (SD on log scale)

 Groups    Name        Std.Dev.
 SubjectID (Intercept) 0.40831

Significance test not available for random effects

#########################################
#########################################
Model:  Cyanobacteria ~ 1 + time + (1 | SubjectID)
<environment: 0x000000003e389128>

Link:    negbinom
boundary (singular) fit: see ?isSingular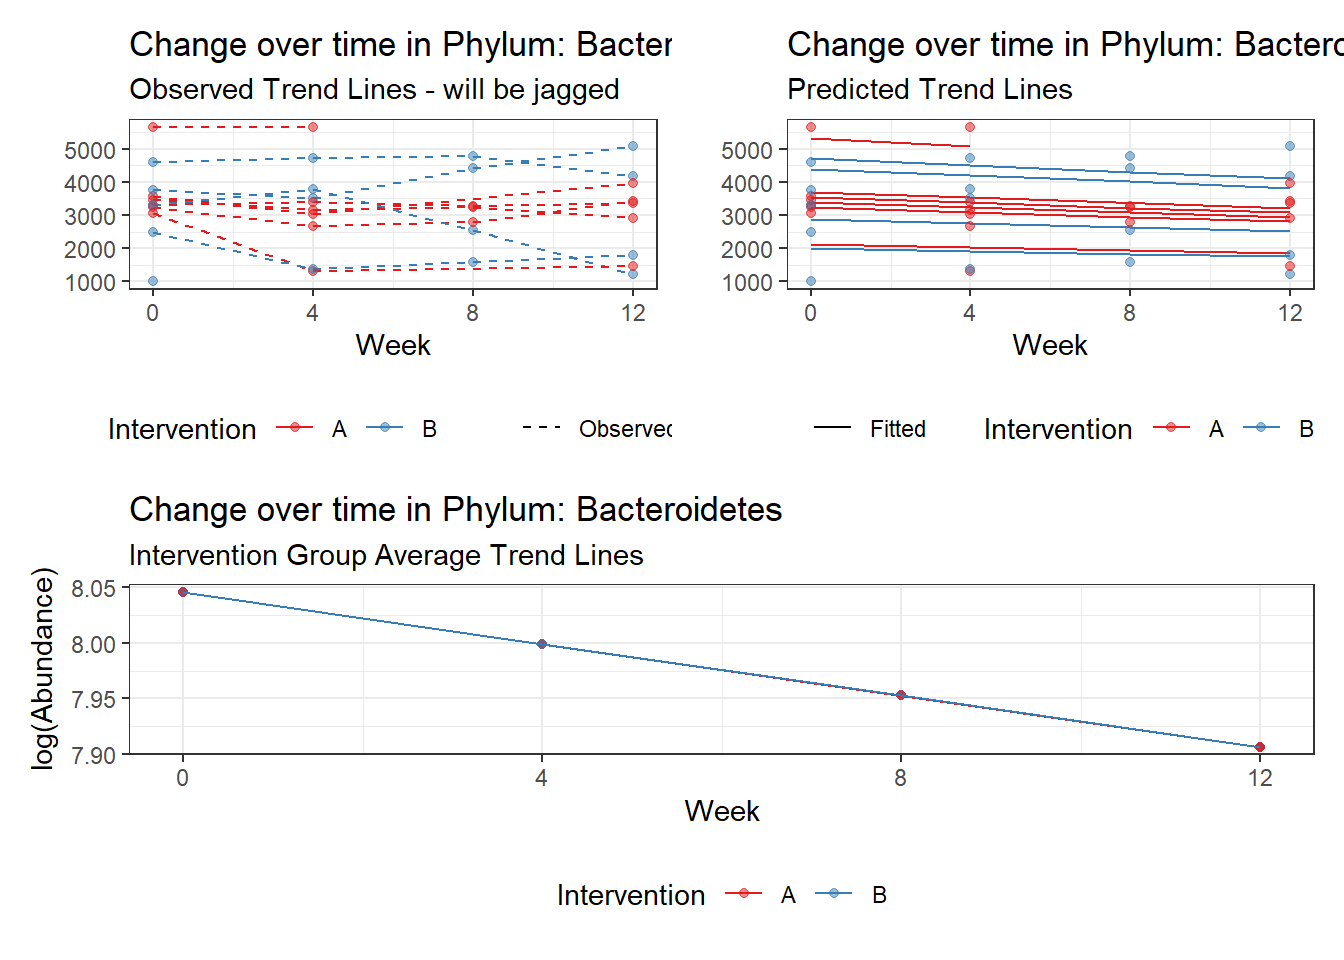
Intraclass Correlation (ICC): 0
Fixed Effects (change in log)

                  Outcome Estimate Std. Error  z value Pr(>|z|)
(Intercept) Cyanobacteria  3.54247    1.27688  2.77432  0.00553
time        Cyanobacteria -0.33819    0.79054 -0.42780  0.66880


Random Effects (SD on log scale)

 Groups    Name        Std.Dev.
 SubjectID (Intercept) 0

Significance test not available for random effects

#########################################
#########################################
Model:  Euryarchaeota ~ 1 + time + (1 | SubjectID)
<environment: 0x000000003e389128>

Link:    negbinom
boundary (singular) fit: see ?isSingular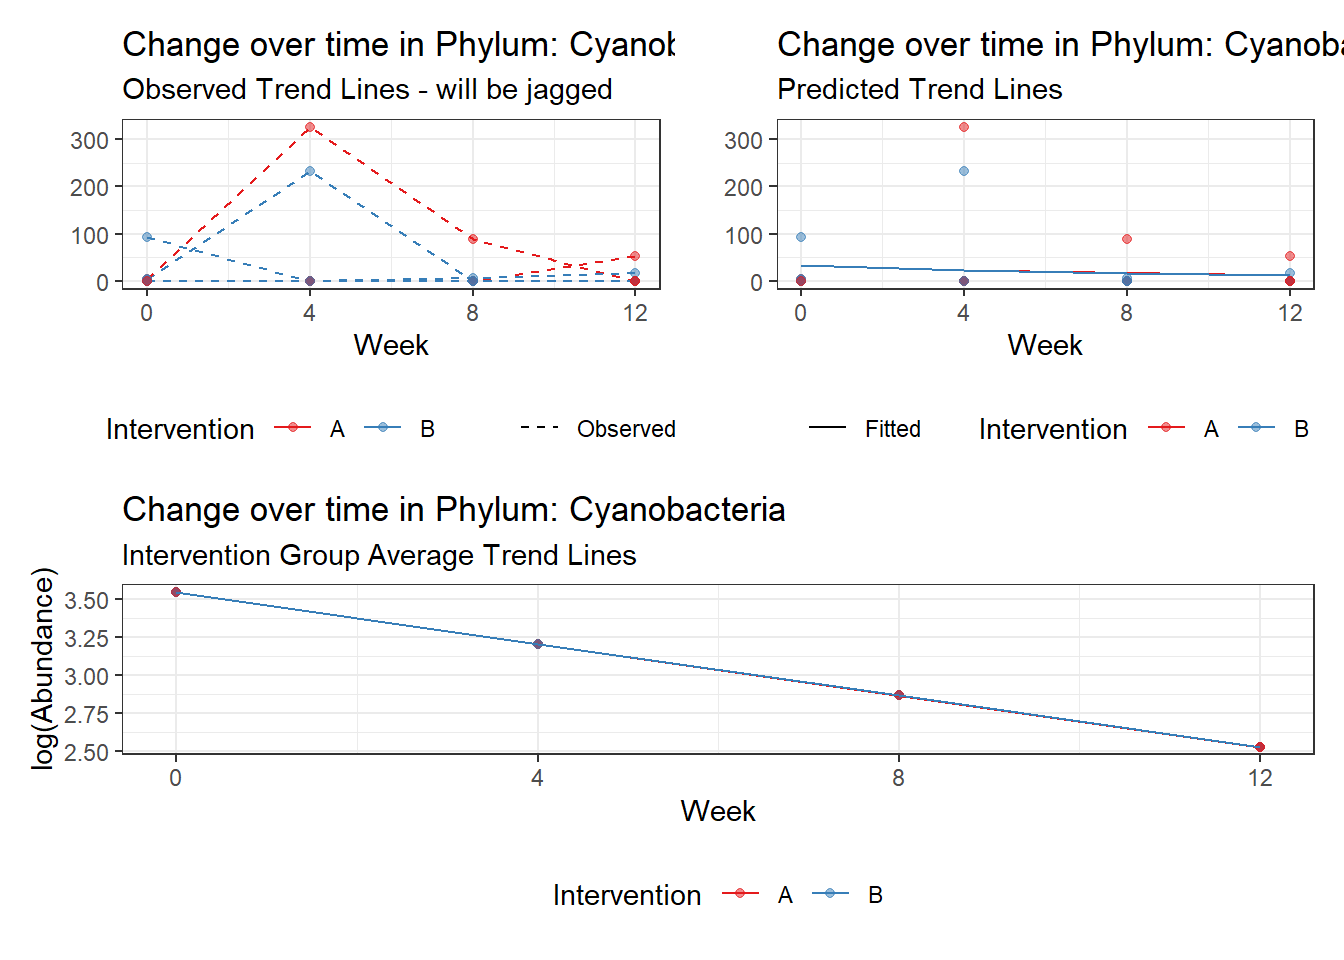
Intraclass Correlation (ICC): 3.497995e-10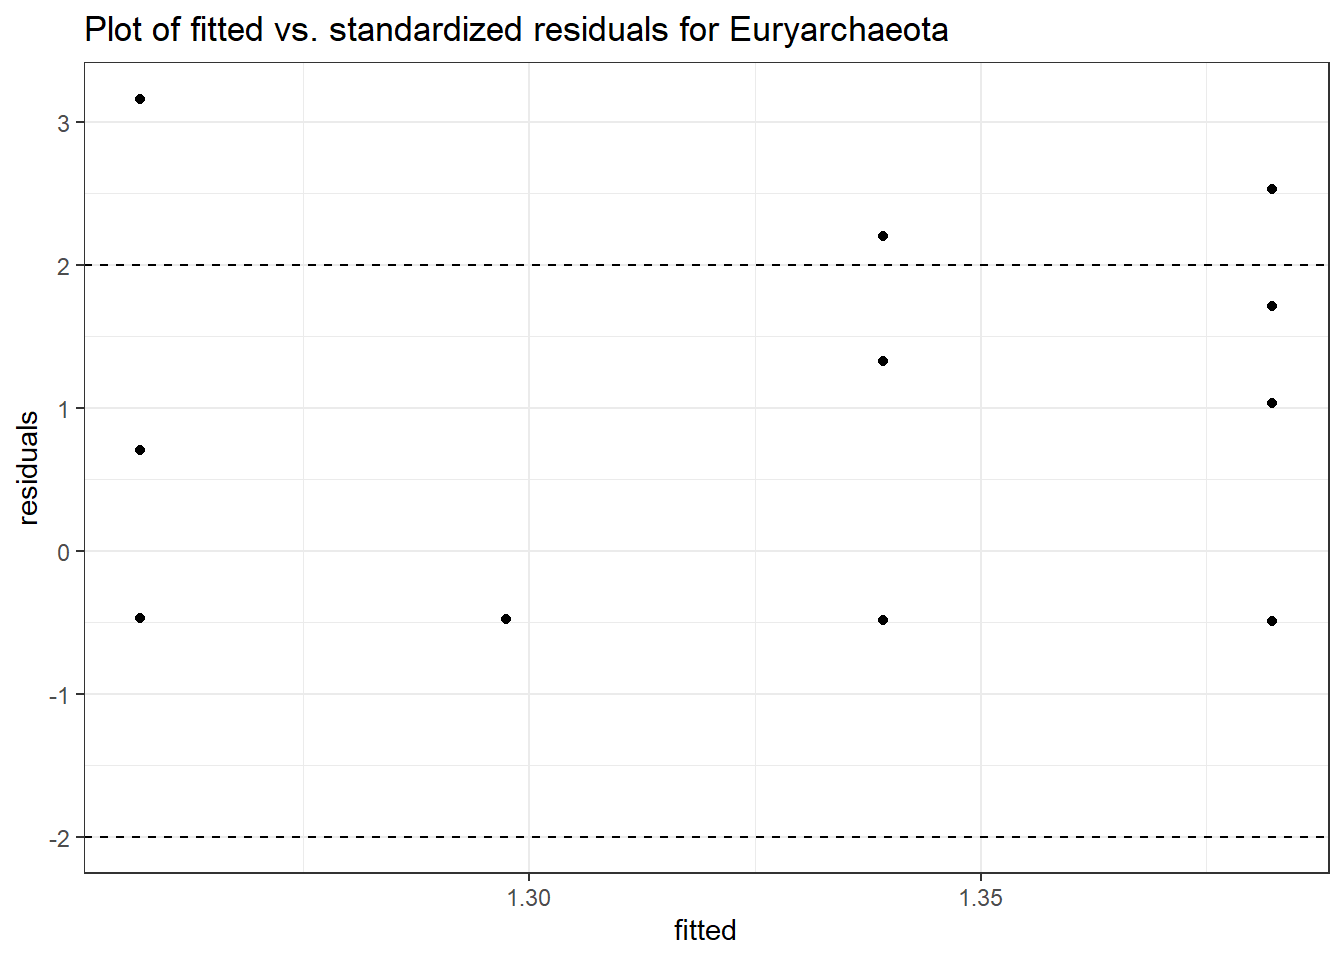
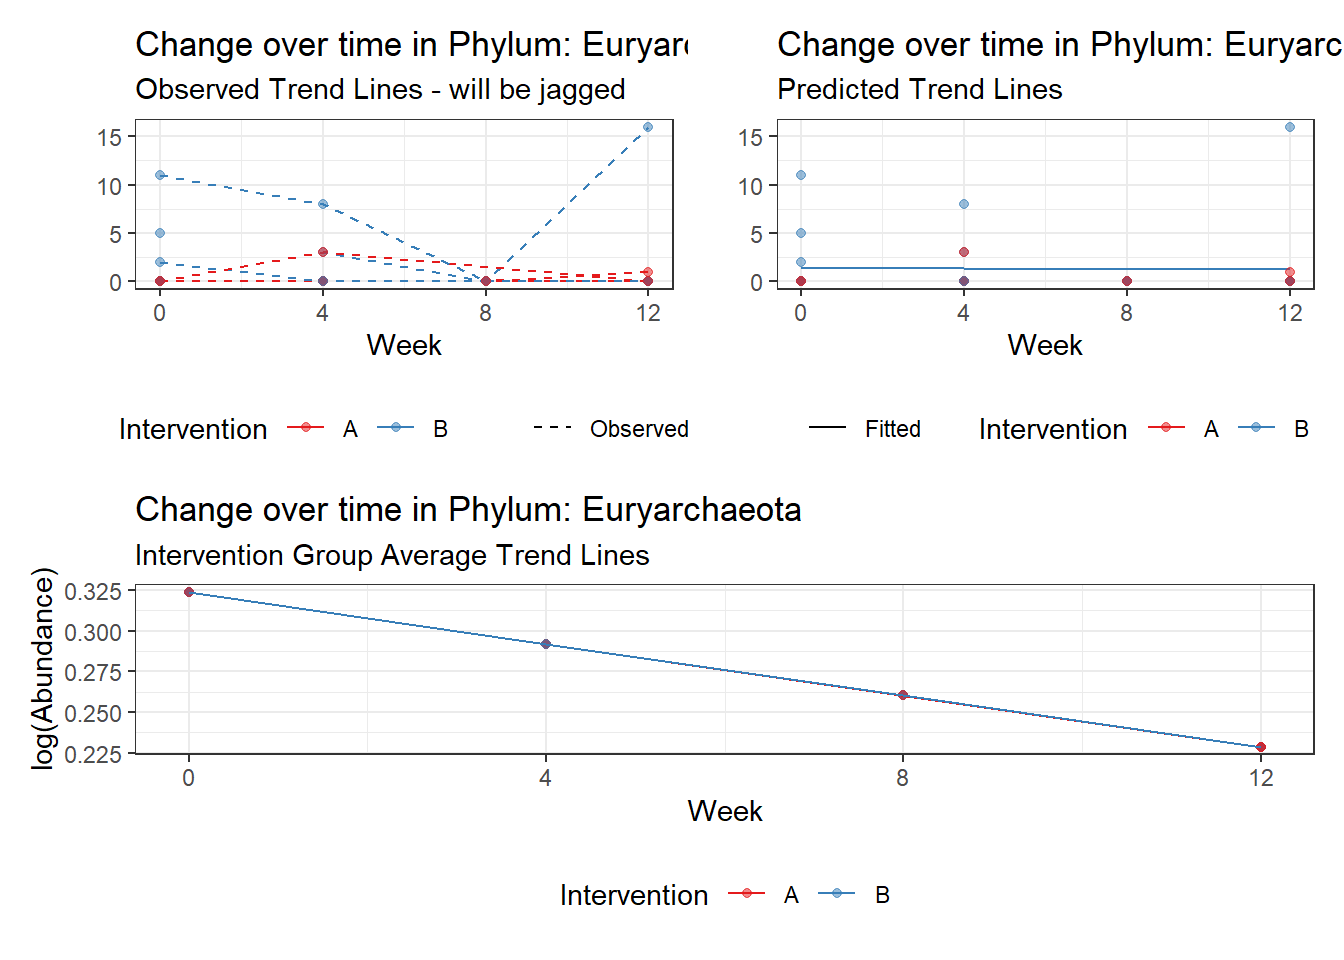
Fixed Effects (change in log)

                  Outcome Estimate Std. Error  z value Pr(>|z|)
(Intercept) Euryarchaeota  0.32375    0.82223  0.39374  0.69377
time        Euryarchaeota -0.03168    0.43726 -0.07245  0.94224


Random Effects (SD on log scale)

 Groups    Name        Std.Dev.
 SubjectID (Intercept) 1.8703e-05

Significance test not available for random effects

#########################################
#########################################
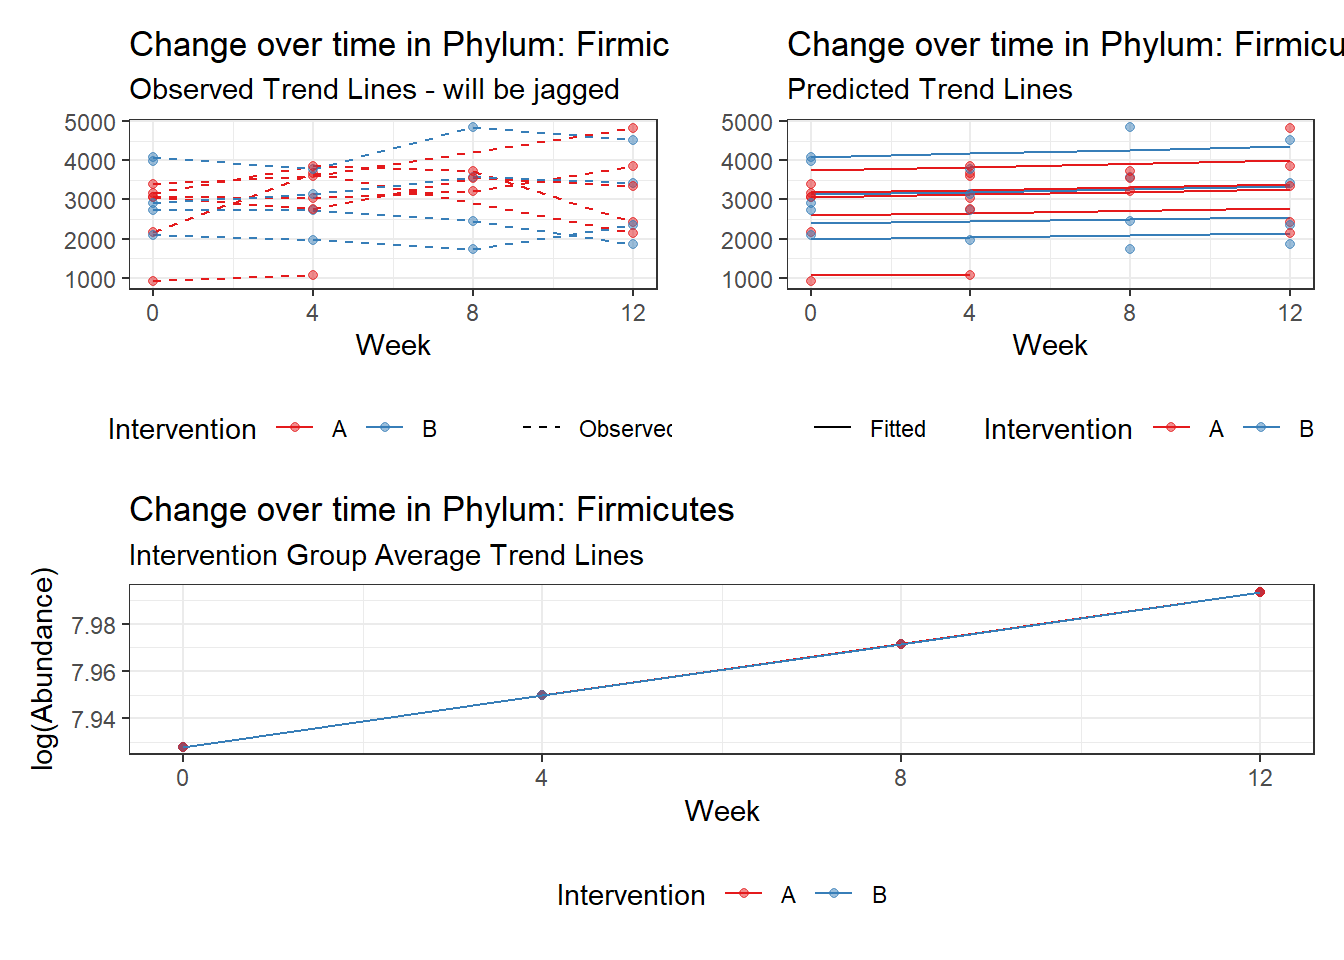
Model:  Firmicutes ~ 1 + time + (1 | SubjectID)
<environment: 0x000000003e389128>

Link:    negbinom


Intraclass Correlation (ICC):   0.1207101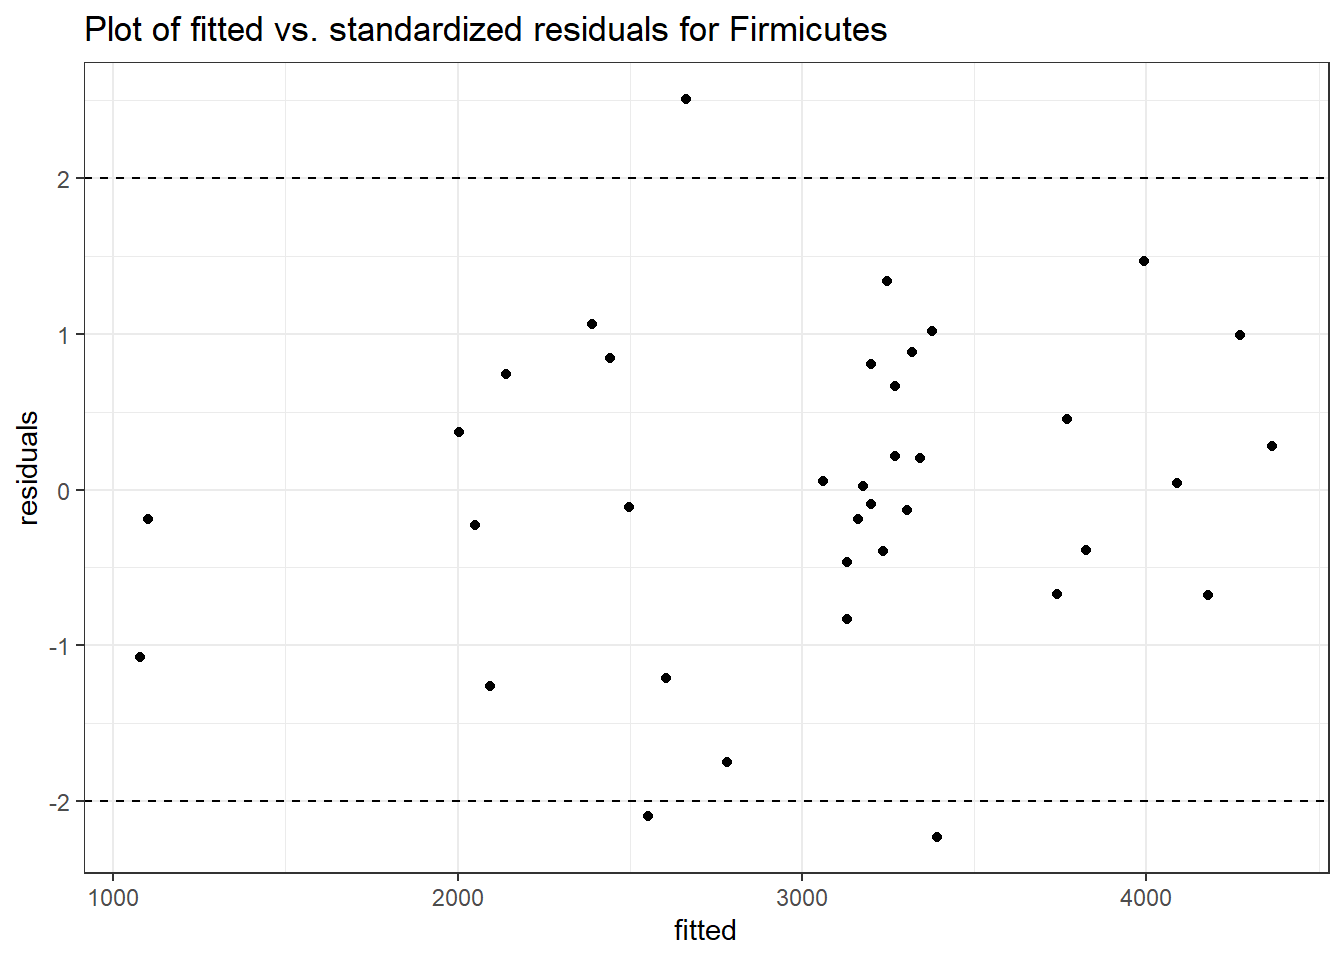
Fixed Effects (change in log)

               Outcome Estimate Std. Error  z value Pr(>|z|)
(Intercept) Firmicutes  7.92796    0.11921 66.50188  0.00000
time        Firmicutes  0.02184    0.02410  0.90630  0.36477


Random Effects (SD on log scale)

 Groups    Name        Std.Dev.
 SubjectID (Intercept) 0.37051

Significance test not available for random effects

#########################################
#########################################
Model:  Lentisphaerae ~ 1 + time + (1 | SubjectID)
<environment: 0x000000003e389128>

Link:    negbinom


Intraclass Correlation (ICC):   0.8168256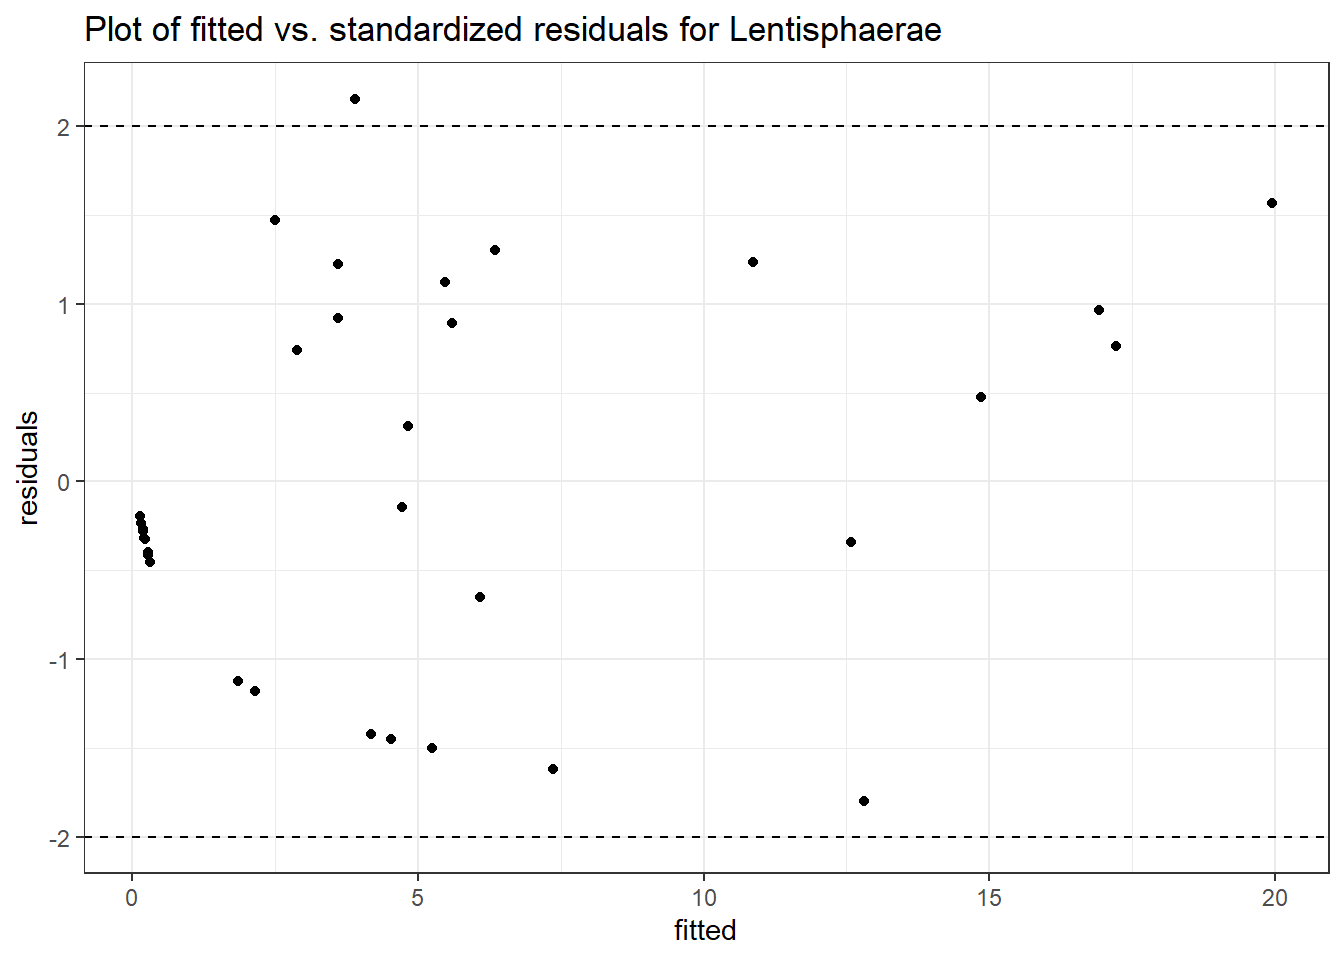

Fixed Effects (change in log)

                  Outcome Estimate Std. Error z value Pr(>|z|)
(Intercept) Lentisphaerae  0.20406    0.92058 0.22166  0.82458
time        Lentisphaerae  0.14781    0.28245 0.52331  0.60076


Random Effects (SD on log scale)

 Groups    Name        Std.Dev.
 SubjectID (Intercept) 2.1117

Significance test not available for random effects

#########################################
#########################################
Model:  Proteobacteria ~ 1 + time + (1 | SubjectID)
<environment: 0x000000003e389128>

Link:    negbinom


Intraclass Correlation (ICC):   0.03630509
Fixed Effects (change in log)

                   Outcome Estimate Std. Error  z value Pr(>|z|)
(Intercept) Proteobacteria  5.81329    0.16269 35.73128  0.00000
time        Proteobacteria -0.06285    0.08835 -0.71142  0.47683


Random Effects (SD on log scale)

 Groups    Name        Std.Dev.
 SubjectID (Intercept) 0.19409

Significance test not available for random effects

#########################################
#########################################
Model:  Tenericutes ~ 1 + time + (1 | SubjectID)
<environment: 0x000000003e389128>

Link:    negbinom
boundary (singular) fit: see ?isSingular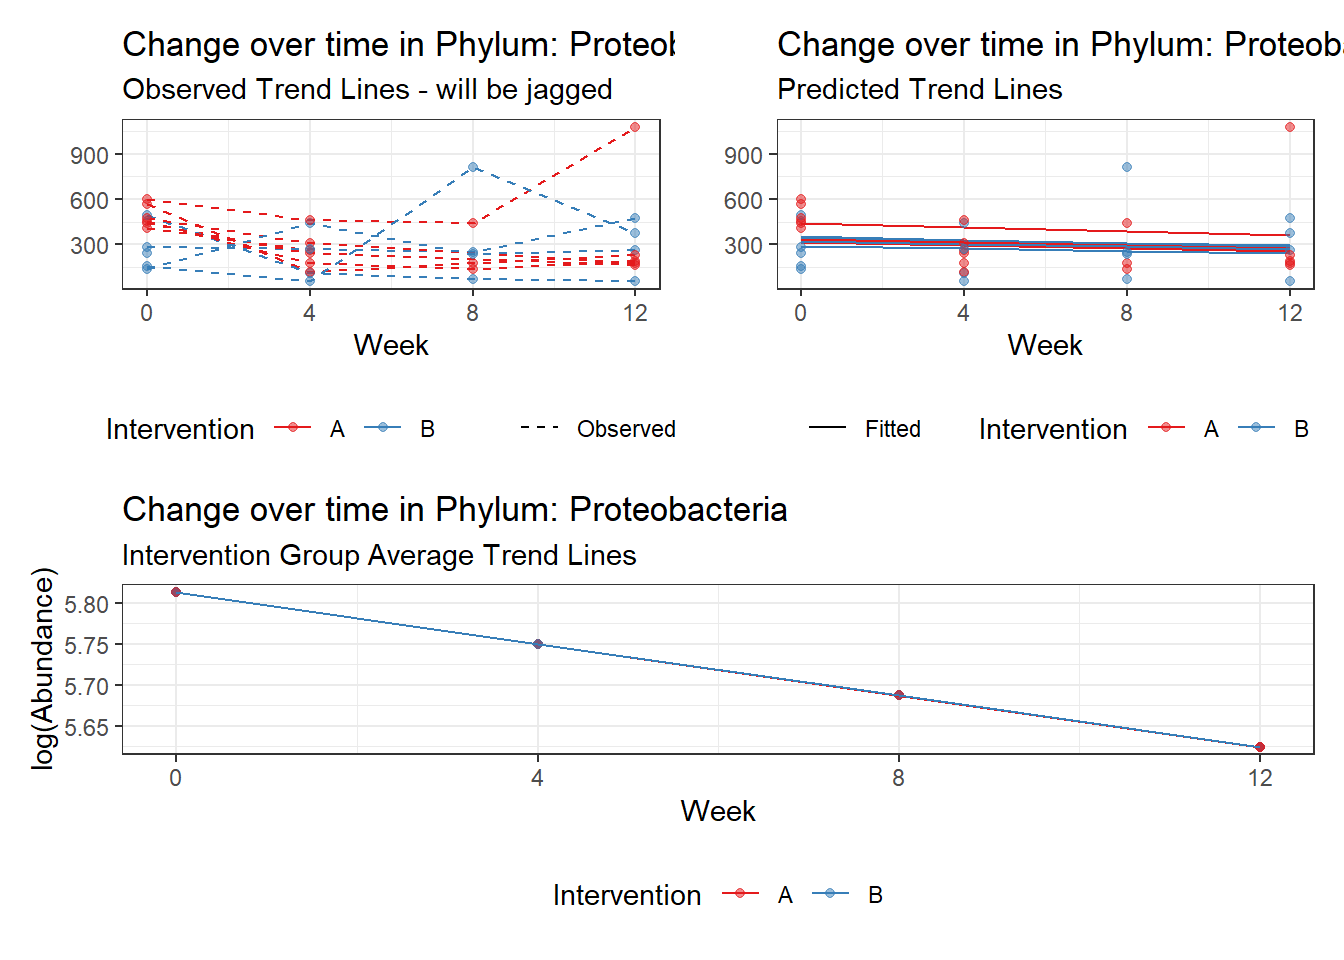
Intraclass Correlation (ICC): 0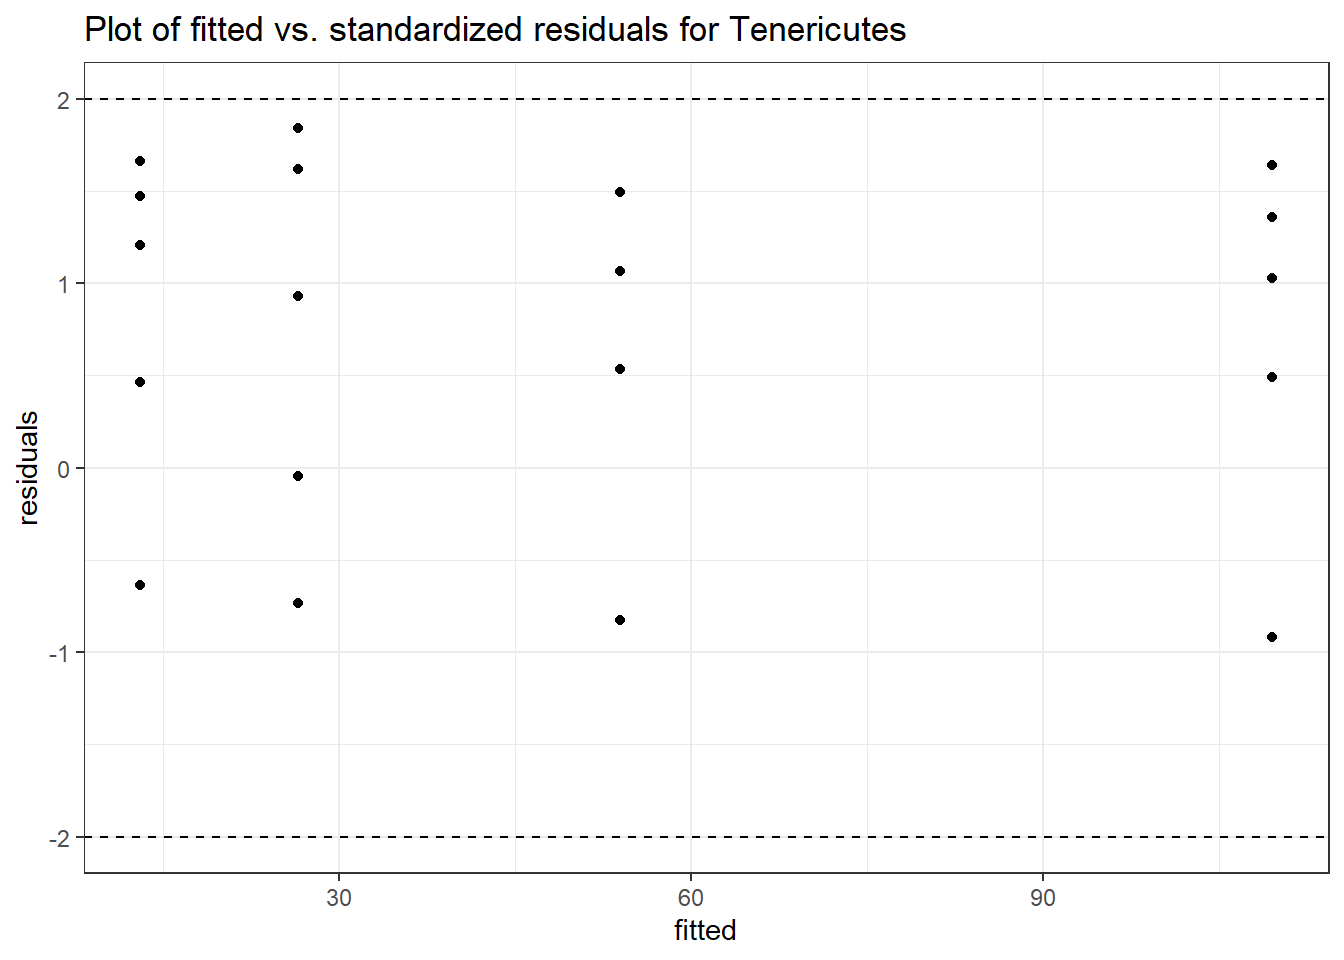
Fixed Effects (change in log)

                Outcome Estimate Std. Error z value Pr(>|z|)
(Intercept) Tenericutes  2.57197    0.81255 3.16532  0.00155
time        Tenericutes  0.70821    0.45254 1.56497  0.11759


Random Effects (SD on log scale)

 Groups    Name        Std.Dev.
 SubjectID (Intercept) 0

Significance test not available for random effects

#########################################
#########################################
Model:  Verrucomicrobia ~ 1 + time + (1 | SubjectID)
<environment: 0x000000003e389128>

Link:    negbinom
Warning in theta.ml(Y, mu, weights = object@resp$weights, limit = limit, :
iteration limit reachedWarning in sqrt(1/i): NaNs produced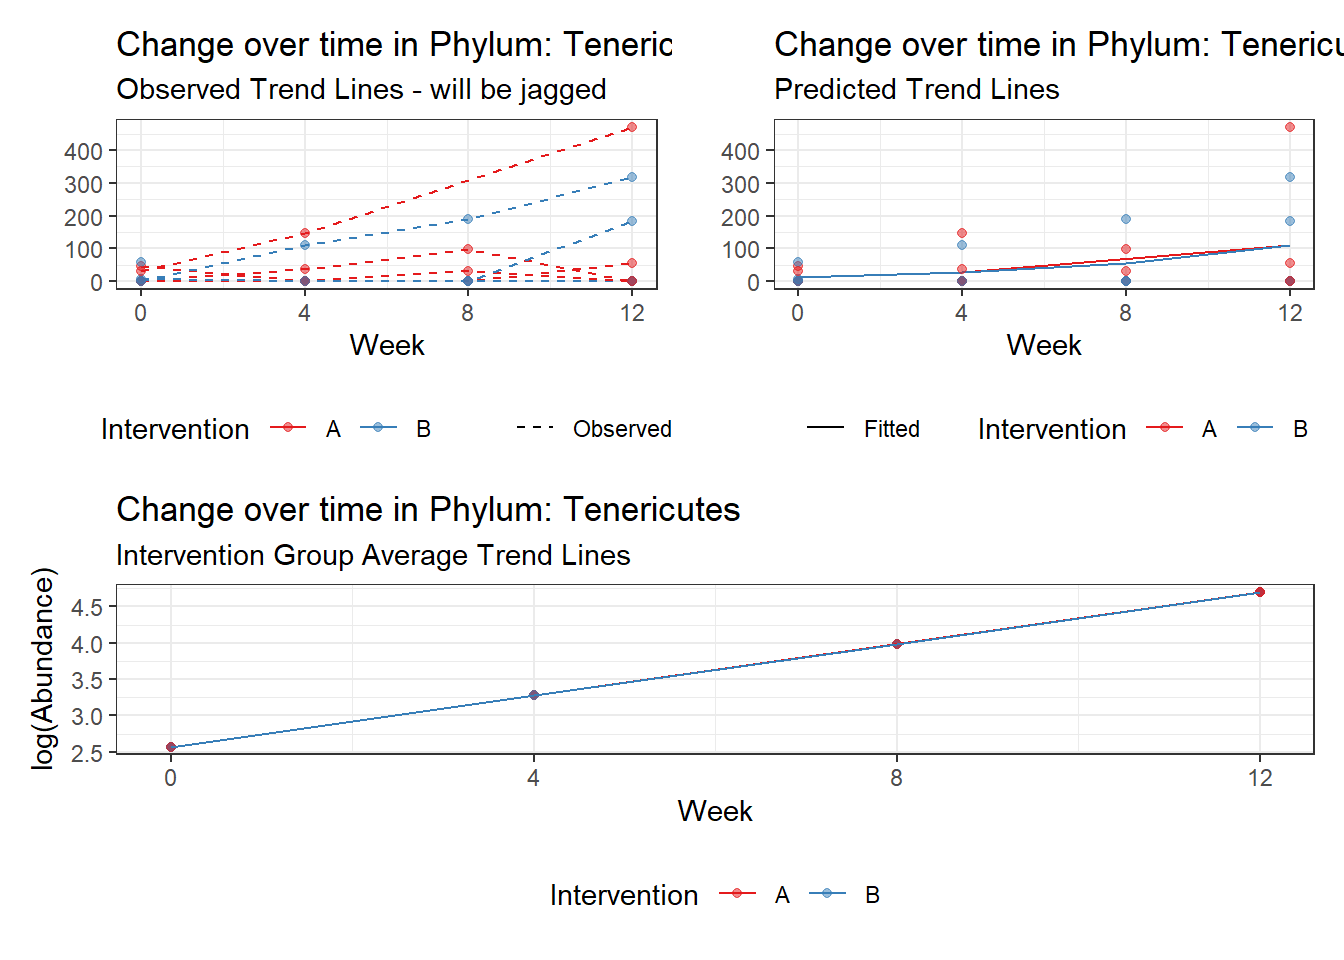
Intraclass Correlation (ICC): 0.8611511

Fixed Effects (change in log)

                    Outcome Estimate Std. Error z value Pr(>|z|)
(Intercept) Verrucomicrobia  4.50005    0.75659 5.94780  0.00000
time        Verrucomicrobia  0.00196    0.00938 0.20909  0.83438


Random Effects (SD on log scale)

 Groups    Name        Std.Dev.
 SubjectID (Intercept) 2.4904

Significance test not available for random effects
So, we found that time does significantly influence at least some of the bacteria over time. This is contrary to the results when we used the normal theory model.
Covariates: Time + Gender
\[\begin{align*} h\left(Y_{ij}\right)&=\beta_{0j} + \beta_{1j}*(Week)_{ij} + r_{ij}\\ \beta_{0j}&= \gamma_{00} + \gamma_{01}(Gender)_{j} + u_{0j}\\ \beta_{1j}&= \gamma_{10}\\ \end{align*}\]
Gender is coded as female (effect of being female compared to males).
phylum.fit2 <- glmm_microbiome(mydata=microbiome_data,model.number=2,
                               taxa.level="Phylum", link="poisson",
                               model="1 + time + female + (1|SubjectID)")
#########################################
#########################################
Model:  Actinobacteria ~ 1 + time + female + (1 | SubjectID)
<environment: 0x000000003a582e10>

Link:    poisson


Intraclass Correlation (ICC):   0.4982485

Fixed Effects (change in log)

                   Outcome Estimate Std. Error z value Pr(>|z|)
(Intercept) Actinobacteria  2.47700    0.50815 4.87455  0.00000
time        Actinobacteria  0.17905    0.03052 5.86631  0.00000
female      Actinobacteria  0.04105    0.63420 0.06472  0.94839


Random Effects (SD on log scale)

 Groups    Name        Std.Dev.
 SubjectID (Intercept) 0.9965

Significance test not available for random effects

#########################################
#########################################
Model:  Bacteroidetes ~ 1 + time + female + (1 | SubjectID)
<environment: 0x000000003a582e10>

Link:    poisson


Intraclass Correlation (ICC):   0.1057896

Fixed Effects (change in log)

                  Outcome Estimate Std. Error   z value Pr(>|z|)
(Intercept) Bacteroidetes  8.43283    0.17206  49.01120  0.00000
time        Bacteroidetes -0.03228    0.00265 -12.16667  0.00000
female      Bacteroidetes -0.66491    0.21571  -3.08251  0.00205


Random Effects (SD on log scale)

 Groups    Name        Std.Dev.
 SubjectID (Intercept) 0.34395

Significance test not available for random effects

#########################################
#########################################
Model:  Cyanobacteria ~ 1 + time + female + (1 | SubjectID)
<environment: 0x000000003a582e10>

Link:    poisson


Intraclass Correlation (ICC):   0.9488445

Fixed Effects (change in log)

                  Outcome Estimate Std. Error  z value Pr(>|z|)
(Intercept) Cyanobacteria -3.69881    3.11001 -1.18932  0.23431
time        Cyanobacteria -0.27256    0.03201 -8.51544  0.00000
female      Cyanobacteria  3.96040    3.29269  1.20278  0.22906


Random Effects (SD on log scale)

 Groups    Name        Std.Dev.
 SubjectID (Intercept) 4.3068

Significance test not available for random effects

#########################################
#########################################
Model:  Euryarchaeota ~ 1 + time + female + (1 | SubjectID)
<environment: 0x000000003a582e10>

Link:    poisson


Intraclass Correlation (ICC):   0.7603834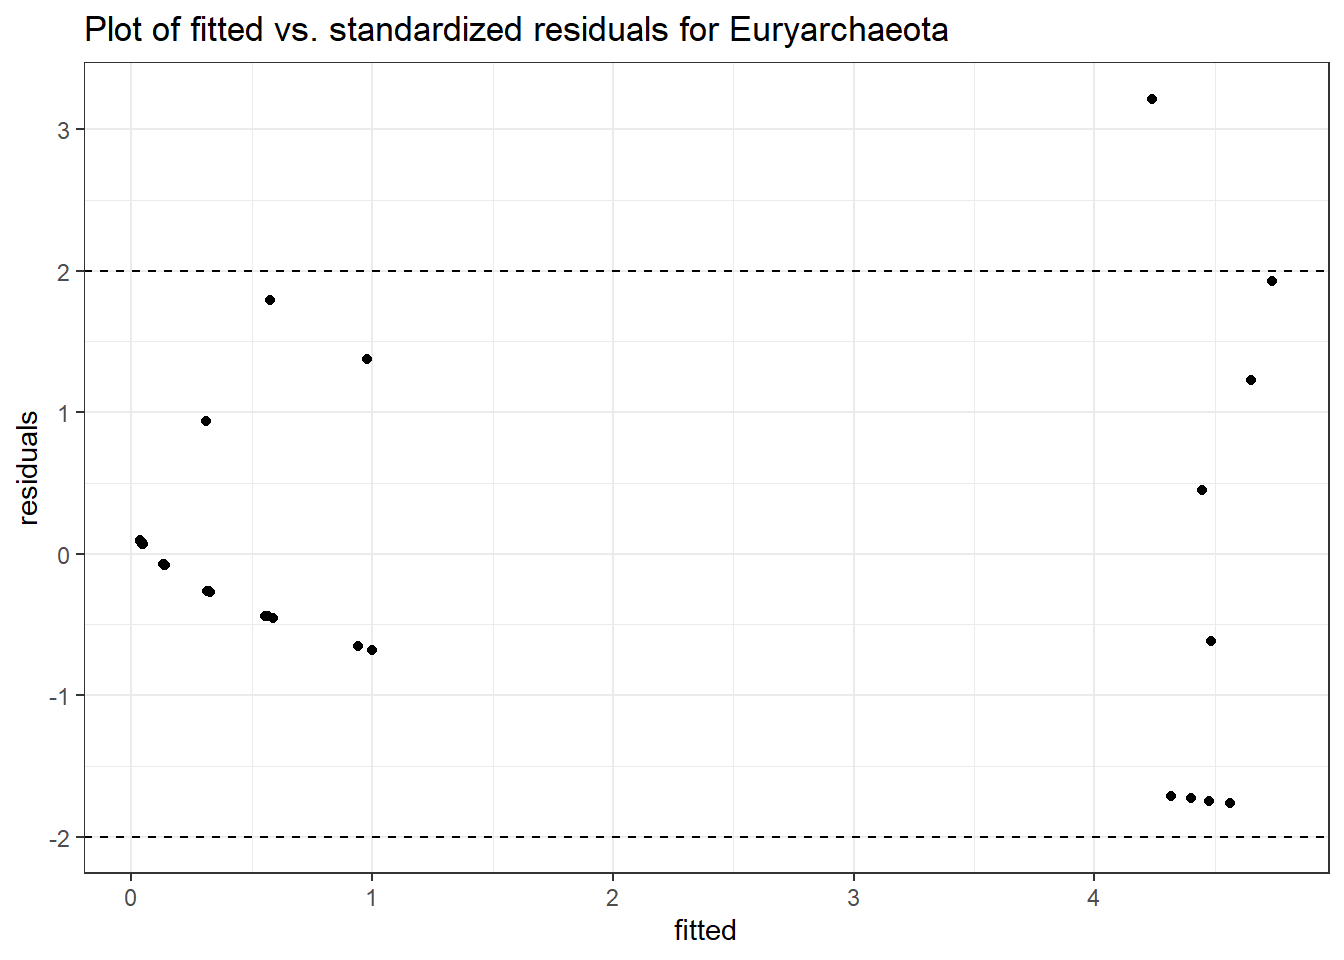
Fixed Effects (change in log)

                  Outcome Estimate Std. Error  z value Pr(>|z|)
(Intercept) Euryarchaeota -2.78911    1.45323 -1.91925  0.05495
time        Euryarchaeota -0.01899    0.13261 -0.14320  0.88613
female      Euryarchaeota  2.53223    1.52281  1.66287  0.09634


Random Effects (SD on log scale)

 Groups    Name        Std.Dev.
 SubjectID (Intercept) 1.7814

Significance test not available for random effects

#########################################
#########################################
Model:  Firmicutes ~ 1 + time + female + (1 | SubjectID)
<environment: 0x000000003a582e10>

Link:    poisson


Intraclass Correlation (ICC):   0.05733286
Fixed Effects (change in log)

               Outcome Estimate Std. Error  z value Pr(>|z|)
(Intercept) Firmicutes  7.52153    0.12357 60.86953    0e+00
time        Firmicutes  0.02659    0.00267  9.97672    0e+00
female      Firmicutes  0.62883    0.15479  4.06239    5e-05


Random Effects (SD on log scale)

 Groups    Name        Std.Dev.
 SubjectID (Intercept) 0.24662

Significance test not available for random effects

#########################################
#########################################
Model:  Lentisphaerae ~ 1 + time + female + (1 | SubjectID)
<environment: 0x000000003a582e10>

Link:    poisson
Warning in checkConv(attr(opt, "derivs"), opt$par, ctrl = control$checkConv, :
unable to evaluate scaled gradientWarning in checkConv(attr(opt, "derivs"), opt$par, ctrl = control$checkConv, :
Model failed to converge: degenerate Hessian with 1 negative eigenvalues
Intraclass Correlation (ICC): 0.3388261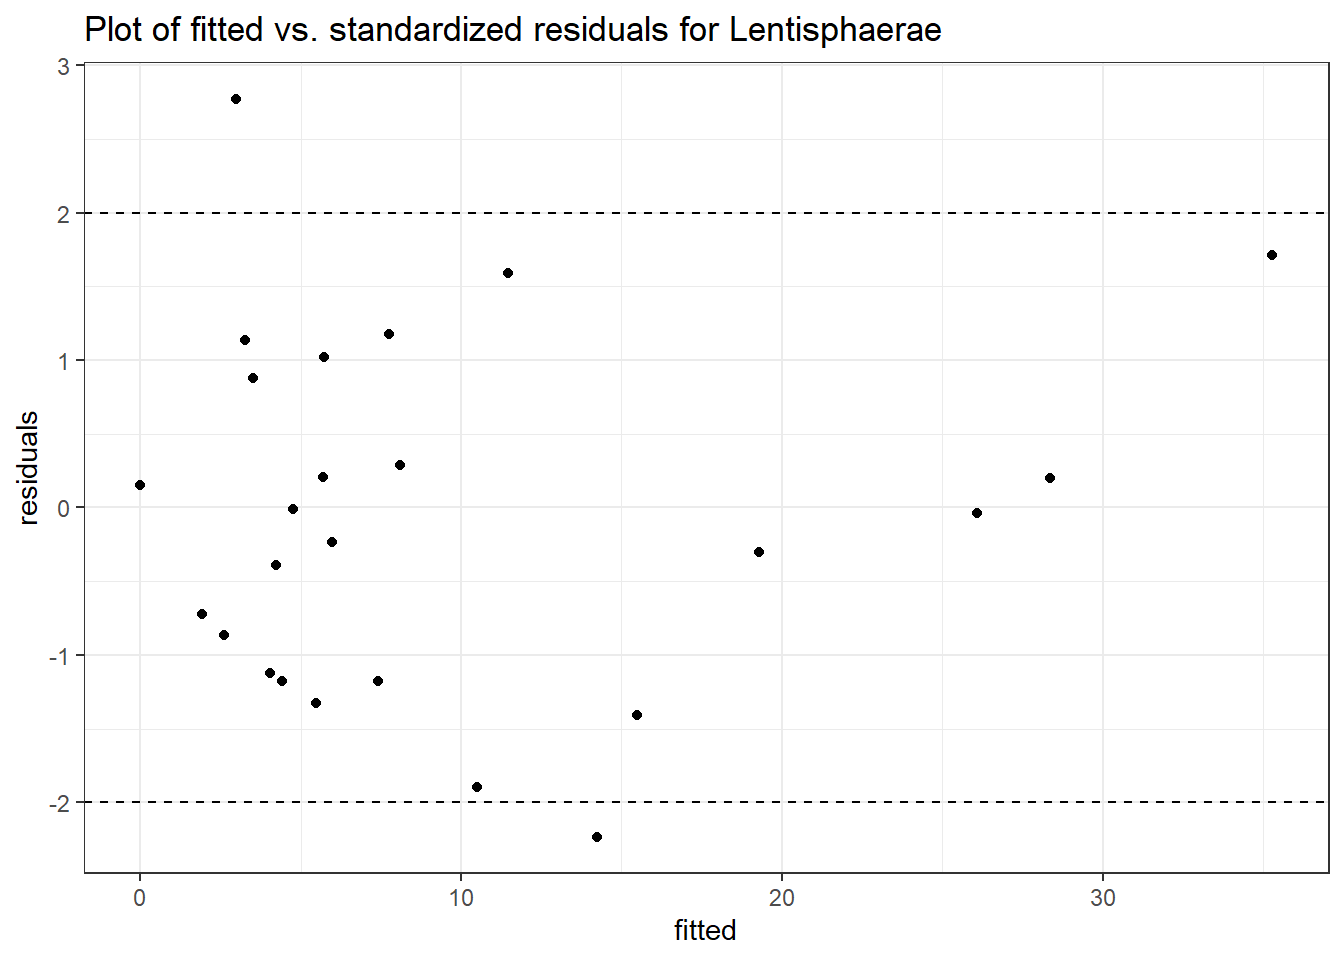
Warning in vcov.merMod(object, use.hessian = use.hessian): variance-covariance matrix computed from finite-difference Hessian is
not positive definite or contains NA values: falling back to var-cov estimated from RX
Warning in vcov.merMod(object, correlation = correlation, sigm = sig): variance-covariance matrix computed from finite-difference Hessian is
not positive definite or contains NA values: falling back to var-cov estimated from RX
Fixed Effects (change in log)

                  Outcome  Estimate Std. Error  z value Pr(>|z|)
(Intercept) Lentisphaerae -18.83511 2716.82272 -0.00693  0.99447
time        Lentisphaerae   0.30236    0.05792  5.22067  0.00000
female      Lentisphaerae  20.41620 2716.82274  0.00751  0.99400


Random Effects (SD on log scale)

 Groups    Name        Std.Dev.
 SubjectID (Intercept) 0.71586

Significance test not available for random effects

#########################################
#########################################
Model:  Proteobacteria ~ 1 + time + female + (1 | SubjectID)
<environment: 0x000000003a582e10>

Link:    poisson


Intraclass Correlation (ICC):   0.08001611
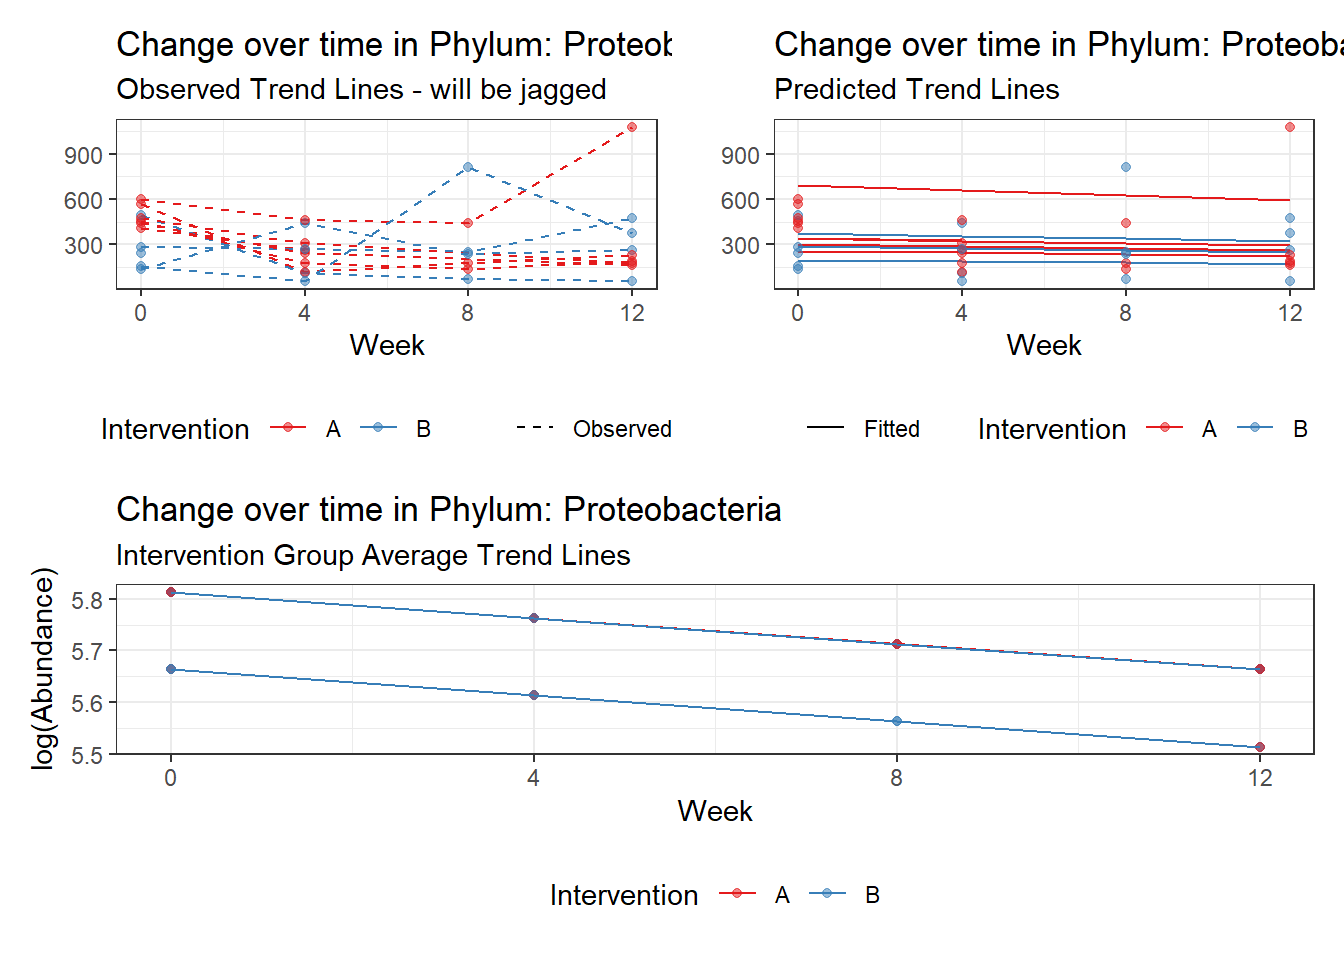
Fixed Effects (change in log)

                   Outcome Estimate Std. Error  z value Pr(>|z|)
(Intercept) Proteobacteria  5.66360    0.14879 38.06363  0.00000
time        Proteobacteria -0.04970    0.00838 -5.93280  0.00000
female      Proteobacteria  0.14908    0.18616  0.80083  0.42323


Random Effects (SD on log scale)

 Groups    Name        Std.Dev.
 SubjectID (Intercept) 0.29492

Significance test not available for random effects

#########################################
#########################################
Model:  Tenericutes ~ 1 + time + female + (1 | SubjectID)
<environment: 0x000000003a582e10>

Link:    poisson


Intraclass Correlation (ICC):   0.5764745
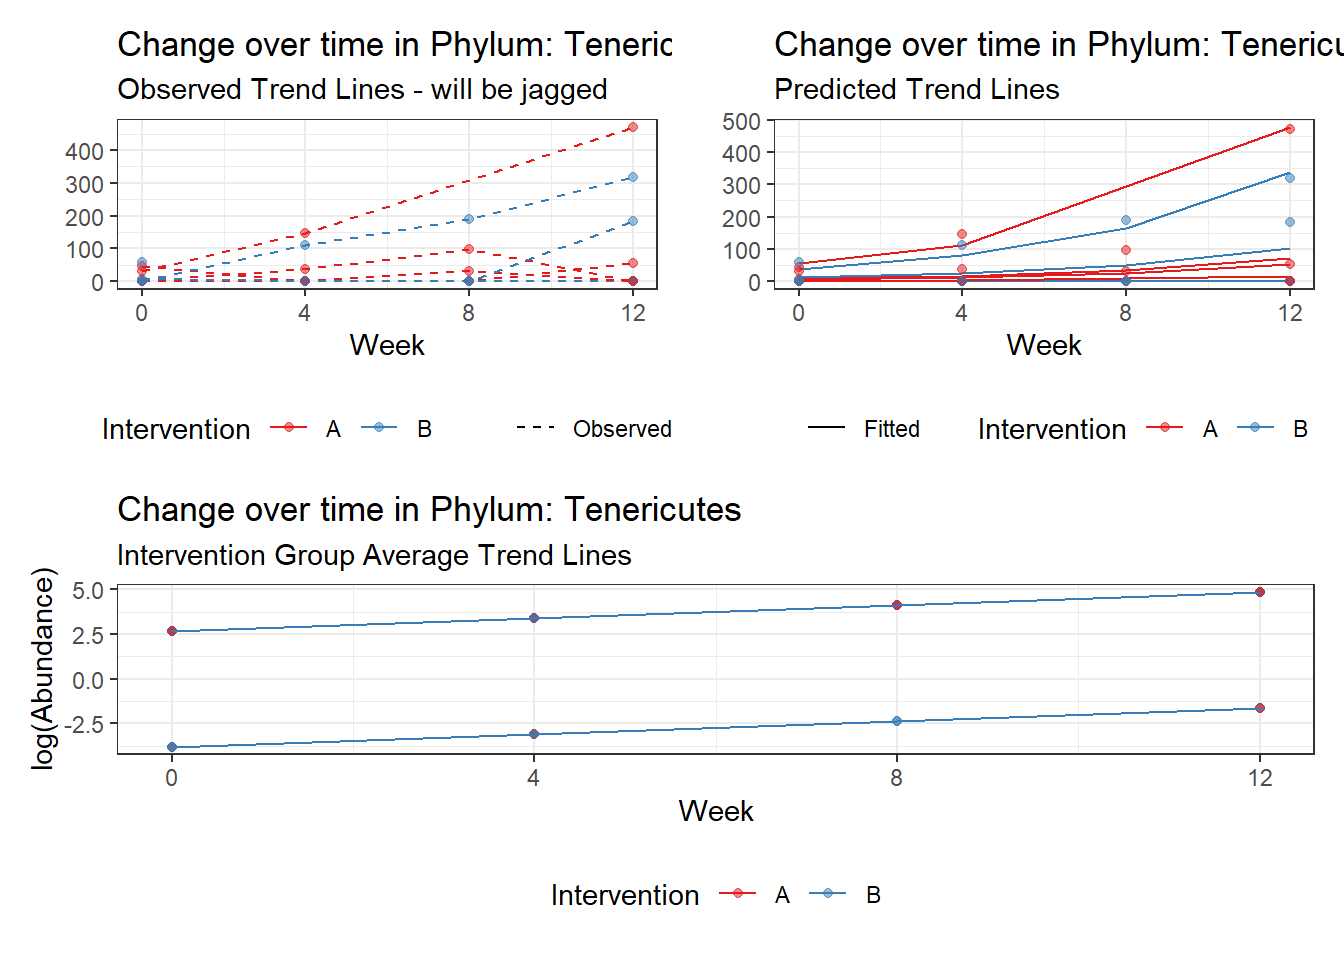
Fixed Effects (change in log)

                Outcome Estimate Std. Error  z value Pr(>|z|)
(Intercept) Tenericutes -3.79522    1.06416 -3.56640  0.00036
time        Tenericutes  0.72079    0.02488 28.97019  0.00000
female      Tenericutes  6.47823    1.15036  5.63146  0.00000


Random Effects (SD on log scale)

 Groups    Name        Std.Dev.
 SubjectID (Intercept) 1.1667

Significance test not available for random effects

#########################################
#########################################
Model:  Verrucomicrobia ~ 1 + time + female + (1 | SubjectID)
<environment: 0x000000003a582e10>

Link:    poisson


Intraclass Correlation (ICC):   0.827486
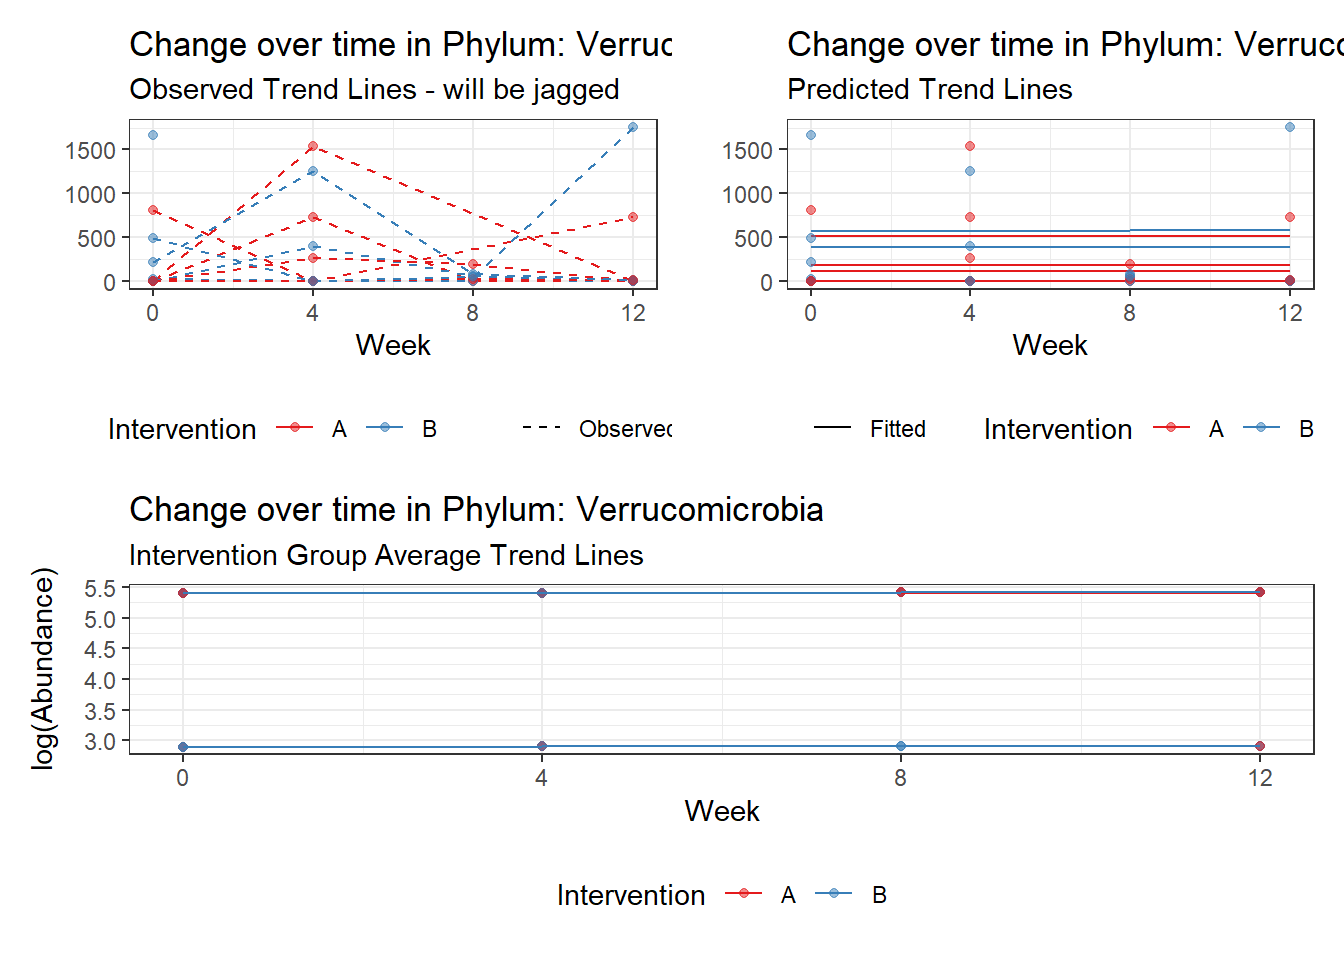
Fixed Effects (change in log)

                    Outcome Estimate Std. Error z value Pr(>|z|)
(Intercept) Verrucomicrobia  2.90035    1.12841 2.57031  0.01016
time        Verrucomicrobia  0.00500    0.00920 0.54291  0.58719
female      Verrucomicrobia  2.50316    1.39938 1.78876  0.07365


Random Effects (SD on log scale)

 Groups    Name        Std.Dev.
 SubjectID (Intercept) 2.1901

Significance test not available for random effects
phylum.fit2b <- glmm_microbiome(mydata=microbiome_data,model.number=2,
taxa.level="Phylum", link="negbinom",
model="1 + time + female + (1|SubjectID)")
#########################################
#########################################
Model:  Actinobacteria ~ 1 + time + female + (1 | SubjectID)
<environment: 0x0000000046721990>

Link:    negbinom


Intraclass Correlation (ICC):   0.3728722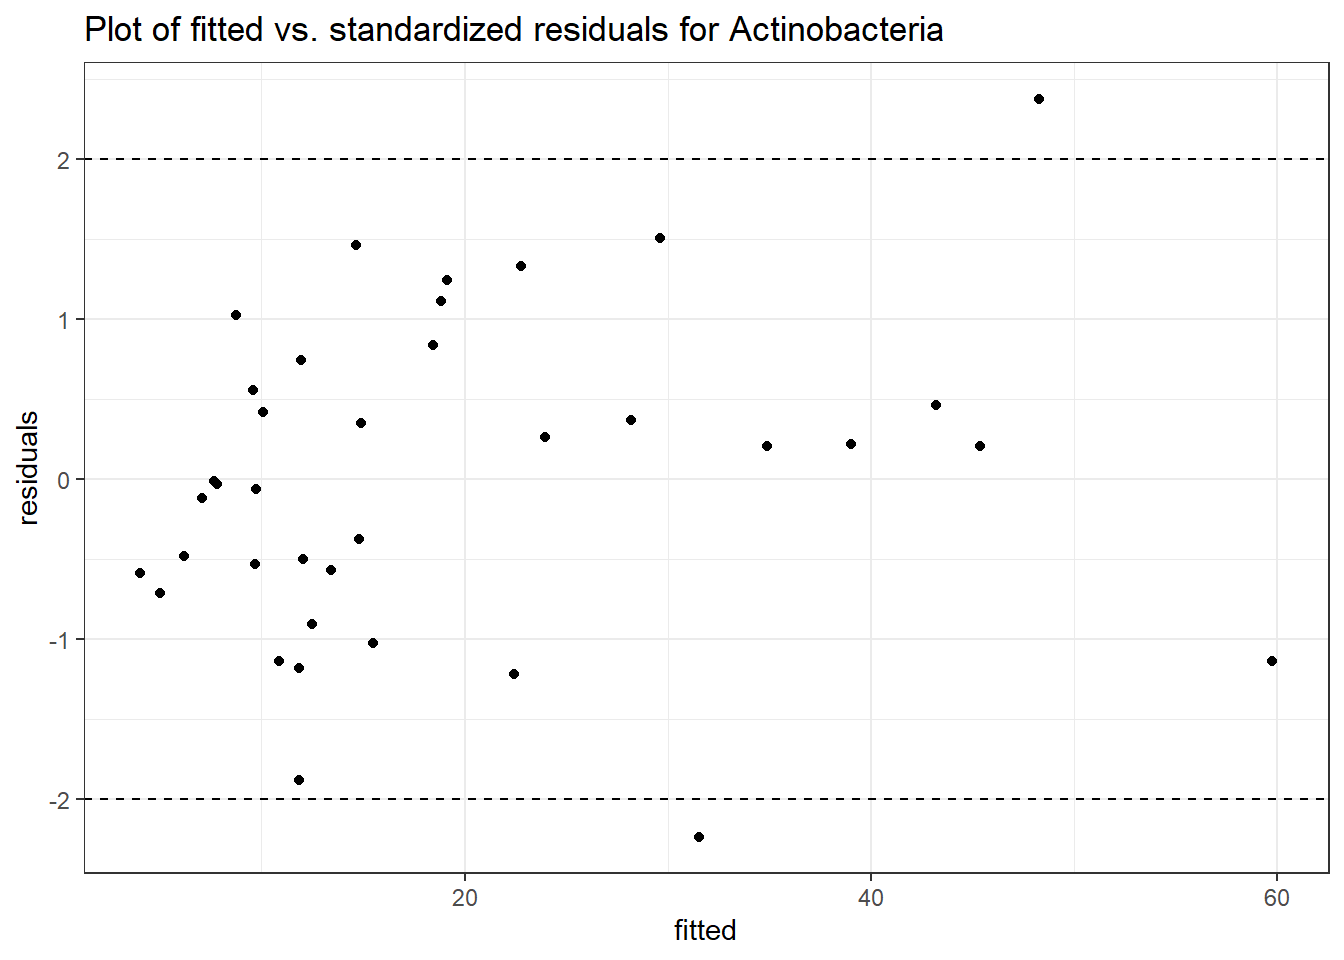
Fixed Effects (change in log)

                   Outcome Estimate Std. Error  z value Pr(>|z|)
(Intercept) Actinobacteria  2.55542    0.57905  4.41310  0.00001
time        Actinobacteria  0.21316    0.18843  1.13125  0.25795
female      Actinobacteria -0.10645    0.64228 -0.16574  0.86836


Random Effects (SD on log scale)

 Groups    Name        Std.Dev.
 SubjectID (Intercept) 0.77108

Significance test not available for random effects

#########################################
#########################################
Model:  Bacteroidetes ~ 1 + time + female + (1 | SubjectID)
<environment: 0x0000000046721990>

Link:    negbinom
Error in factory(refitNB, types = c("message", "warning"))(lastfit, theta = exp(t), : Downdated VtV is not positive definite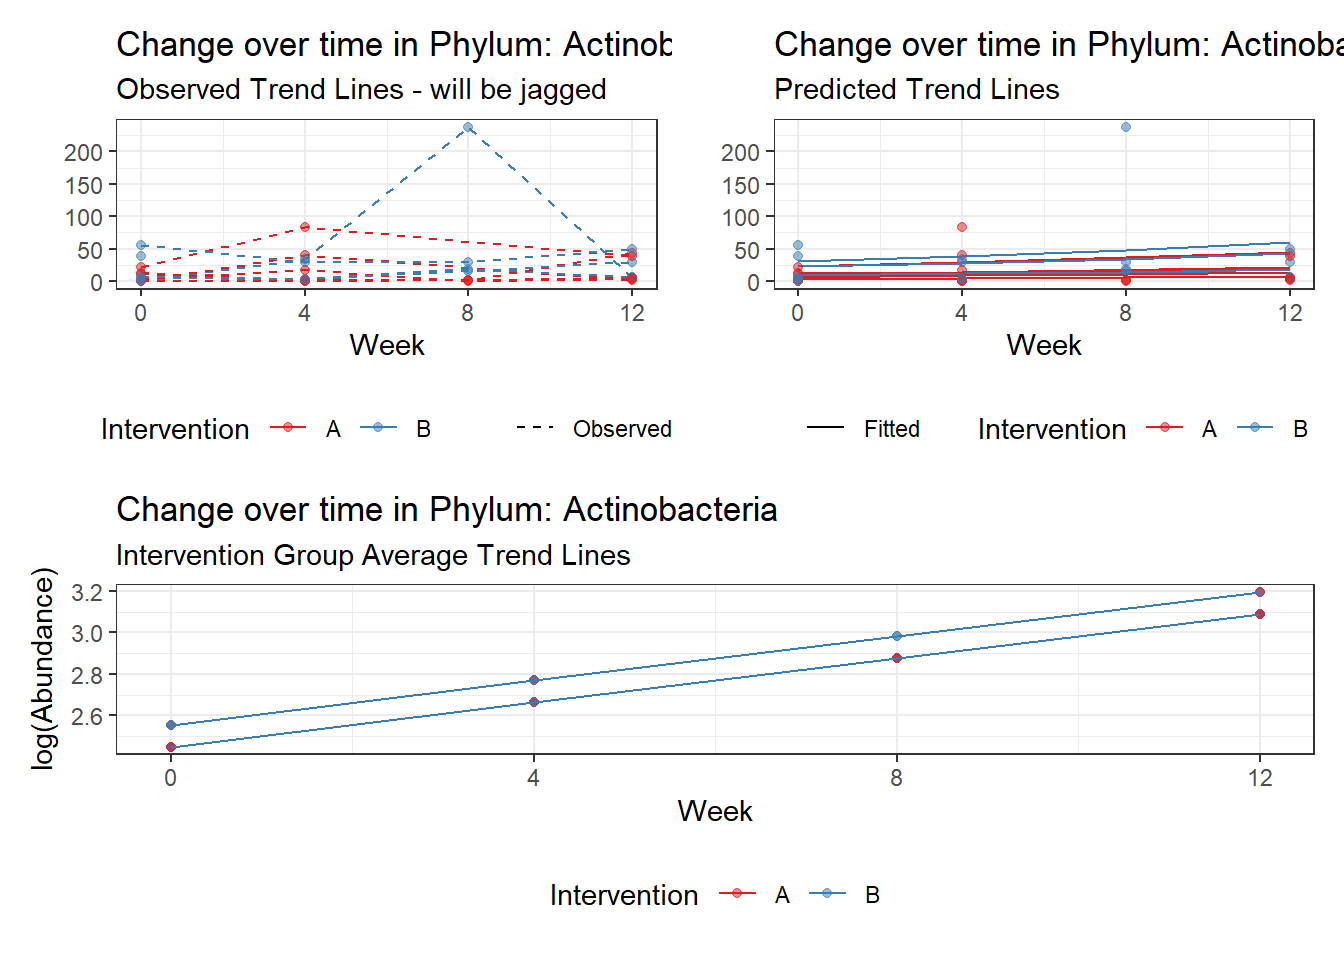
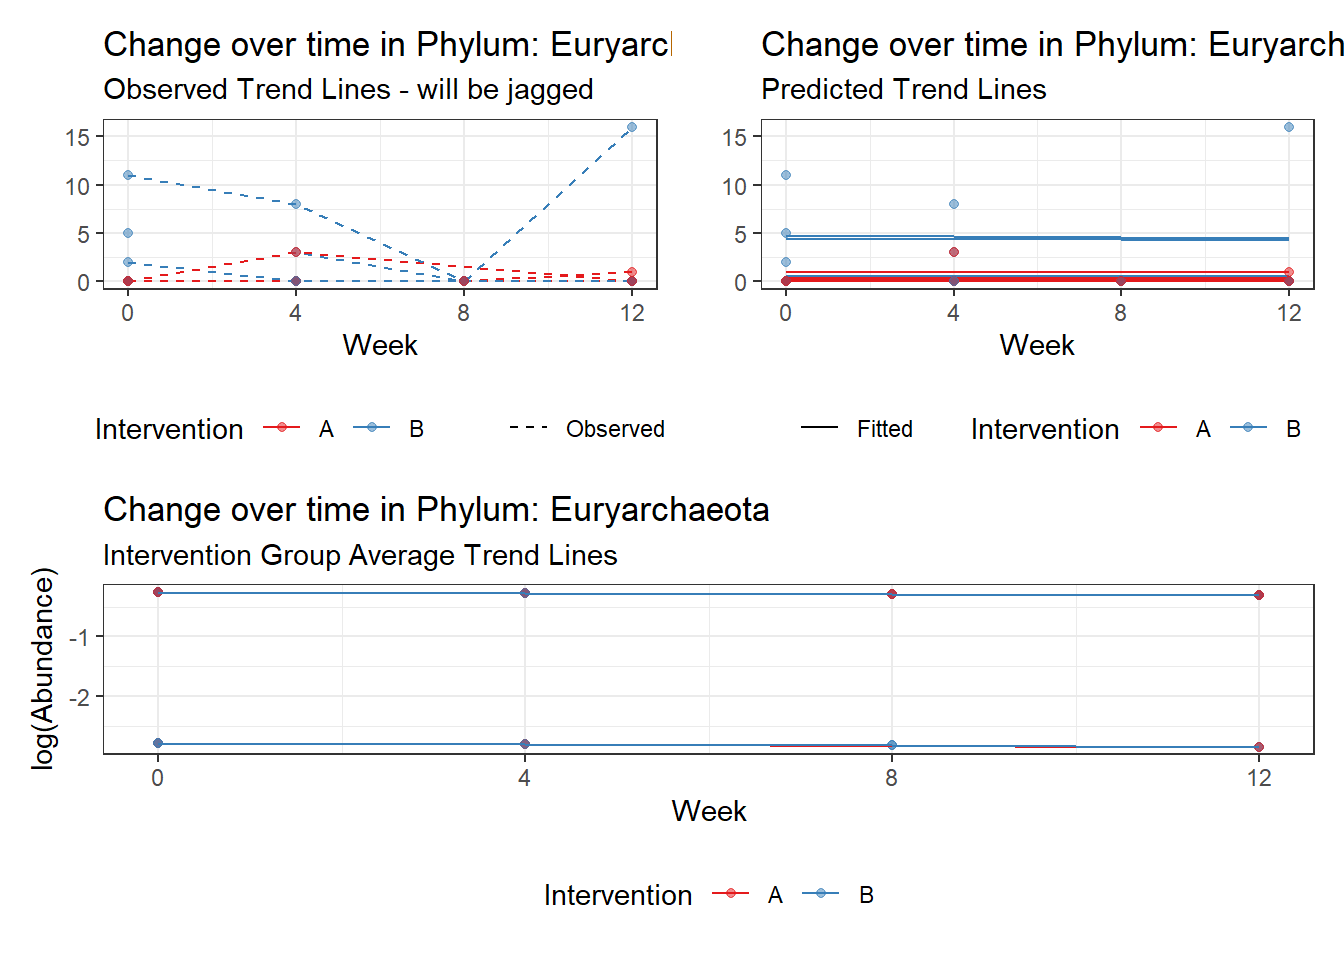
Controlling for the effect of time, Gender was only signficant for Bacteroidetes and Firmicutes. We will take out gender out of model to test other effects, but will come back when testing intervention.
Covariates: Time + Ethnicity
\[\begin{align*} h\left(Y_{ij}\right)&=\beta_{0j} + \beta_{1j}*(Week)_{ij}+ r_{ij}\\ \beta_{0j}&= \gamma_{00} + \gamma_{01}(Ethnicity)_{j} + u_{0j}\\ \beta_{1j}&= \gamma_{10}\\ \end{align*}\]
Ethnicity is coded as Hispanic (effect of being Hispanic compared to White, Asian or Native American). Groups were coded this way due to sample size.
phylum.fit3 <- glmm_microbiome(mydata=microbiome_data,model.number=3,
                               taxa.level="Phylum", link="poisson",
                               model="1 + time + hispanic + (1|SubjectID)")
#########################################
#########################################
Model:  Actinobacteria ~ 1 + time + hispanic + (1 | SubjectID)
<environment: 0x000000004ce5a200>

Link:    poisson


Intraclass Correlation (ICC):   0.4798439

Fixed Effects (change in log)

                   Outcome Estimate Std. Error z value Pr(>|z|)
(Intercept) Actinobacteria  2.13350    0.49326 4.32533  0.00002
time        Actinobacteria  0.17954    0.03053 5.88069  0.00000
hispanic    Actinobacteria  0.57933    0.61313 0.94488  0.34472


Random Effects (SD on log scale)

 Groups    Name        Std.Dev.
 SubjectID (Intercept) 0.96047

Significance test not available for random effects

#########################################
#########################################
Model:  Bacteroidetes ~ 1 + time + hispanic + (1 | SubjectID)
<environment: 0x000000004ce5a200>

Link:    poisson


Intraclass Correlation (ICC):   0.1625324

Fixed Effects (change in log)

                  Outcome Estimate Std. Error   z value Pr(>|z|)
(Intercept) Bacteroidetes  8.22674    0.22034  37.33580  0.00000
time        Bacteroidetes -0.03232    0.00265 -12.18155  0.00000
hispanic    Bacteroidetes -0.34125    0.27622  -1.23544  0.21667


Random Effects (SD on log scale)

 Groups    Name        Std.Dev.
 SubjectID (Intercept) 0.44054

Significance test not available for random effects

#########################################
#########################################
Model:  Cyanobacteria ~ 1 + time + hispanic + (1 | SubjectID)
<environment: 0x000000004ce5a200>

Link:    poisson


Intraclass Correlation (ICC):   0.9381702

Fixed Effects (change in log)

                  Outcome Estimate Std. Error  z value Pr(>|z|)
(Intercept) Cyanobacteria -2.32857    2.48673 -0.93640  0.34907
time        Cyanobacteria -0.27244    0.03201 -8.51175  0.00000
hispanic    Cyanobacteria  2.57061    2.81681  0.91260  0.36145


Random Effects (SD on log scale)

 Groups    Name        Std.Dev.
 SubjectID (Intercept) 3.8953

Significance test not available for random effects

#########################################
#########################################
Model:  Euryarchaeota ~ 1 + time + hispanic + (1 | SubjectID)
<environment: 0x000000004ce5a200>

Link:    poisson


Intraclass Correlation (ICC):   0.6356139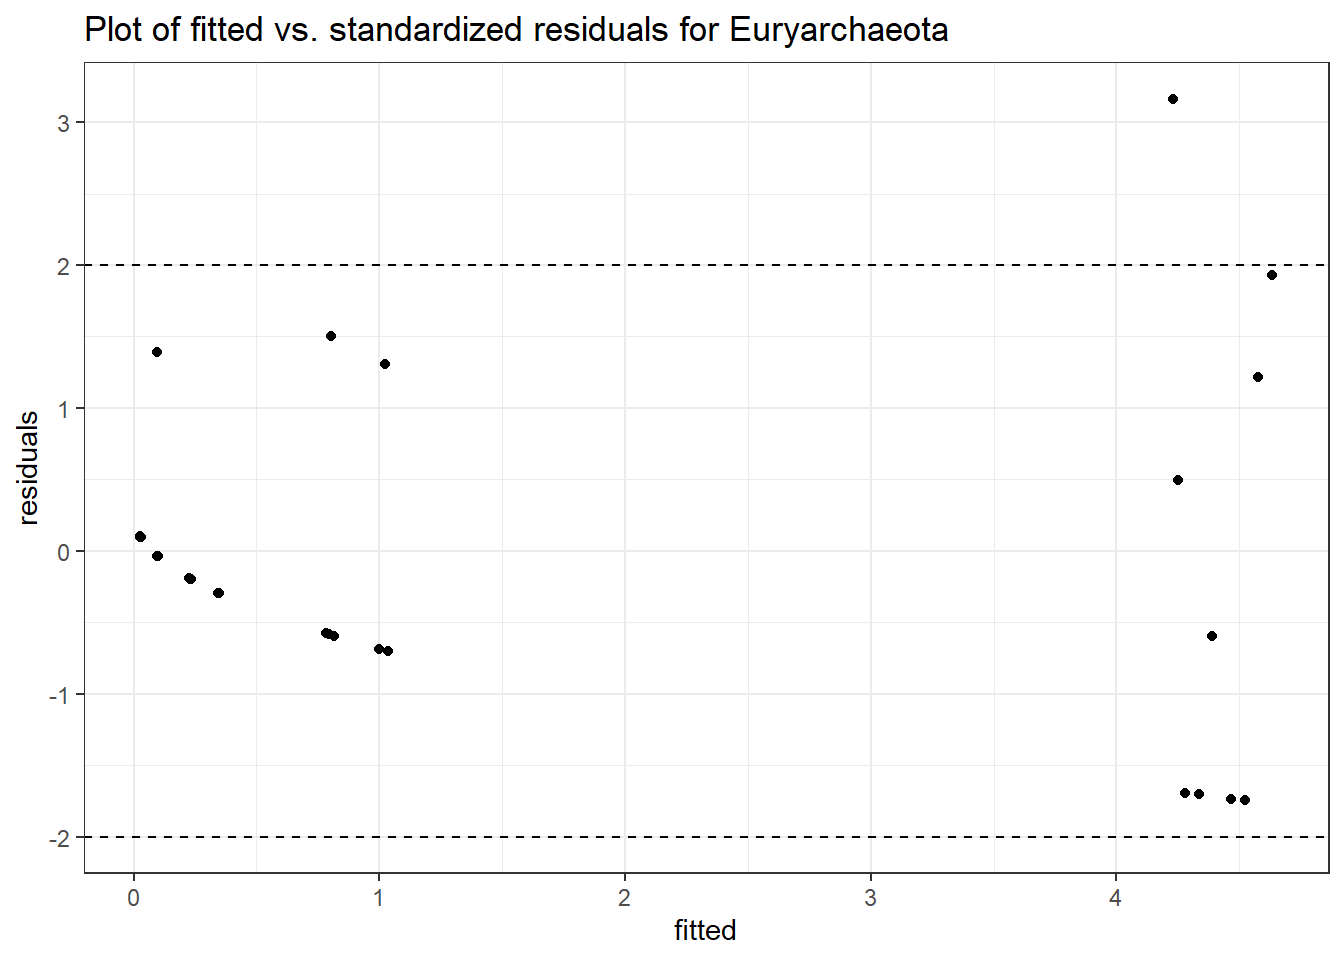
Fixed Effects (change in log)

                  Outcome Estimate Std. Error  z value Pr(>|z|)
(Intercept) Euryarchaeota -3.39308    1.36474 -2.48624  0.01291
time        Euryarchaeota -0.01230    0.13243 -0.09285  0.92602
hispanic    Euryarchaeota  3.53265    1.41244  2.50110  0.01238


Random Effects (SD on log scale)

 Groups    Name        Std.Dev.
 SubjectID (Intercept) 1.3207

Significance test not available for random effects

#########################################
#########################################
Model:  Firmicutes ~ 1 + time + hispanic + (1 | SubjectID)
<environment: 0x000000004ce5a200>

Link:    poisson


Intraclass Correlation (ICC):   0.1316301
Fixed Effects (change in log)

               Outcome Estimate Std. Error  z value Pr(>|z|)
(Intercept) Firmicutes  7.87986    0.19477 40.45704  0.00000
time        Firmicutes  0.02657    0.00267  9.96905  0.00000
hispanic    Firmicutes  0.06564    0.24413  0.26889  0.78801


Random Effects (SD on log scale)

 Groups    Name        Std.Dev.
 SubjectID (Intercept) 0.38934

Significance test not available for random effects

#########################################
#########################################
Model:  Lentisphaerae ~ 1 + time + hispanic + (1 | SubjectID)
<environment: 0x000000004ce5a200>

Link:    poisson


Intraclass Correlation (ICC):   0.8242502

Fixed Effects (change in log)

                  Outcome Estimate Std. Error  z value Pr(>|z|)
(Intercept) Lentisphaerae -1.36816    1.32622 -1.03162  0.30225
time        Lentisphaerae  0.30516    0.05828  5.23622  0.00000
hispanic    Lentisphaerae  1.99760    1.52540  1.30956  0.19035


Random Effects (SD on log scale)

 Groups    Name        Std.Dev.
 SubjectID (Intercept) 2.1656

Significance test not available for random effects

#########################################
#########################################
Model:  Proteobacteria ~ 1 + time + hispanic + (1 | SubjectID)
<environment: 0x000000004ce5a200>

Link:    poisson


Intraclass Correlation (ICC):   0.06821181

Fixed Effects (change in log)

                   Outcome Estimate Std. Error  z value Pr(>|z|)
(Intercept) Proteobacteria  5.94109    0.13653 43.51361  0.00000
time        Proteobacteria -0.04985    0.00838 -5.95264  0.00000
hispanic    Proteobacteria -0.28727    0.17084 -1.68152  0.09266


Random Effects (SD on log scale)

 Groups    Name        Std.Dev.
 SubjectID (Intercept) 0.27056

Significance test not available for random effects

#########################################
#########################################
Model:  Tenericutes ~ 1 + time + hispanic + (1 | SubjectID)
<environment: 0x000000004ce5a200>

Link:    poisson


Intraclass Correlation (ICC):   0.8933541
Fixed Effects (change in log)

                Outcome Estimate Std. Error  z value Pr(>|z|)
(Intercept) Tenericutes -1.84391    1.71374 -1.07596  0.28195
time        Tenericutes  0.72216    0.02492 28.98177  0.00000
hispanic    Tenericutes  3.49256    2.01726  1.73134  0.08339


Random Effects (SD on log scale)

 Groups    Name        Std.Dev.
 SubjectID (Intercept) 2.8943

Significance test not available for random effects

#########################################
#########################################
Model:  Verrucomicrobia ~ 1 + time + hispanic + (1 | SubjectID)
<environment: 0x000000004ce5a200>

Link:    poisson


Intraclass Correlation (ICC):   0.8512603

Fixed Effects (change in log)

                    Outcome Estimate Std. Error z value Pr(>|z|)
(Intercept) Verrucomicrobia  3.81822    1.19875 3.18516  0.00145
time        Verrucomicrobia  0.00501    0.00920 0.54458  0.58604
hispanic    Verrucomicrobia  1.09275    1.50857 0.72436  0.46884


Random Effects (SD on log scale)

 Groups    Name        Std.Dev.
 SubjectID (Intercept) 2.3923

Significance test not available for random effects
phylum.fit3b <- glmm_microbiome(mydata=microbiome_data,model.number=3,
taxa.level="Phylum", link="negbinom",
model="1 + time + hispanic + (1|SubjectID)")
#########################################
#########################################
Model:  Actinobacteria ~ 1 + time + hispanic + (1 | SubjectID)
<environment: 0x000000003ebecac0>

Link:    negbinom


Intraclass Correlation (ICC):   0.3725376
Fixed Effects (change in log)

                   Outcome Estimate Std. Error z value Pr(>|z|)
(Intercept) Actinobacteria  2.16720    0.58413 3.71010  0.00021
time        Actinobacteria  0.22287    0.19061 1.16922  0.24232
hispanic    Actinobacteria  0.48407    0.63776 0.75902  0.44784


Random Effects (SD on log scale)

 Groups    Name        Std.Dev.
 SubjectID (Intercept) 0.77053

Significance test not available for random effects

#########################################
#########################################
Model:  Bacteroidetes ~ 1 + time + hispanic + (1 | SubjectID)
<environment: 0x000000003ebecac0>

Link:    negbinom


Intraclass Correlation (ICC):   0.1236759
Fixed Effects (change in log)

                  Outcome Estimate Std. Error  z value Pr(>|z|)
(Intercept) Bacteroidetes  8.25335    0.20482 40.29657  0.00000
time        Bacteroidetes -0.04826    0.03488 -1.38335  0.16656
hispanic    Bacteroidetes -0.32376    0.25090 -1.29040  0.19691


Random Effects (SD on log scale)

 Groups    Name        Std.Dev.
 SubjectID (Intercept) 0.37567

Significance test not available for random effects

#########################################
#########################################
Model:  Cyanobacteria ~ 1 + time + hispanic + (1 | SubjectID)
<environment: 0x000000003ebecac0>

Link:    negbinom
Warning in checkConv(attr(opt, "derivs"), opt$par, ctrl = control$checkConv, :
Model failed to converge with max|grad| = 0.0157651 (tol = 0.002, component 1)boundary (singular) fit: see ?isSingular
Intraclass Correlation (ICC): 9.048682e-13
Fixed Effects (change in log)

                  Outcome Estimate Std. Error  z value Pr(>|z|)
(Intercept) Cyanobacteria -2.41570    2.55871 -0.94411  0.34511
time        Cyanobacteria  1.31650    0.89582  1.46959  0.14167
hispanic    Cyanobacteria  4.89246    2.19467  2.22924  0.02580


Random Effects (SD on log scale)

 Groups    Name        Std.Dev.
 SubjectID (Intercept) 9.5125e-07

Significance test not available for random effects

#########################################
#########################################
Model:  Euryarchaeota ~ 1 + time + hispanic + (1 | SubjectID)
<environment: 0x000000003ebecac0>

Link:    negbinom
boundary (singular) fit: see ?isSingular
Intraclass Correlation (ICC): 2.303365e-10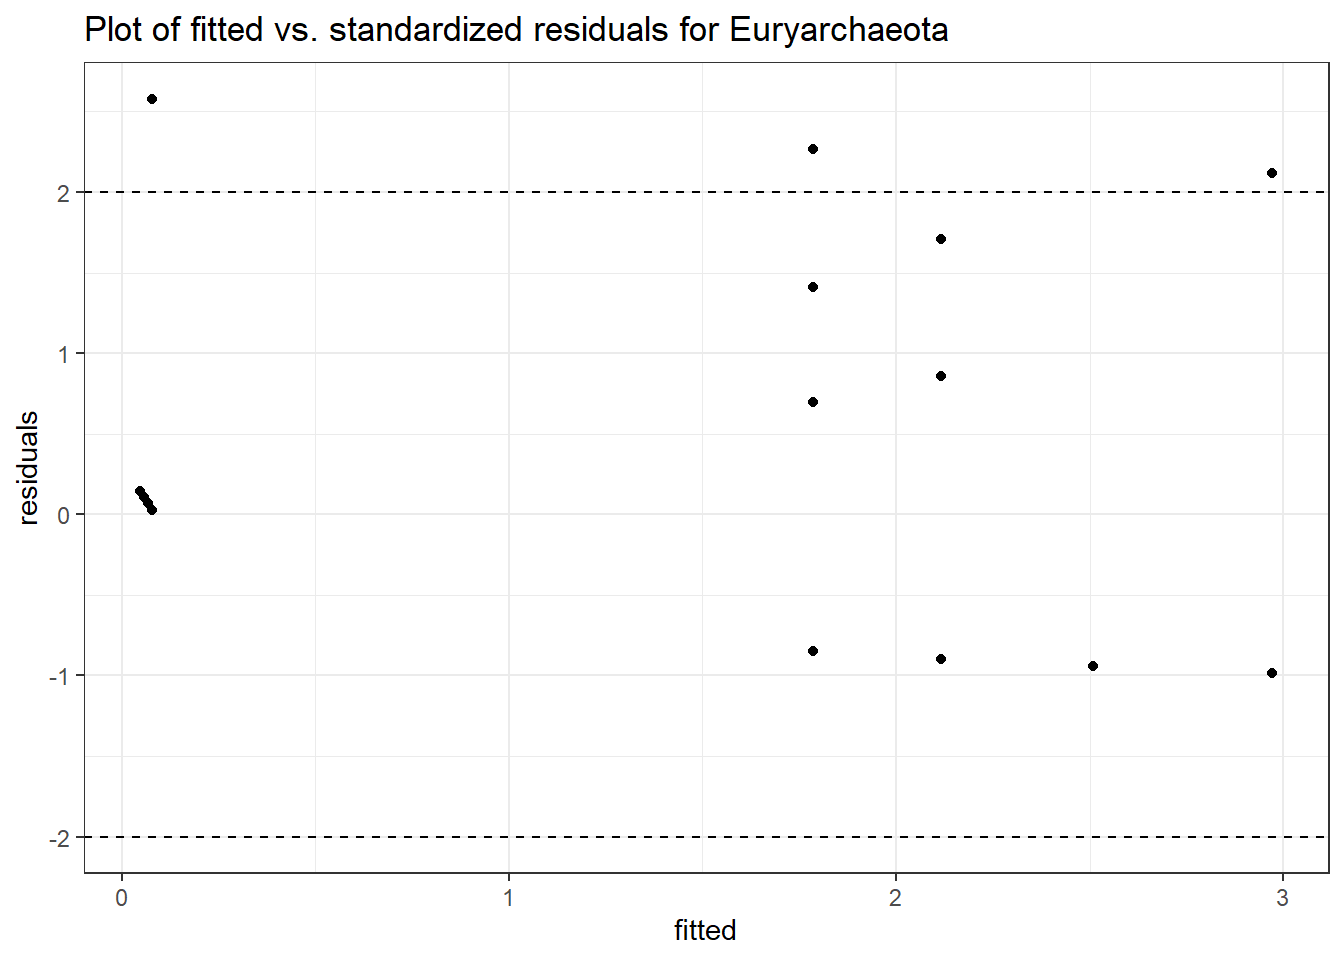
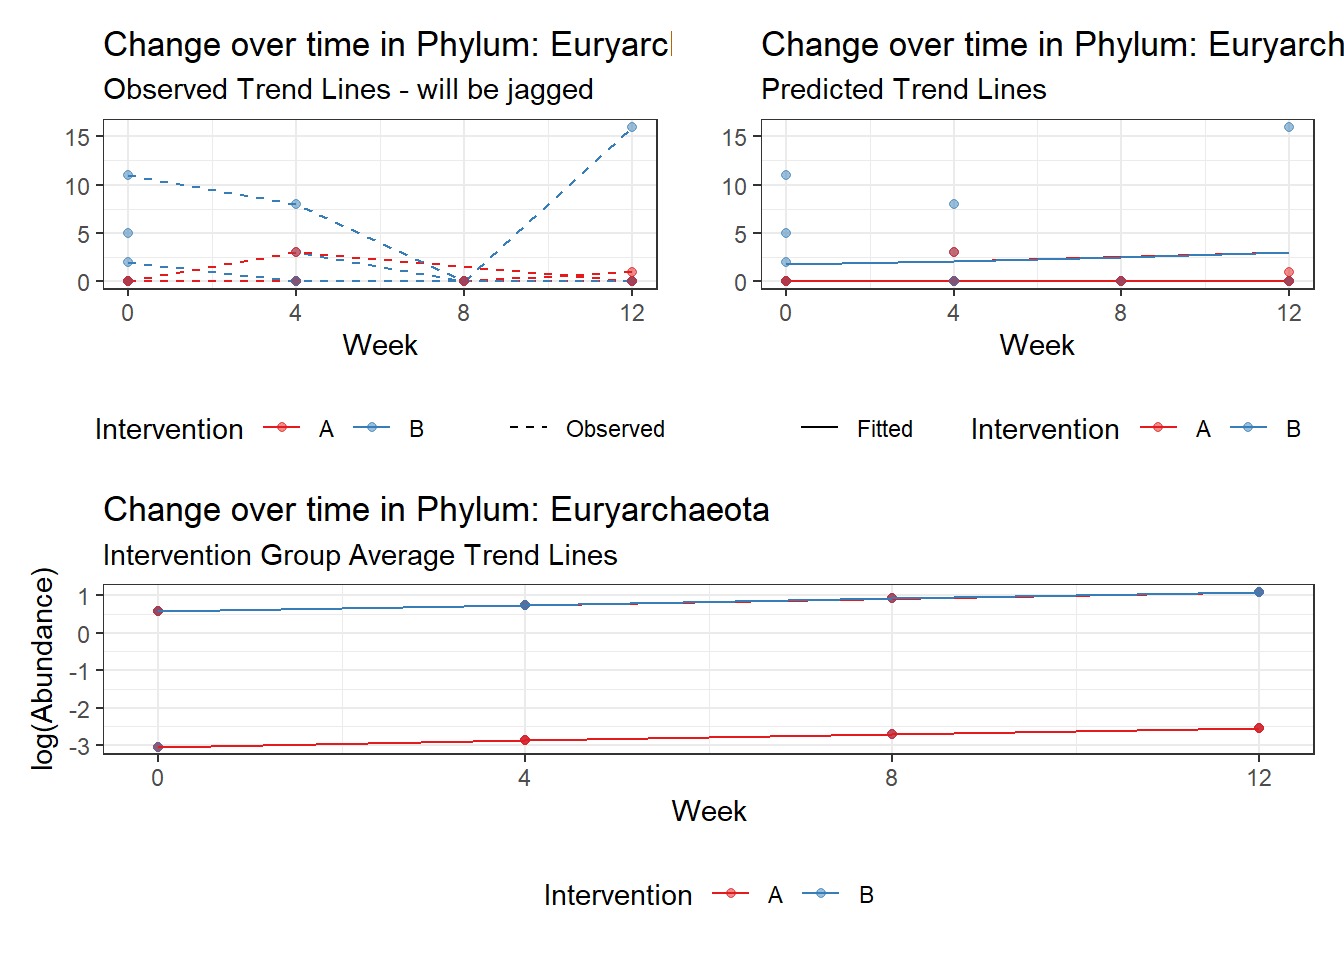
Fixed Effects (change in log)

                  Outcome Estimate Std. Error  z value Pr(>|z|)
(Intercept) Euryarchaeota -3.04341    1.47908 -2.05764  0.03962
time        Euryarchaeota  0.16964    0.42605  0.39816  0.69051
hispanic    Euryarchaeota  3.62365    1.38726  2.61210  0.00900


Random Effects (SD on log scale)

 Groups    Name        Std.Dev.
 SubjectID (Intercept) 1.5177e-05

Significance test not available for random effects

#########################################
#########################################
Model:  Firmicutes ~ 1 + time + hispanic + (1 | SubjectID)
<environment: 0x000000003ebecac0>

Link:    negbinom


Intraclass Correlation (ICC):   0.1198663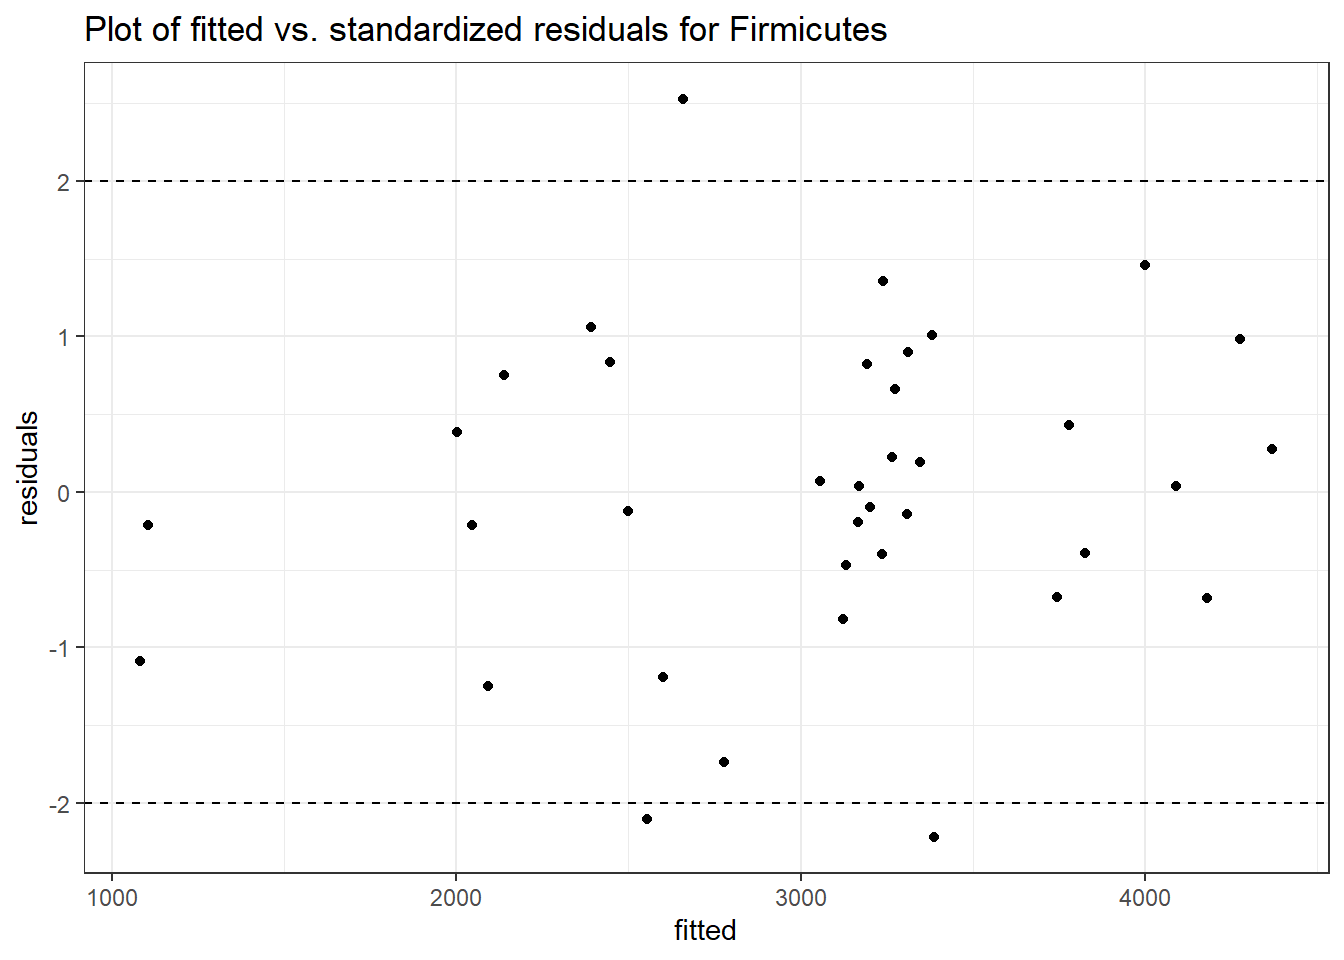
Fixed Effects (change in log)

               Outcome Estimate Std. Error  z value Pr(>|z|)
(Intercept) Firmicutes  7.88771    0.19223 41.03337  0.00000
time        Firmicutes  0.02203    0.02412  0.91332  0.36107
hispanic    Firmicutes  0.06340    0.23817  0.26619  0.79010


Random Effects (SD on log scale)

 Groups    Name        Std.Dev.
 SubjectID (Intercept) 0.36904

Significance test not available for random effects

#########################################
#########################################
Model:  Lentisphaerae ~ 1 + time + hispanic + (1 | SubjectID)
<environment: 0x000000003ebecac0>

Link:    negbinom
boundary (singular) fit: see ?isSingular
Intraclass Correlation (ICC): 2.414581e-10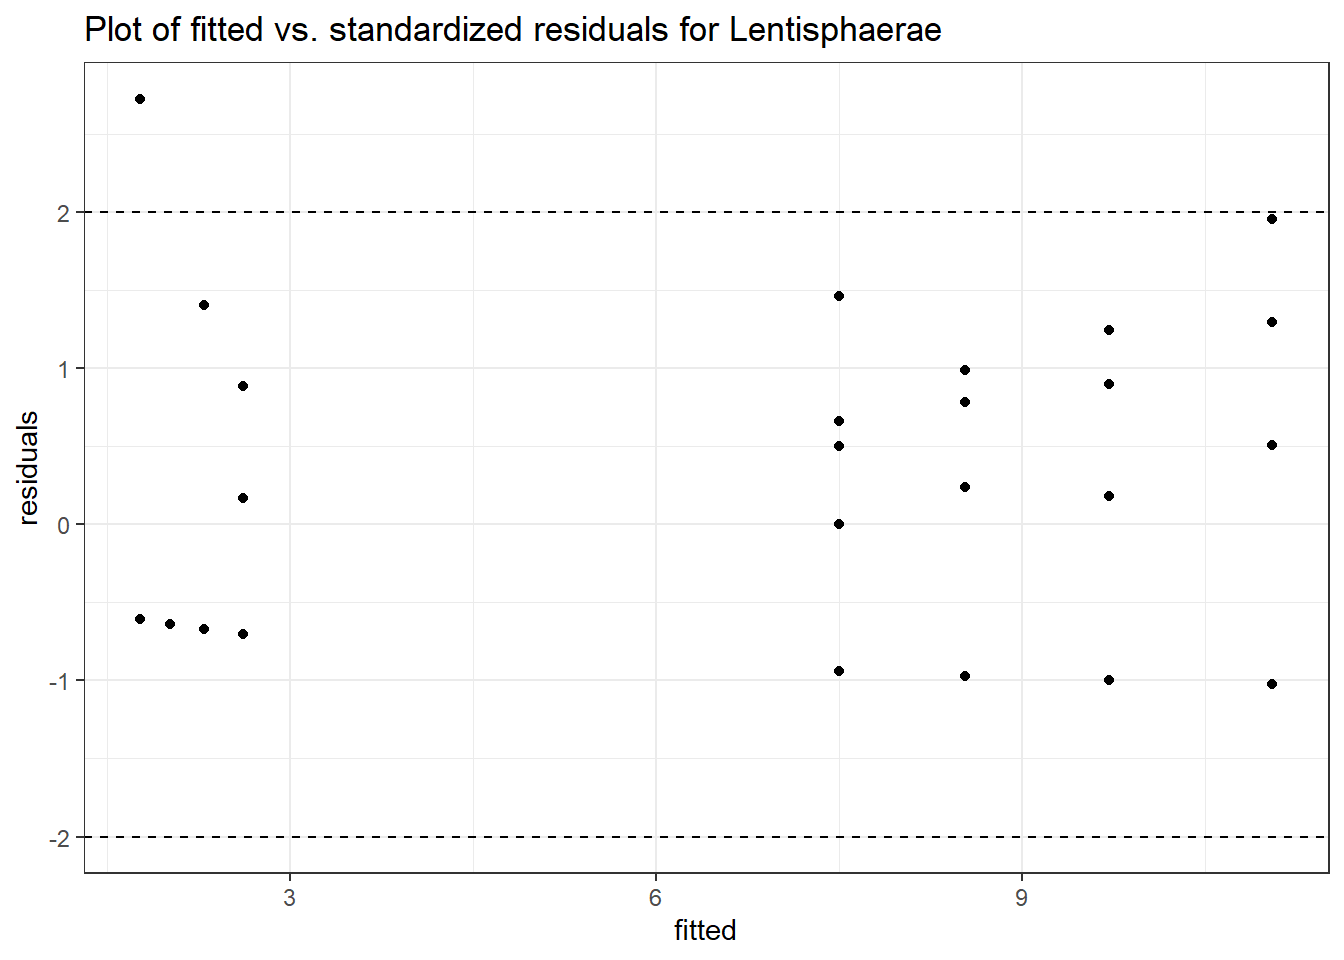
Fixed Effects (change in log)

                  Outcome Estimate Std. Error z value Pr(>|z|)
(Intercept) Lentisphaerae  0.57149    0.63203 0.90422  0.36588
time        Lentisphaerae  0.12932    0.29903 0.43247  0.66540
hispanic    Lentisphaerae  1.44284    0.78080 1.84790  0.06462


Random Effects (SD on log scale)

 Groups    Name        Std.Dev.
 SubjectID (Intercept) 1.5539e-05

Significance test not available for random effects

#########################################
#########################################
Model:  Proteobacteria ~ 1 + time + hispanic + (1 | SubjectID)
<environment: 0x000000003ebecac0>

Link:    negbinom


Intraclass Correlation (ICC):   0.008002456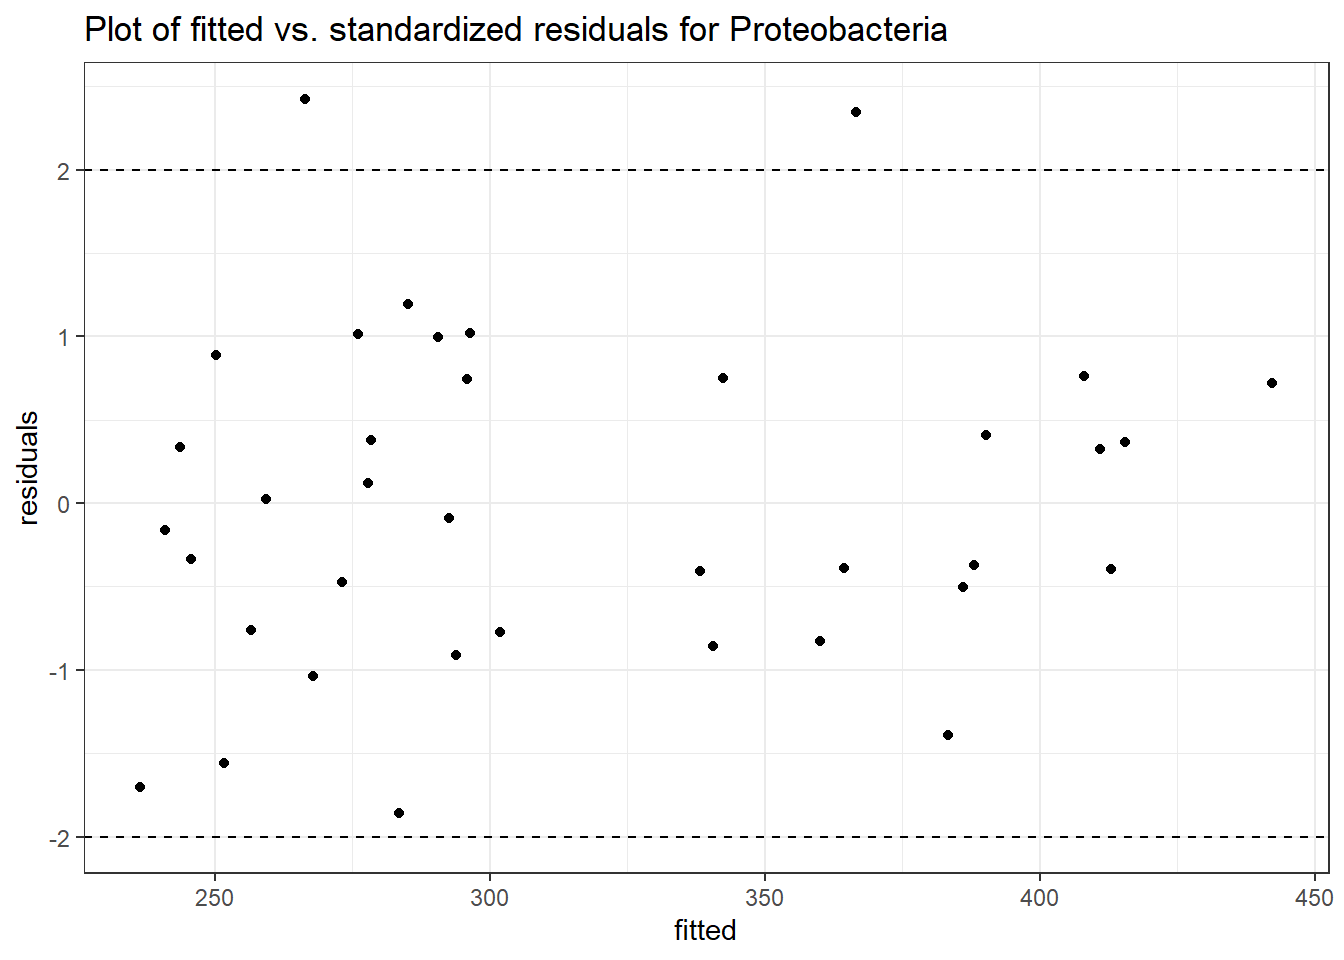
Fixed Effects (change in log)

                   Outcome Estimate Std. Error  z value Pr(>|z|)
(Intercept) Proteobacteria  6.03616    0.21207 28.46316  0.00000
time        Proteobacteria -0.06249    0.08890 -0.70300  0.48205
hispanic    Proteobacteria -0.35349    0.21780 -1.62302  0.10459


Random Effects (SD on log scale)

 Groups    Name        Std.Dev.
 SubjectID (Intercept) 0.089817

Significance test not available for random effects

#########################################
#########################################
Model:  Tenericutes ~ 1 + time + hispanic + (1 | SubjectID)
<environment: 0x000000003ebecac0>

Link:    negbinom
Error in factory(refitNB, types = c("message", "warning"))(lastfit, theta = exp(t), : pwrssUpdate did not converge in (maxit) iterations
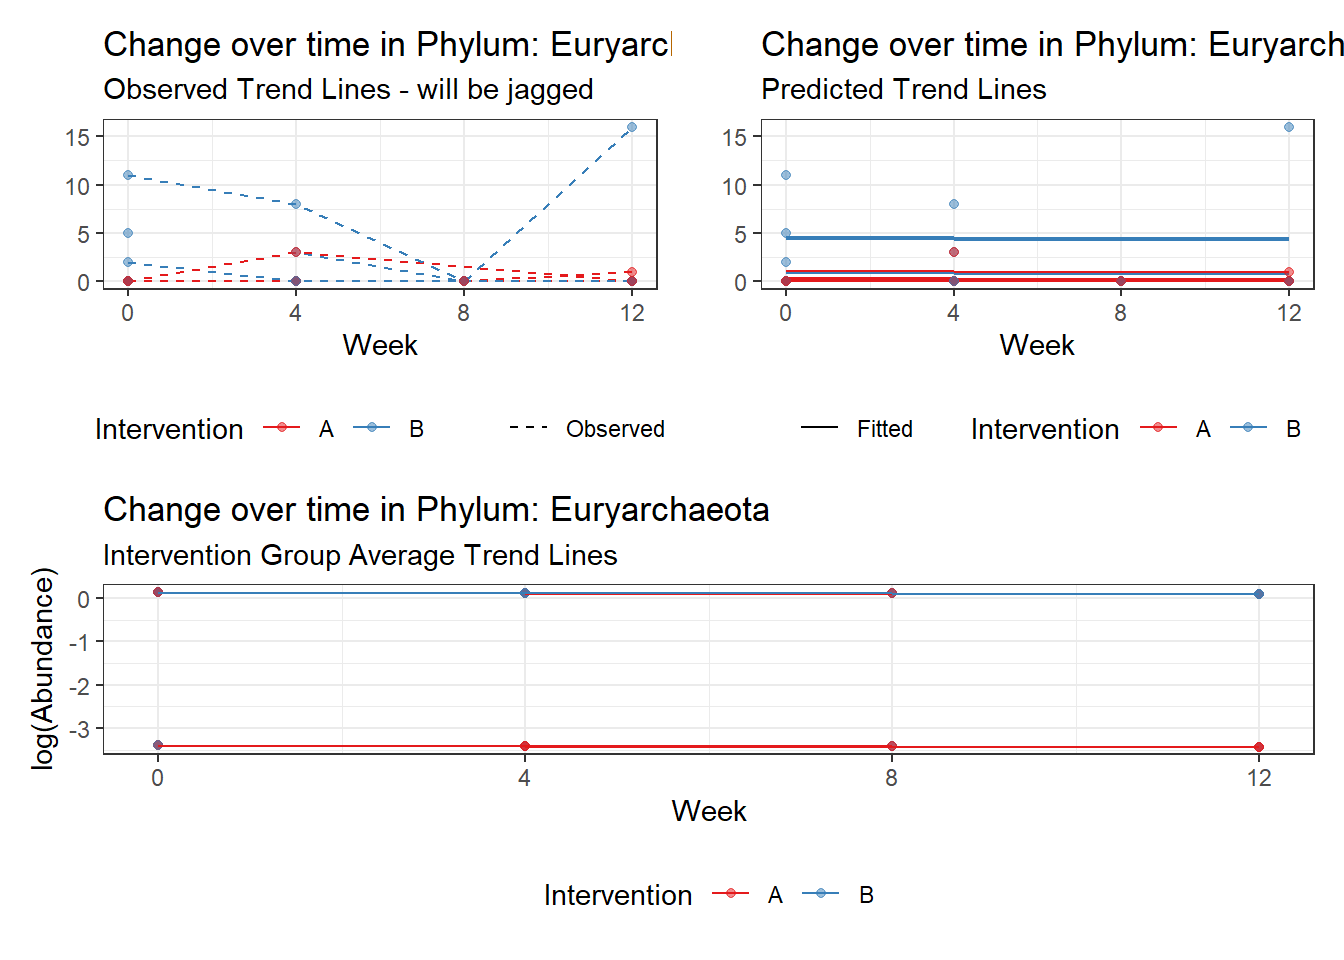
Controlling for the effect of time, Ethnicity was not significant for all Phylum.
Effect of Intervention
Next, we invested the effect of intervention, however, the results are parsed between which covariates are included in the model.
Intervention was coded as (group A = 0, and group B = 1). So, the results are interpretted as the effect of being in intervention group B.
Covariate(s): Time
\[\begin{align*} h\left(Y_{ij}\right)&=\beta_{0j} + \beta_{1j}*(Week)_{ij} + r_{ij}\\ \beta_{0j}&= \gamma_{00} + \gamma_{01}(Intervention)_{j} + u_{0j}\\ \beta_{1j}&= \gamma_{10}\\ \end{align*}\]
The effect of intervention is the main outcome of this study.
phylum.fit4 <- glmm_microbiome(mydata=microbiome_data,model.number=4,
                               taxa.level="Phylum", link="poisson",
                               model="1 + intB + time + (1|SubjectID)")
#########################################
#########################################
Model:  Actinobacteria ~ 1 + intB + time + (1 | SubjectID)
<environment: 0x0000000049981218>

Link:    poisson


Intraclass Correlation (ICC):   0.4323474

Fixed Effects (change in log)

                   Outcome Estimate Std. Error z value Pr(>|z|)
(Intercept) Actinobacteria  2.05964    0.36887 5.58362  0.00000
intB        Actinobacteria  0.97330    0.53808 1.80883  0.07048
time        Actinobacteria  0.17910    0.03052 5.86852  0.00000


Random Effects (SD on log scale)

 Groups    Name        Std.Dev.
 SubjectID (Intercept) 0.87272

Significance test not available for random effects

#########################################
#########################################
Model:  Bacteroidetes ~ 1 + intB + time + (1 | SubjectID)
<environment: 0x0000000049981218>

Link:    poisson


Intraclass Correlation (ICC):   0.1676984

Fixed Effects (change in log)

                  Outcome Estimate Std. Error   z value Pr(>|z|)
(Intercept) Bacteroidetes  8.13729    0.18333  44.38648  0.00000
intB        Bacteroidetes -0.28105    0.27194  -1.03351  0.30137
time        Bacteroidetes -0.03231    0.00265 -12.17884  0.00000


Random Effects (SD on log scale)

 Groups    Name        Std.Dev.
 SubjectID (Intercept) 0.44887

Significance test not available for random effects

#########################################
#########################################
Model:  Cyanobacteria ~ 1 + intB + time + (1 | SubjectID)
<environment: 0x0000000049981218>

Link:    poisson


Intraclass Correlation (ICC):   0.9441699

Fixed Effects (change in log)

                  Outcome Estimate Std. Error  z value Pr(>|z|)
(Intercept) Cyanobacteria -1.43605    2.23406 -0.64280  0.52035
intB        Cyanobacteria  1.37007    2.85794  0.47939  0.63166
time        Cyanobacteria -0.27252    0.03201 -8.51438  0.00000


Random Effects (SD on log scale)

 Groups    Name        Std.Dev.
 SubjectID (Intercept) 4.1124

Significance test not available for random effects

#########################################
#########################################
Model:  Euryarchaeota ~ 1 + intB + time + (1 | SubjectID)
<environment: 0x0000000049981218>

Link:    poisson


Intraclass Correlation (ICC):   0.6298254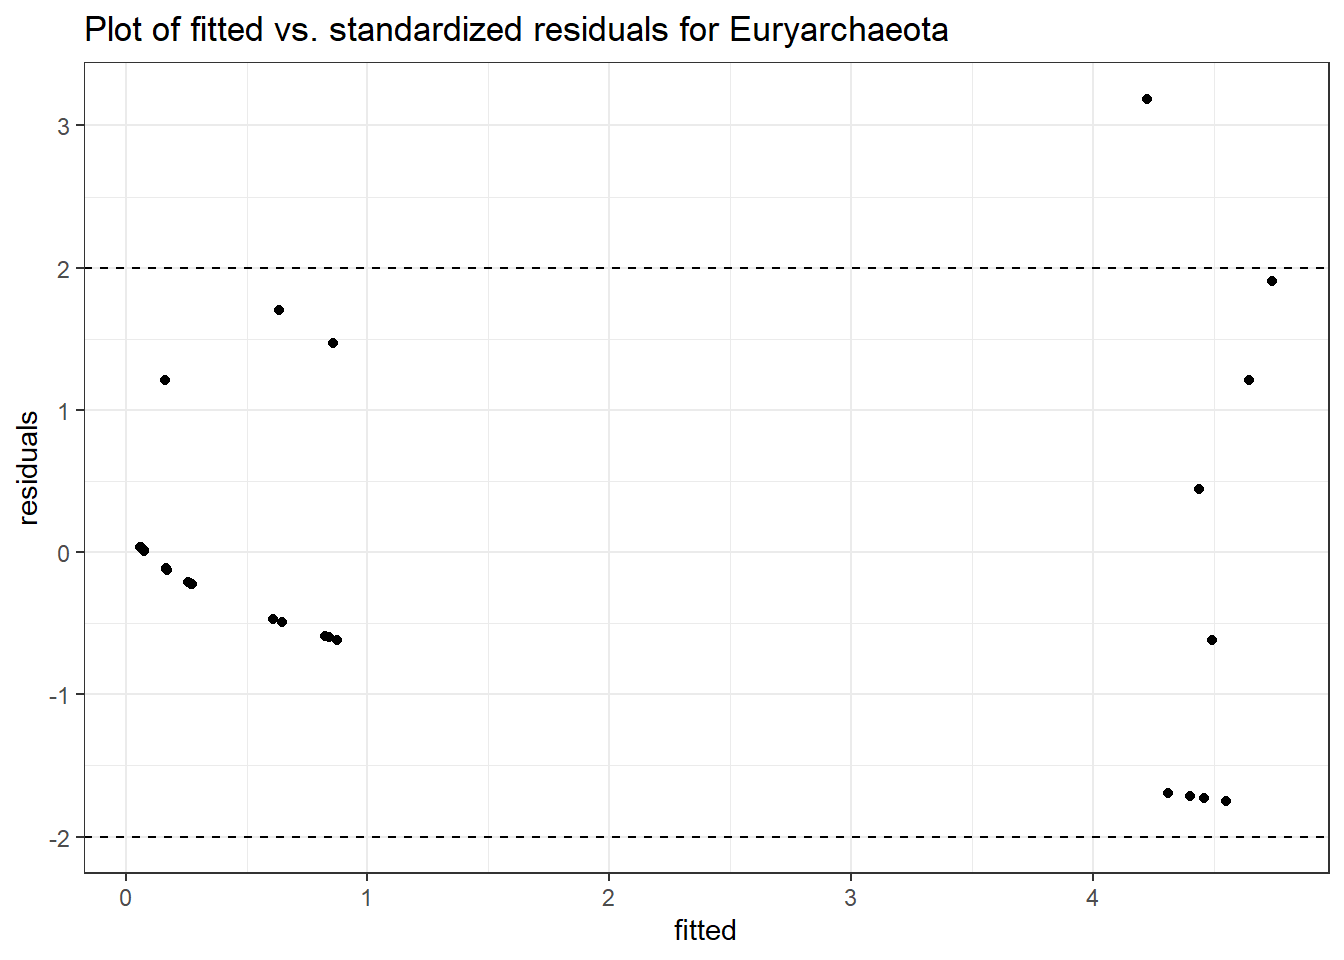
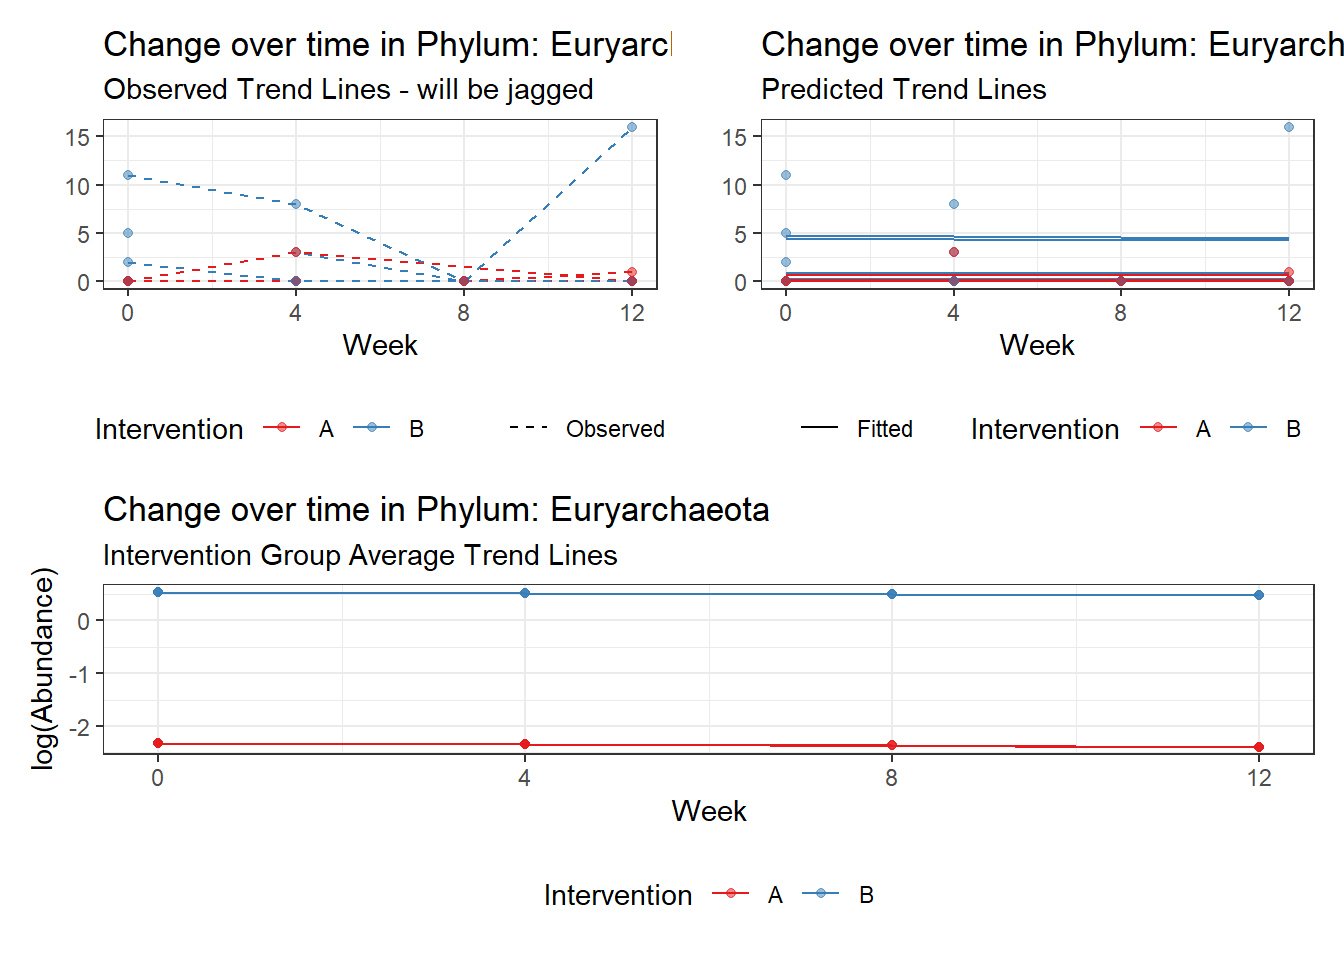
Fixed Effects (change in log)

                  Outcome Estimate Std. Error  z value Pr(>|z|)
(Intercept) Euryarchaeota -2.32923    0.96087 -2.42408  0.01535
intB        Euryarchaeota  2.86692    1.07899  2.65704  0.00788
time        Euryarchaeota -0.02057    0.13259 -0.15513  0.87672


Random Effects (SD on log scale)

 Groups    Name        Std.Dev.
 SubjectID (Intercept) 1.3044

Significance test not available for random effects

#########################################
#########################################
Model:  Firmicutes ~ 1 + intB + time + (1 | SubjectID)
<environment: 0x0000000049981218>

Link:    poisson


Intraclass Correlation (ICC):   0.1283903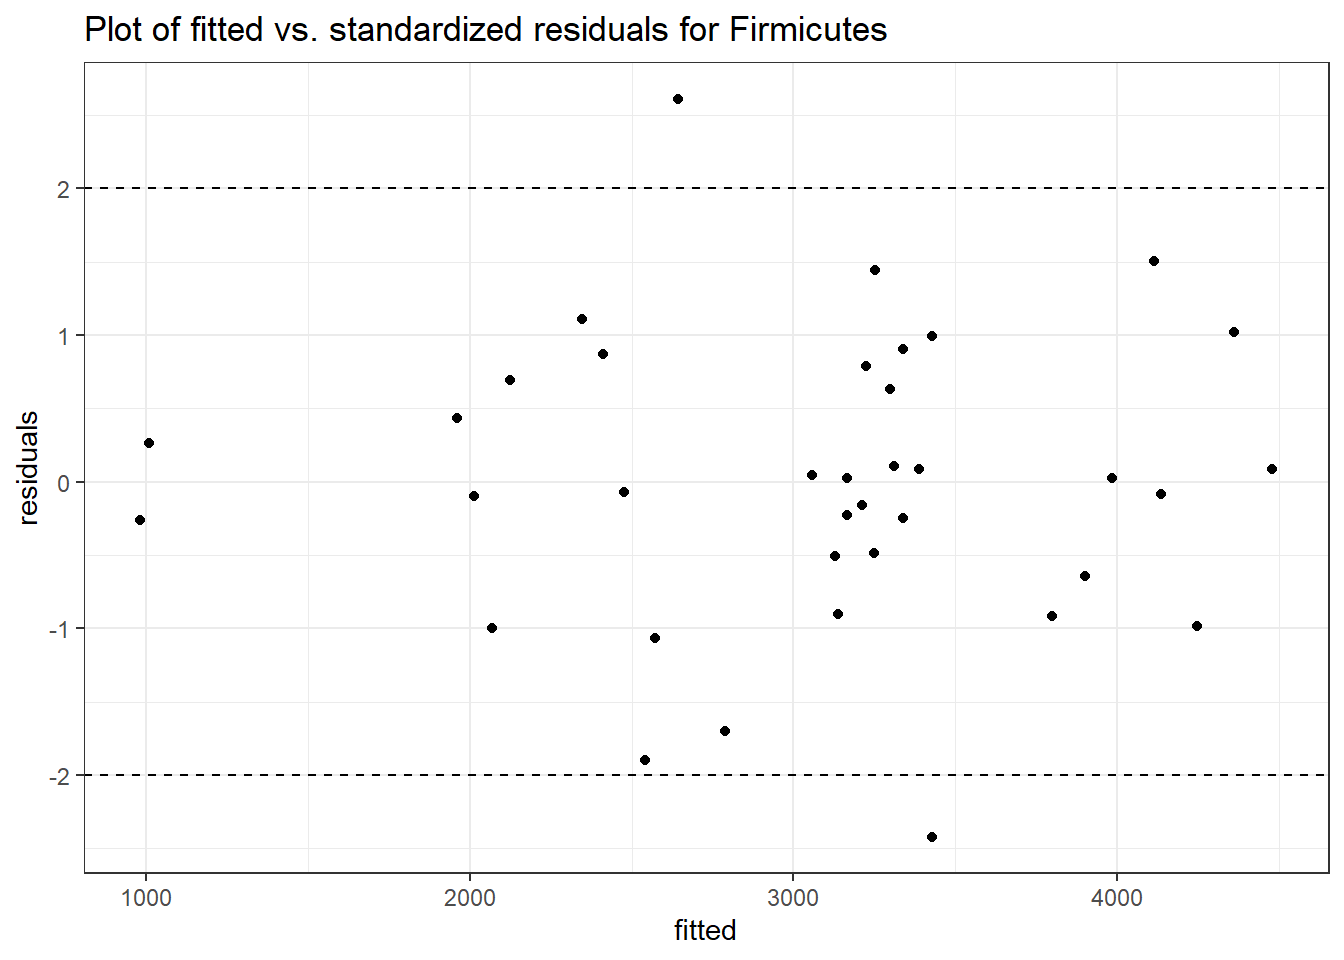
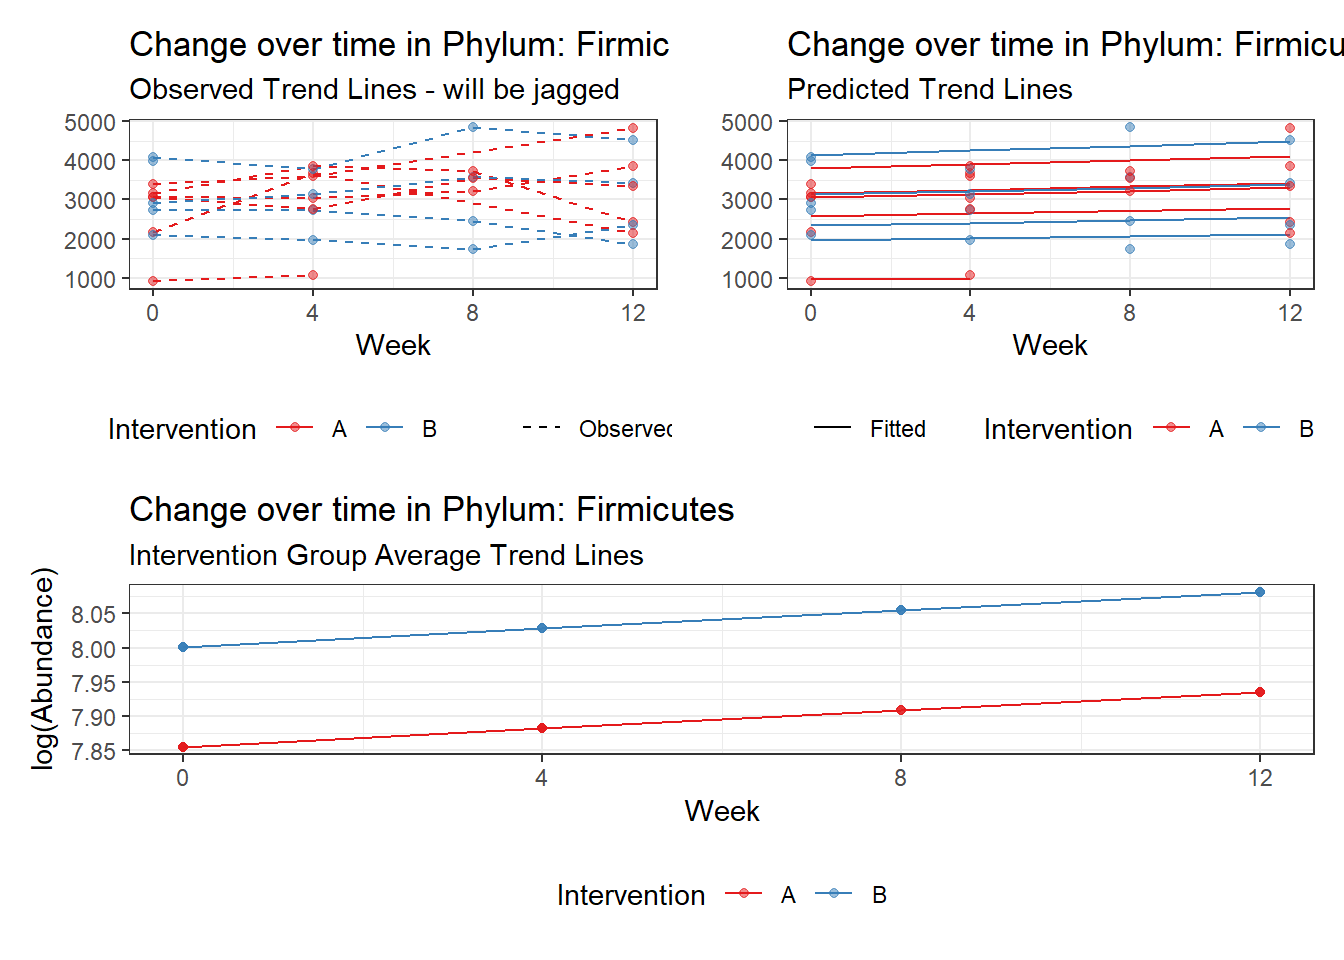
Fixed Effects (change in log)

               Outcome Estimate Std. Error  z value Pr(>|z|)
(Intercept) Firmicutes  7.85508    0.15681 50.09361  0.00000
intB        Firmicutes  0.14637    0.23251  0.62952  0.52901
time        Firmicutes  0.02657    0.00267  9.96894  0.00000


Random Effects (SD on log scale)

 Groups    Name        Std.Dev.
 SubjectID (Intercept) 0.3838

Significance test not available for random effects

#########################################
#########################################
Model:  Lentisphaerae ~ 1 + intB + time + (1 | SubjectID)
<environment: 0x0000000049981218>

Link:    poisson


Intraclass Correlation (ICC):   0.8556082
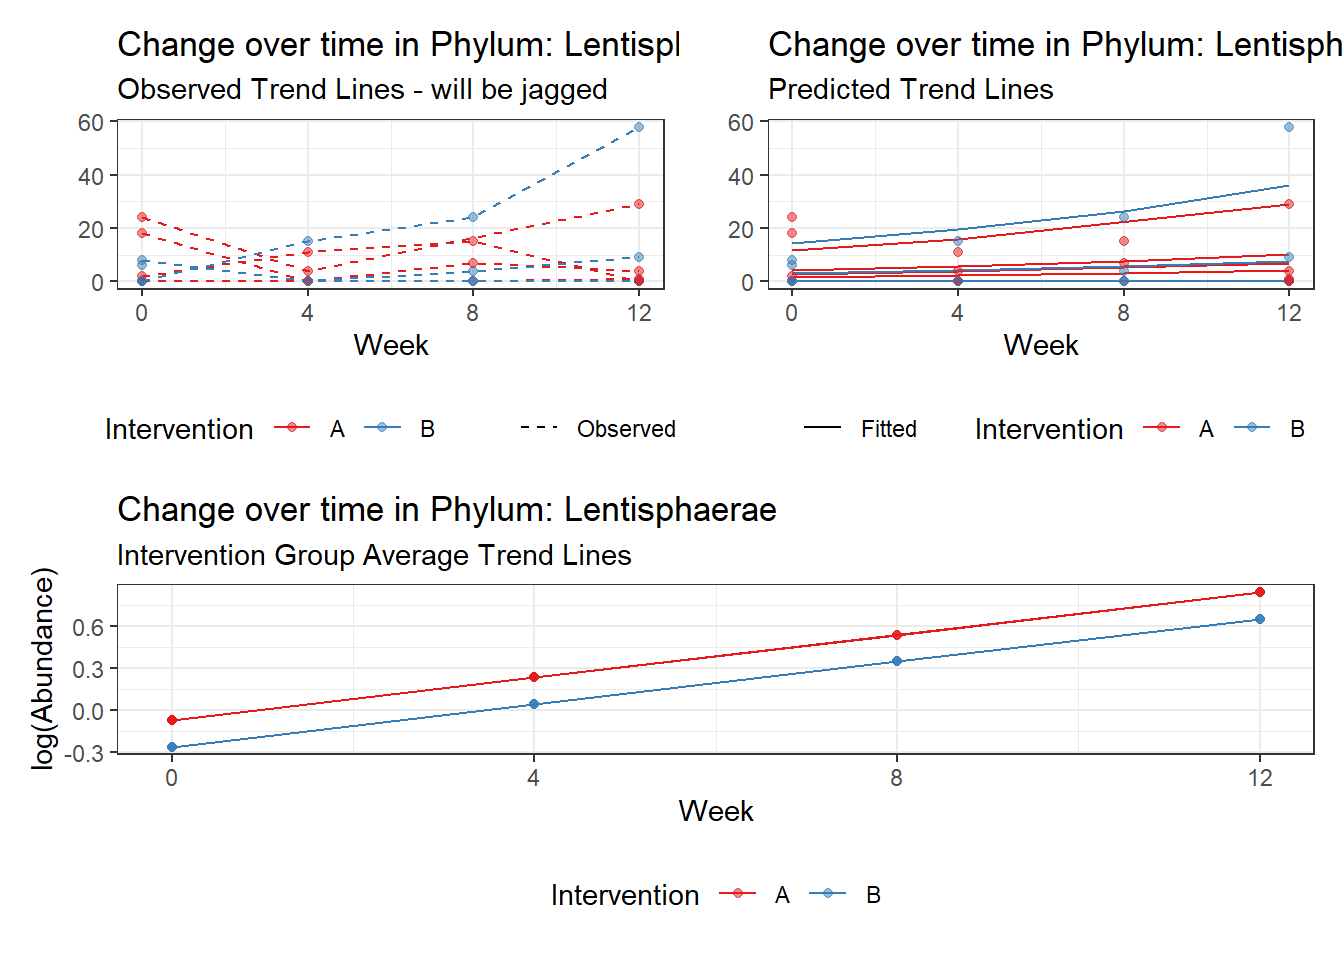
Fixed Effects (change in log)

                  Outcome Estimate Std. Error  z value Pr(>|z|)
(Intercept) Lentisphaerae -0.07292    1.11828 -0.06520  0.94801
intB        Lentisphaerae -0.18831    1.59508 -0.11805  0.90602
time        Lentisphaerae  0.30388    0.05824  5.21735  0.00000


Random Effects (SD on log scale)

 Groups    Name        Std.Dev.
 SubjectID (Intercept) 2.4343

Significance test not available for random effects

#########################################
#########################################
Model:  Proteobacteria ~ 1 + intB + time + (1 | SubjectID)
<environment: 0x0000000049981218>

Link:    poisson


Intraclass Correlation (ICC):   0.07459268
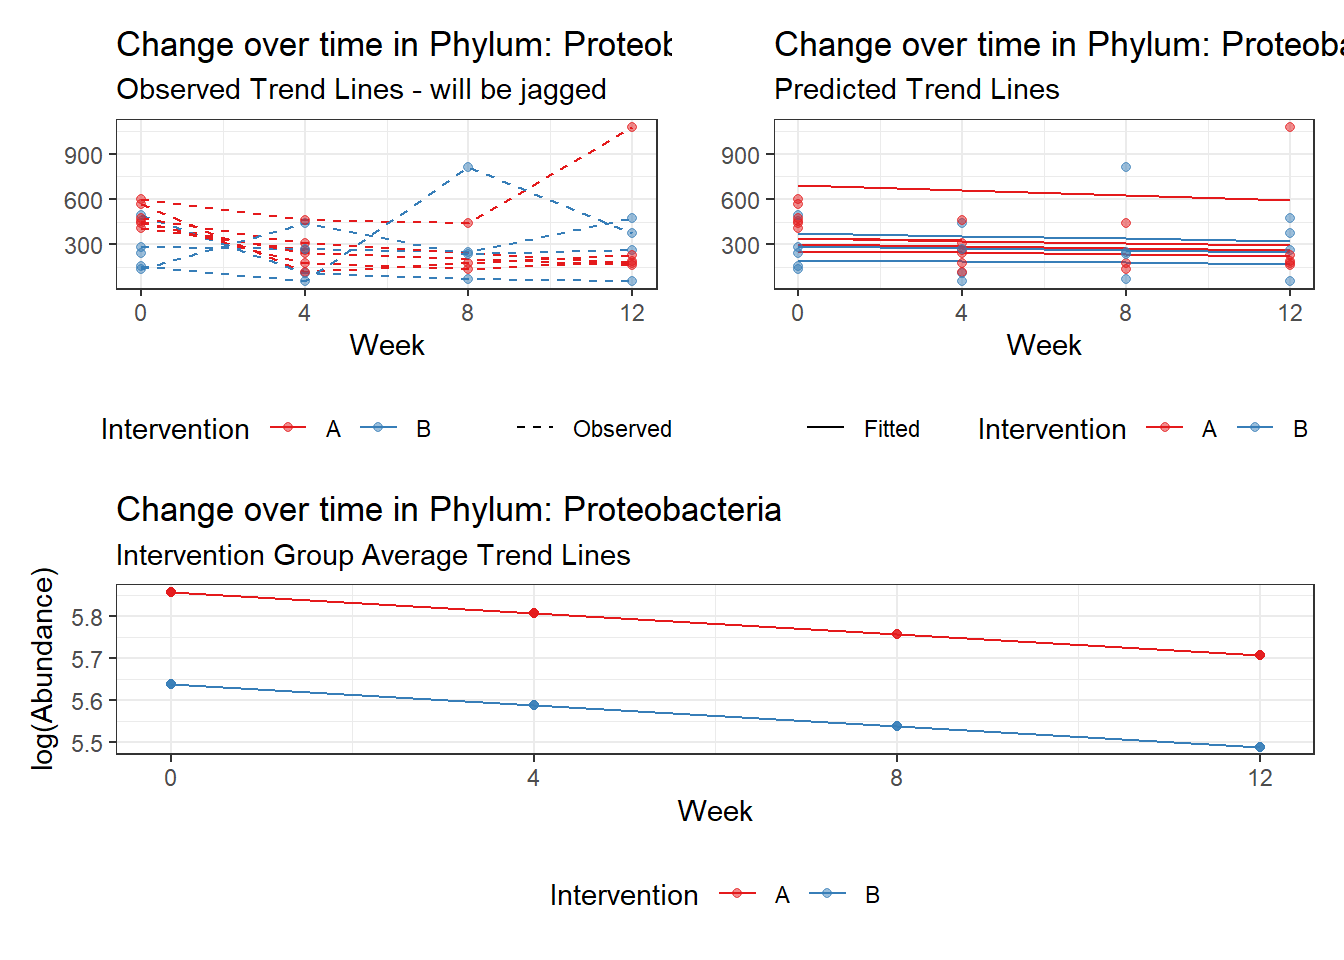
Fixed Effects (change in log)

                   Outcome Estimate Std. Error  z value Pr(>|z|)
(Intercept) Proteobacteria  5.85740    0.11708 50.03022  0.00000
intB        Proteobacteria -0.21827    0.17331 -1.25945  0.20787
time        Proteobacteria -0.04969    0.00838 -5.93286  0.00000


Random Effects (SD on log scale)

 Groups    Name        Std.Dev.
 SubjectID (Intercept) 0.28391

Significance test not available for random effects

#########################################
#########################################
Model:  Tenericutes ~ 1 + intB + time + (1 | SubjectID)
<environment: 0x0000000049981218>

Link:    poisson


Intraclass Correlation (ICC):   0.9160166
Fixed Effects (change in log)

                Outcome Estimate Std. Error  z value Pr(>|z|)
(Intercept) Tenericutes  0.09290    1.40717  0.06602  0.94736
intB        Tenericutes  0.60940    2.05410  0.29668  0.76671
time        Tenericutes  0.72195    0.02489 29.01032  0.00000


Random Effects (SD on log scale)

 Groups    Name        Std.Dev.
 SubjectID (Intercept) 3.3026

Significance test not available for random effects

#########################################
#########################################
Model:  Verrucomicrobia ~ 1 + intB + time + (1 | SubjectID)
<environment: 0x0000000049981218>

Link:    poisson


Intraclass Correlation (ICC):   0.8508851

Fixed Effects (change in log)

                    Outcome Estimate Std. Error z value Pr(>|z|)
(Intercept) Verrucomicrobia  3.83630    0.99216 3.86662  0.00011
intB        Verrucomicrobia  1.44885    1.45824 0.99356  0.32044
time        Verrucomicrobia  0.00500    0.00920 0.54381  0.58657


Random Effects (SD on log scale)

 Groups    Name        Std.Dev.
 SubjectID (Intercept) 2.3888

Significance test not available for random effects
phylum.fit4b <- glmm_microbiome(mydata=microbiome_data,model.number=4,
taxa.level="Phylum", link="negbinom",
model="1 + intB + time + (1|SubjectID)")
#########################################
#########################################
Model:  Actinobacteria ~ 1 + intB + time + (1 | SubjectID)
<environment: 0x000000003131b0a8>

Link:    negbinom


Intraclass Correlation (ICC):   0.3000096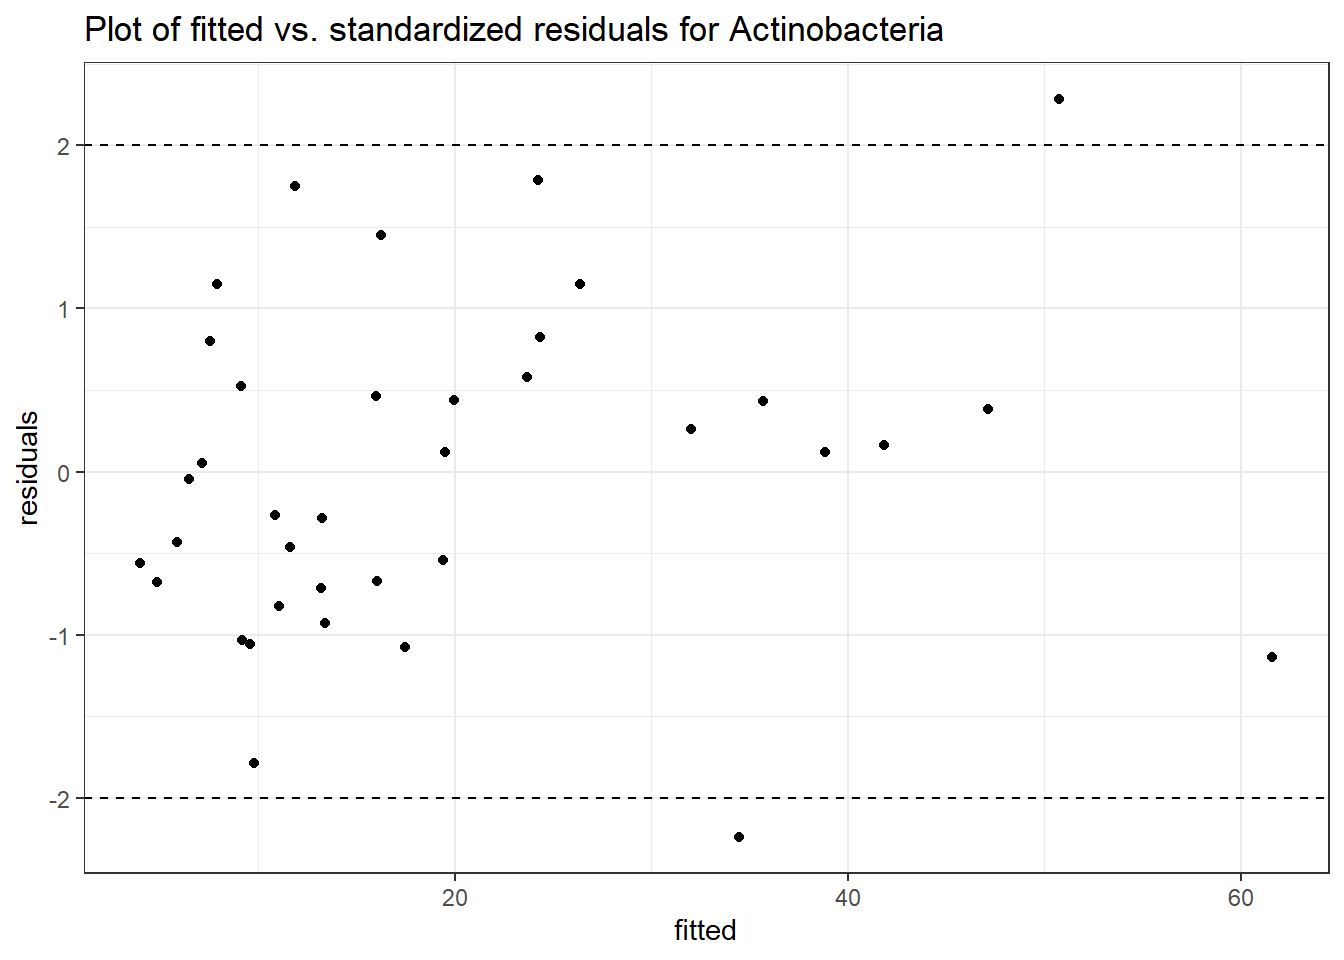
Fixed Effects (change in log)

                   Outcome Estimate Std. Error z value Pr(>|z|)
(Intercept) Actinobacteria  2.12141    0.46053 4.60642  0.00000
intB        Actinobacteria  0.87112    0.56308 1.54706  0.12185
time        Actinobacteria  0.19350    0.18685 1.03558  0.30040


Random Effects (SD on log scale)

 Groups    Name        Std.Dev.
 SubjectID (Intercept) 0.65467

Significance test not available for random effects

#########################################
#########################################
Model:  Bacteroidetes ~ 1 + intB + time + (1 | SubjectID)
<environment: 0x000000003131b0a8>

Link:    negbinom


Intraclass Correlation (ICC):   0.1360569
Fixed Effects (change in log)

                  Outcome Estimate Std. Error  z value Pr(>|z|)
(Intercept) Bacteroidetes  8.15117    0.17650 46.18176  0.00000
intB        Bacteroidetes -0.23442    0.25640 -0.91426  0.36058
time        Bacteroidetes -0.04643    0.03469 -1.33847  0.18074


Random Effects (SD on log scale)

 Groups    Name        Std.Dev.
 SubjectID (Intercept) 0.39684

Significance test not available for random effects

#########################################
#########################################
Model:  Cyanobacteria ~ 1 + intB + time + (1 | SubjectID)
<environment: 0x000000003131b0a8>

Link:    negbinom
boundary (singular) fit: see ?isSingular
Intraclass Correlation (ICC): 6.414827e-14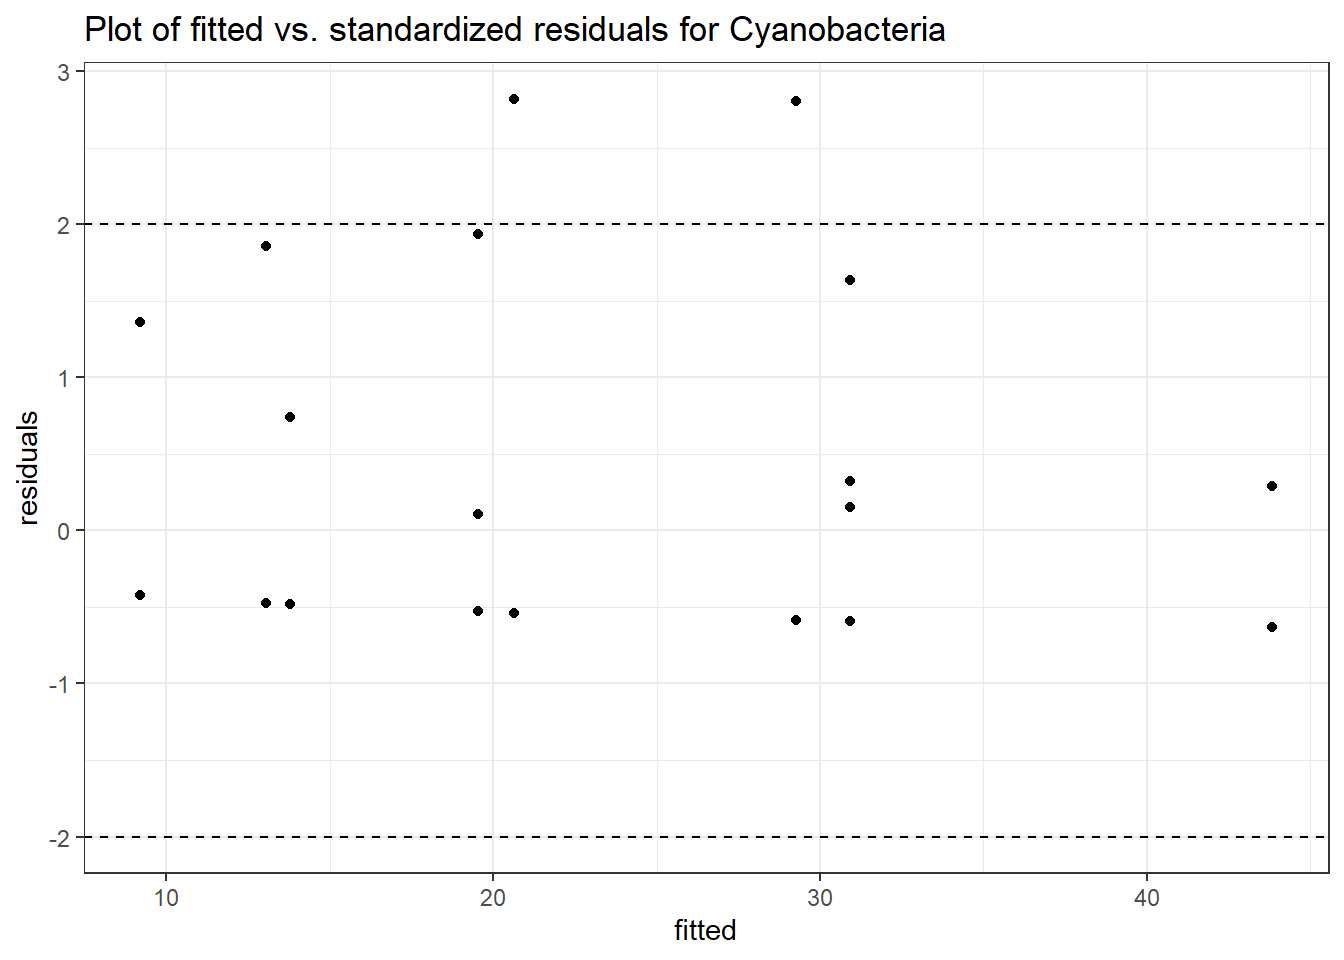
Fixed Effects (change in log)

                  Outcome Estimate Std. Error  z value Pr(>|z|)
(Intercept) Cyanobacteria  3.78059    1.61294  2.34392  0.01908
intB        Cyanobacteria -0.34917    1.41330 -0.24706  0.80486
time        Cyanobacteria -0.40424    0.81506 -0.49597  0.61992


Random Effects (SD on log scale)

 Groups    Name        Std.Dev.
 SubjectID (Intercept) 2.5328e-07

Significance test not available for random effects

#########################################
#########################################
Model:  Euryarchaeota ~ 1 + intB + time + (1 | SubjectID)
<environment: 0x000000003131b0a8>

Link:    negbinom
boundary (singular) fit: see ?isSingular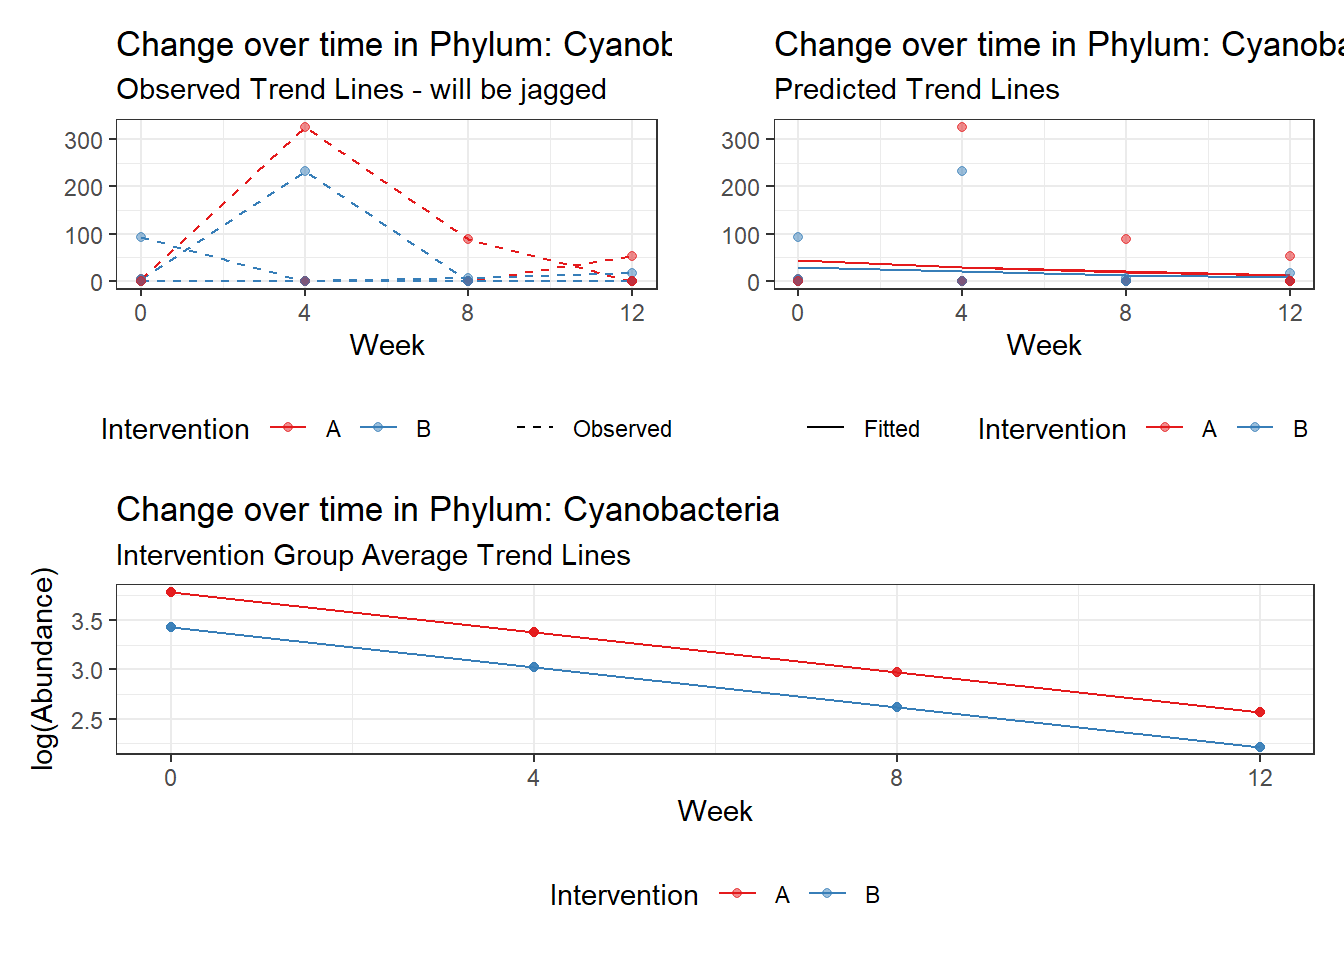
Intraclass Correlation (ICC): 3.391275e-13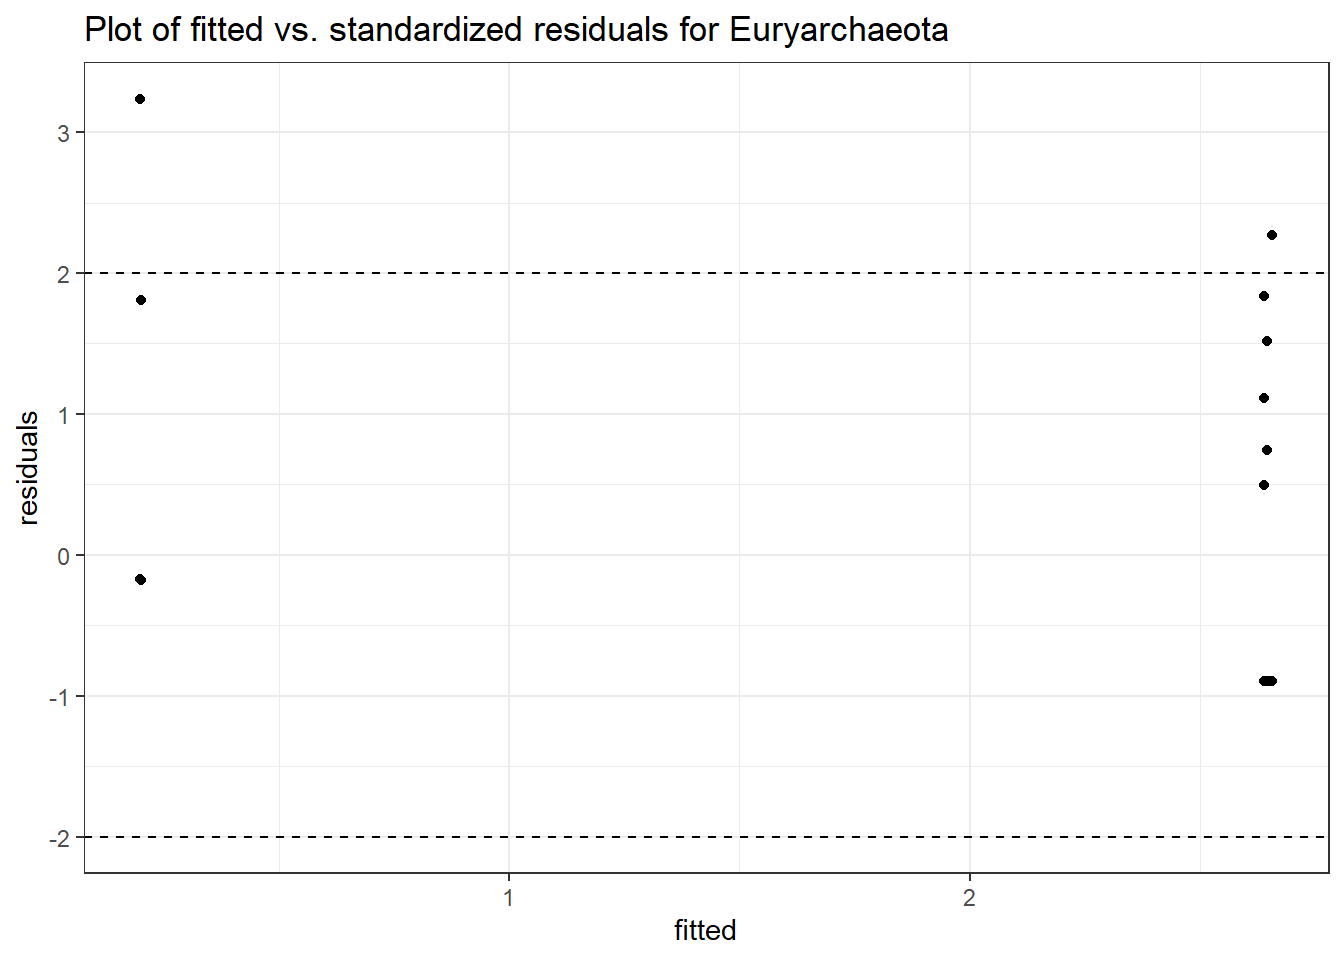

Fixed Effects (change in log)

                  Outcome Estimate Std. Error  z value Pr(>|z|)
(Intercept) Euryarchaeota -1.61269    0.96423 -1.67251  0.09442
intB        Euryarchaeota  2.58316    0.99611  2.59325  0.00951
time        Euryarchaeota  0.00226    0.41232  0.00548  0.99562


Random Effects (SD on log scale)

 Groups    Name        Std.Dev.
 SubjectID (Intercept) 5.8235e-07

Significance test not available for random effects

#########################################
#########################################
Model:  Firmicutes ~ 1 + intB + time + (1 | SubjectID)
<environment: 0x000000003131b0a8>

Link:    negbinom


Intraclass Correlation (ICC):   0.1178534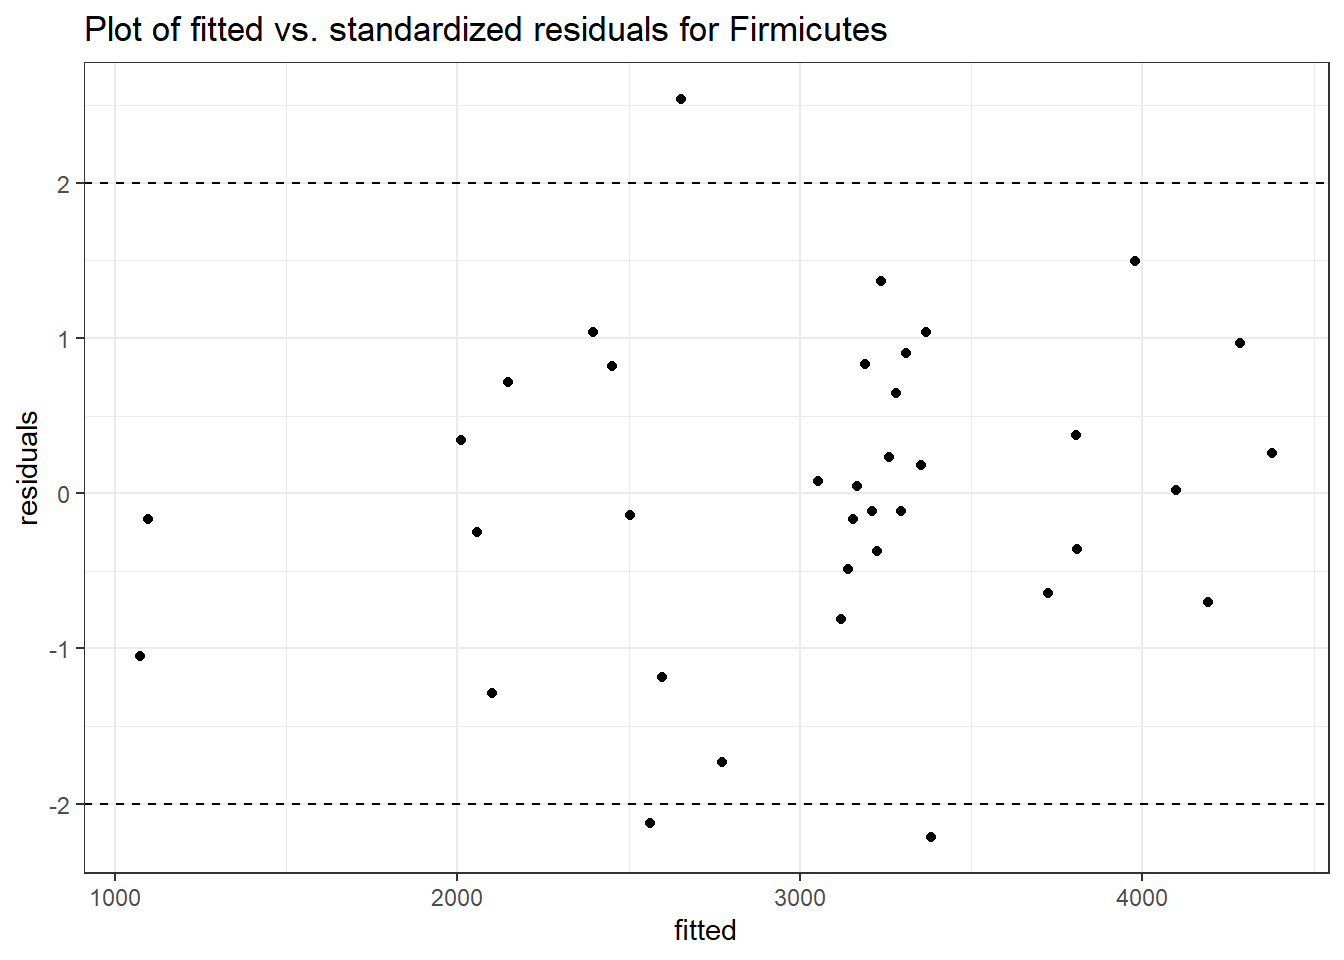
Fixed Effects (change in log)

               Outcome Estimate Std. Error  z value Pr(>|z|)
(Intercept) Firmicutes  7.86748    0.15694 50.13155  0.00000
intB        Firmicutes  0.13328    0.22878  0.58257  0.56018
time        Firmicutes  0.02203    0.02408  0.91491  0.36024


Random Effects (SD on log scale)

 Groups    Name        Std.Dev.
 SubjectID (Intercept) 0.36551

Significance test not available for random effects

#########################################
#########################################
Model:  Lentisphaerae ~ 1 + intB + time + (1 | SubjectID)
<environment: 0x000000003131b0a8>

Link:    negbinom
Warning in checkConv(attr(opt, "derivs"), opt$par, ctrl = control$checkConv, :
Model failed to converge with max|grad| = 0.0118533 (tol = 0.002, component 1)
Intraclass Correlation (ICC): 0.8141549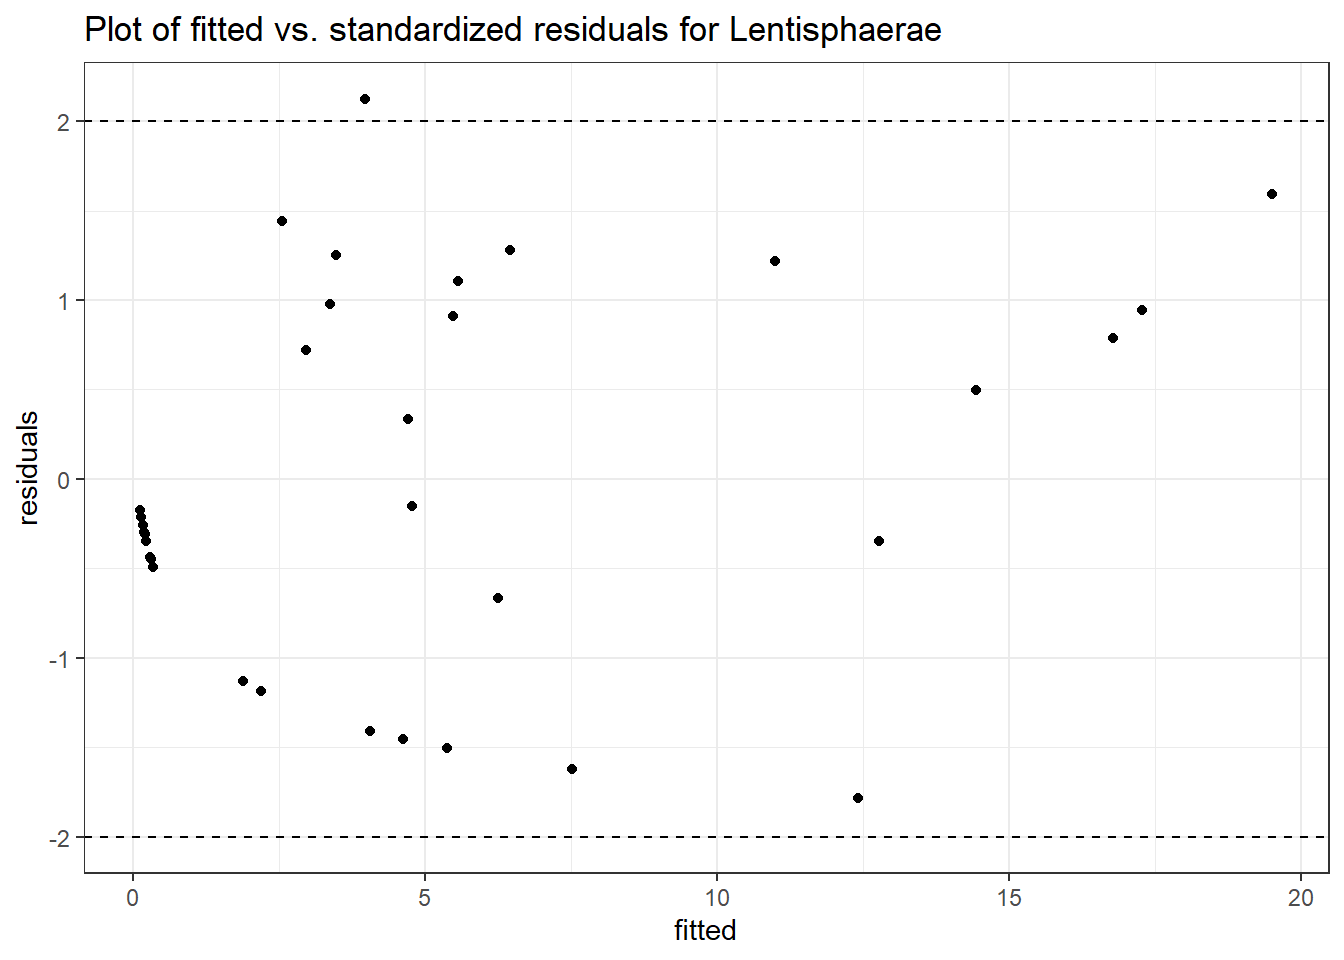
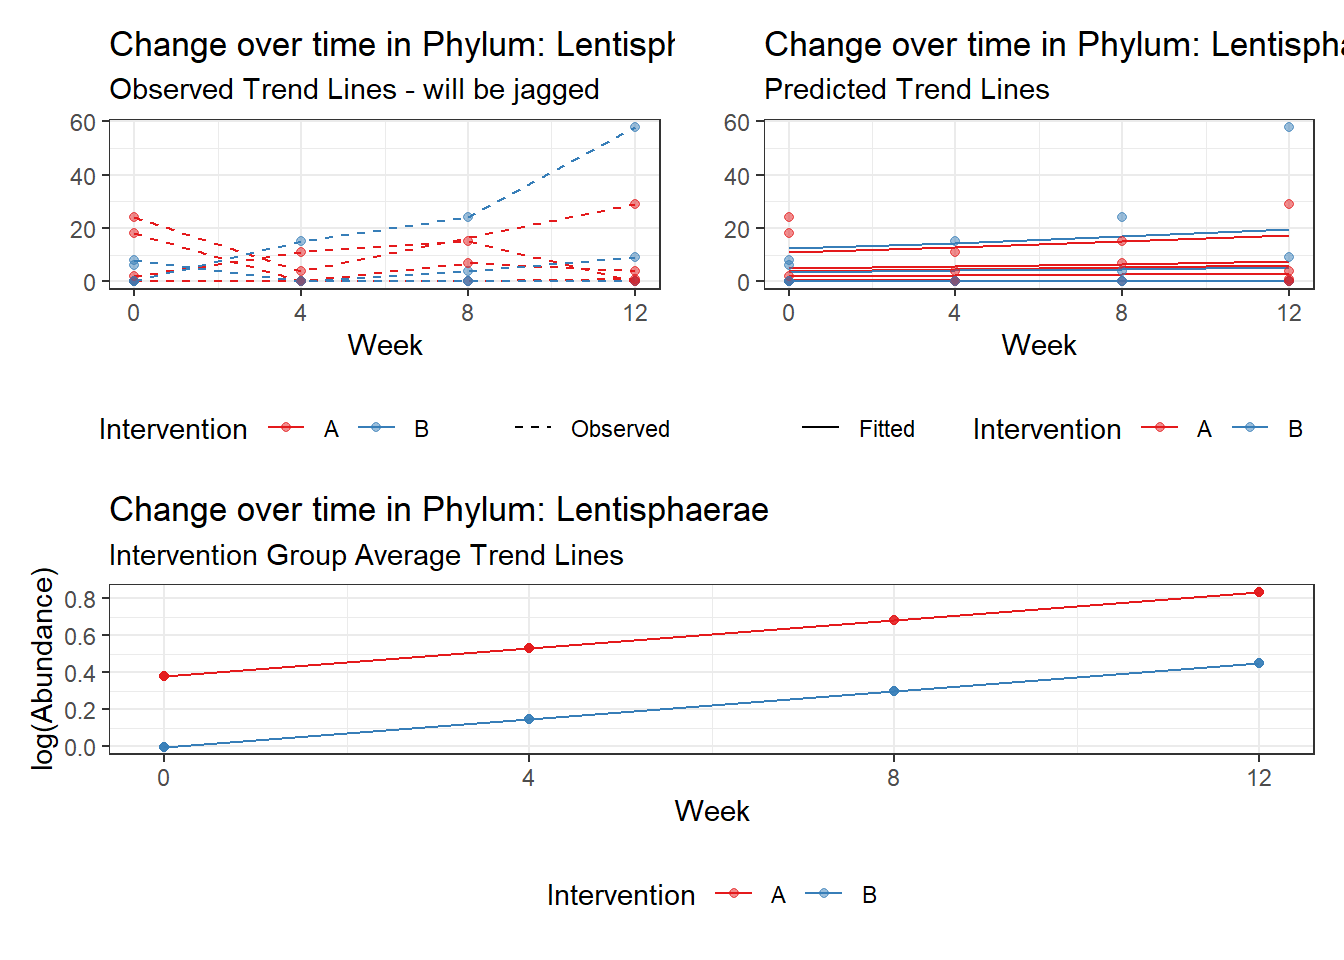
Fixed Effects (change in log)

                  Outcome Estimate Std. Error  z value Pr(>|z|)
(Intercept) Lentisphaerae  0.38123    1.12249  0.33962  0.73414
intB        Lentisphaerae -0.38367    1.48971 -0.25755  0.79676
time        Lentisphaerae  0.15076    0.28310  0.53254  0.59435


Random Effects (SD on log scale)

 Groups    Name        Std.Dev.
 SubjectID (Intercept) 2.093

Significance test not available for random effects

#########################################
#########################################
Model:  Proteobacteria ~ 1 + intB + time + (1 | SubjectID)
<environment: 0x000000003131b0a8>

Link:    negbinom


Intraclass Correlation (ICC):   0.02306262
Fixed Effects (change in log)

                   Outcome Estimate Std. Error  z value Pr(>|z|)
(Intercept) Proteobacteria  5.89356    0.18279 32.24277  0.00000
intB        Proteobacteria -0.21404    0.22838 -0.93720  0.34866
time        Proteobacteria -0.04562    0.09209 -0.49541  0.62031


Random Effects (SD on log scale)

 Groups    Name        Std.Dev.
 SubjectID (Intercept) 0.15365

Significance test not available for random effects

#########################################
#########################################
Model:  Tenericutes ~ 1 + intB + time + (1 | SubjectID)
<environment: 0x000000003131b0a8>

Link:    negbinom
boundary (singular) fit: see ?isSingular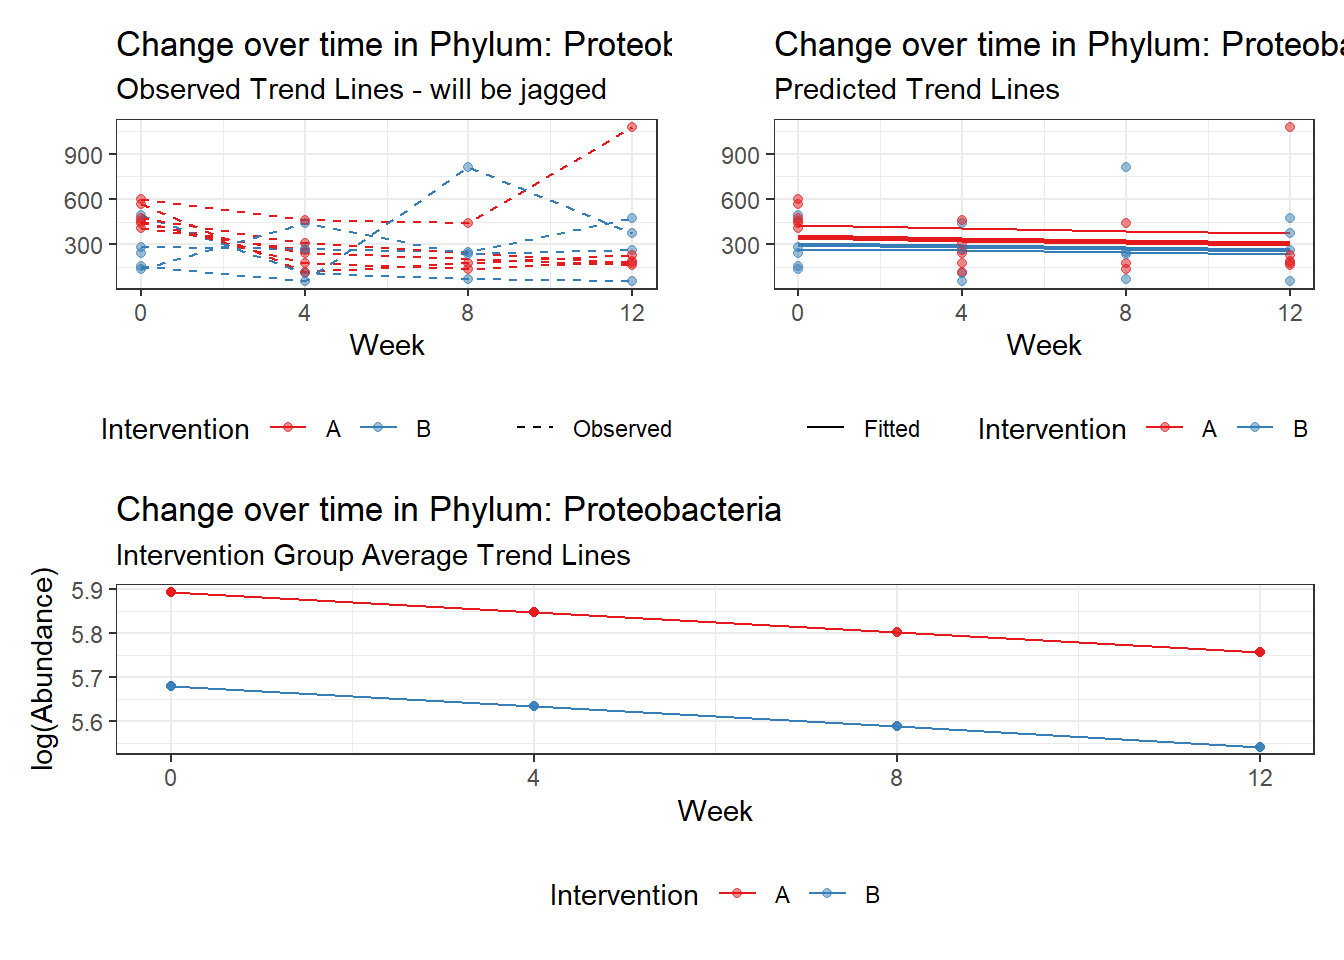
Intraclass Correlation (ICC): 2.145298e-11
Fixed Effects (change in log)

                Outcome Estimate Std. Error z value Pr(>|z|)
(Intercept) Tenericutes  2.56067    0.92499 2.76831  0.00563
intB        Tenericutes  0.02650    1.04348 0.02540  0.97974
time        Tenericutes  0.70752    0.45338 1.56054  0.11863


Random Effects (SD on log scale)

 Groups    Name        Std.Dev.
 SubjectID (Intercept) 4.6317e-06

Significance test not available for random effects

#########################################
#########################################
Model:  Verrucomicrobia ~ 1 + intB + time + (1 | SubjectID)
<environment: 0x000000003131b0a8>

Link:    negbinom
Warning in theta.ml(Y, mu, weights = object@resp$weights, limit = limit, :
iteration limit reachedWarning in sqrt(1/i): NaNs produced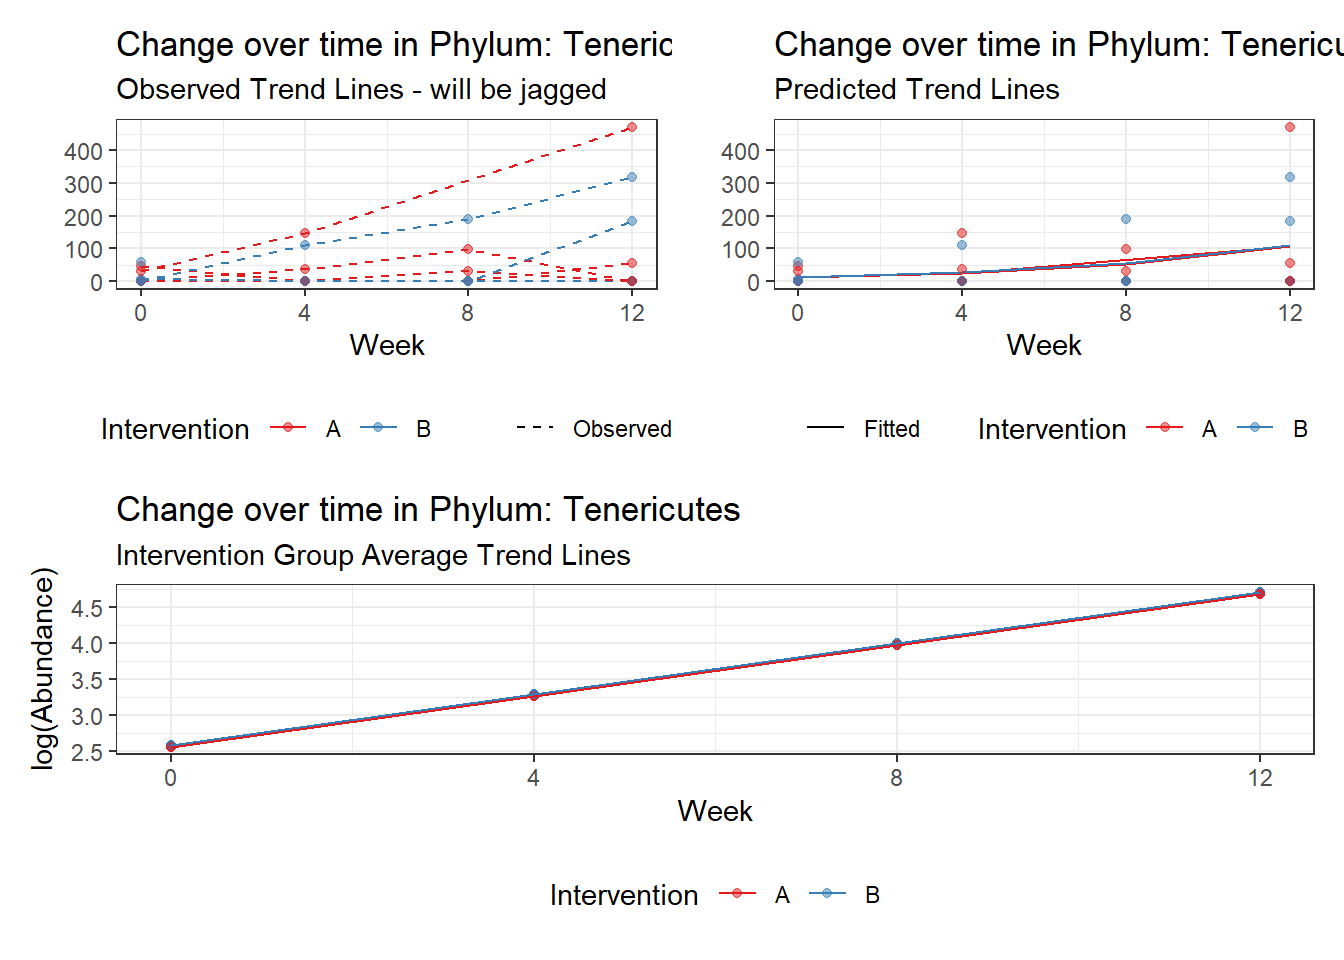
Intraclass Correlation (ICC): 0.8511595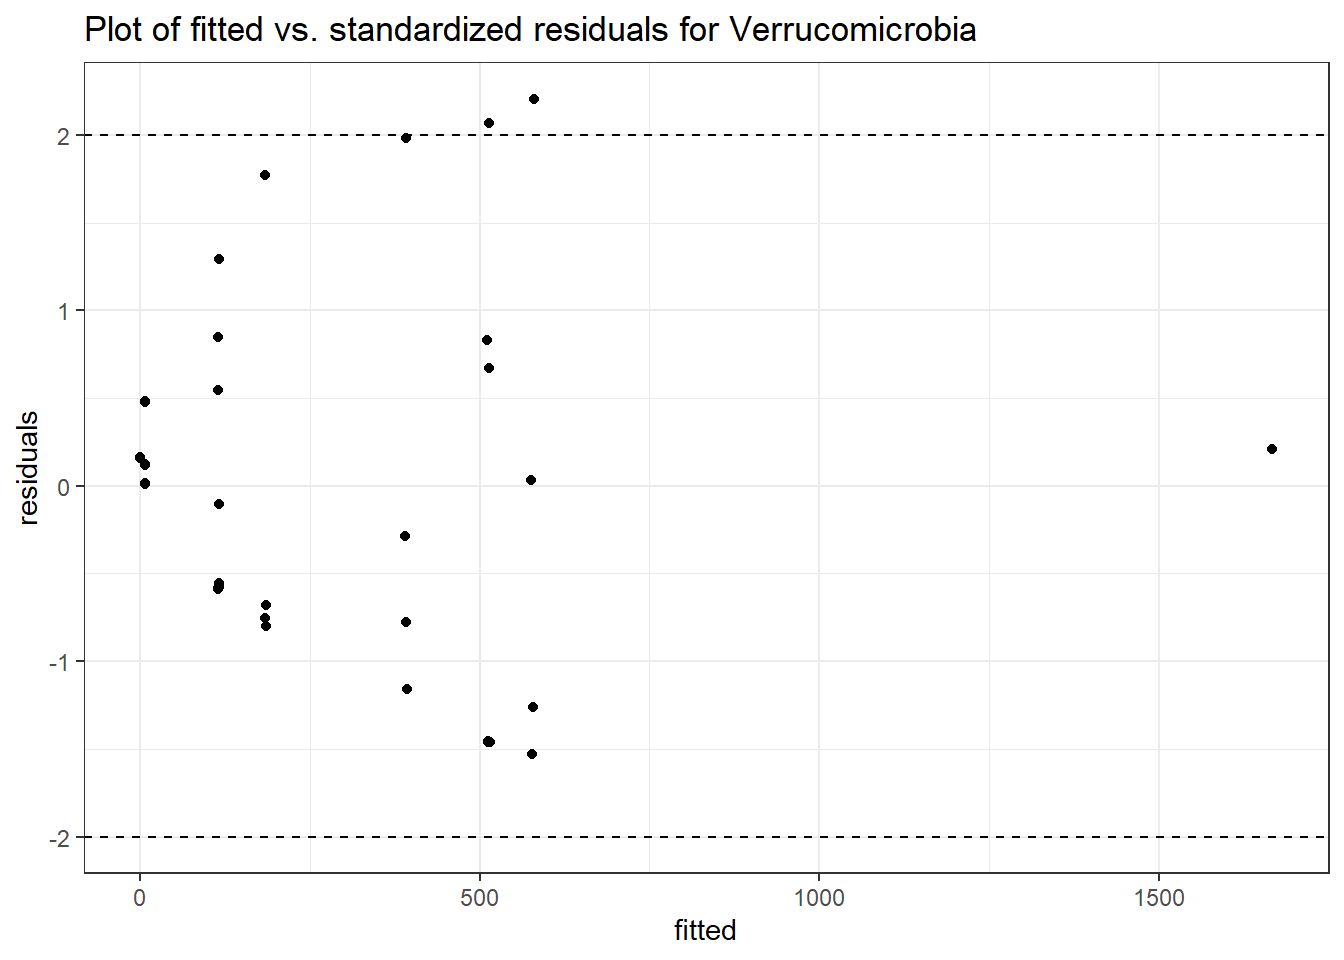
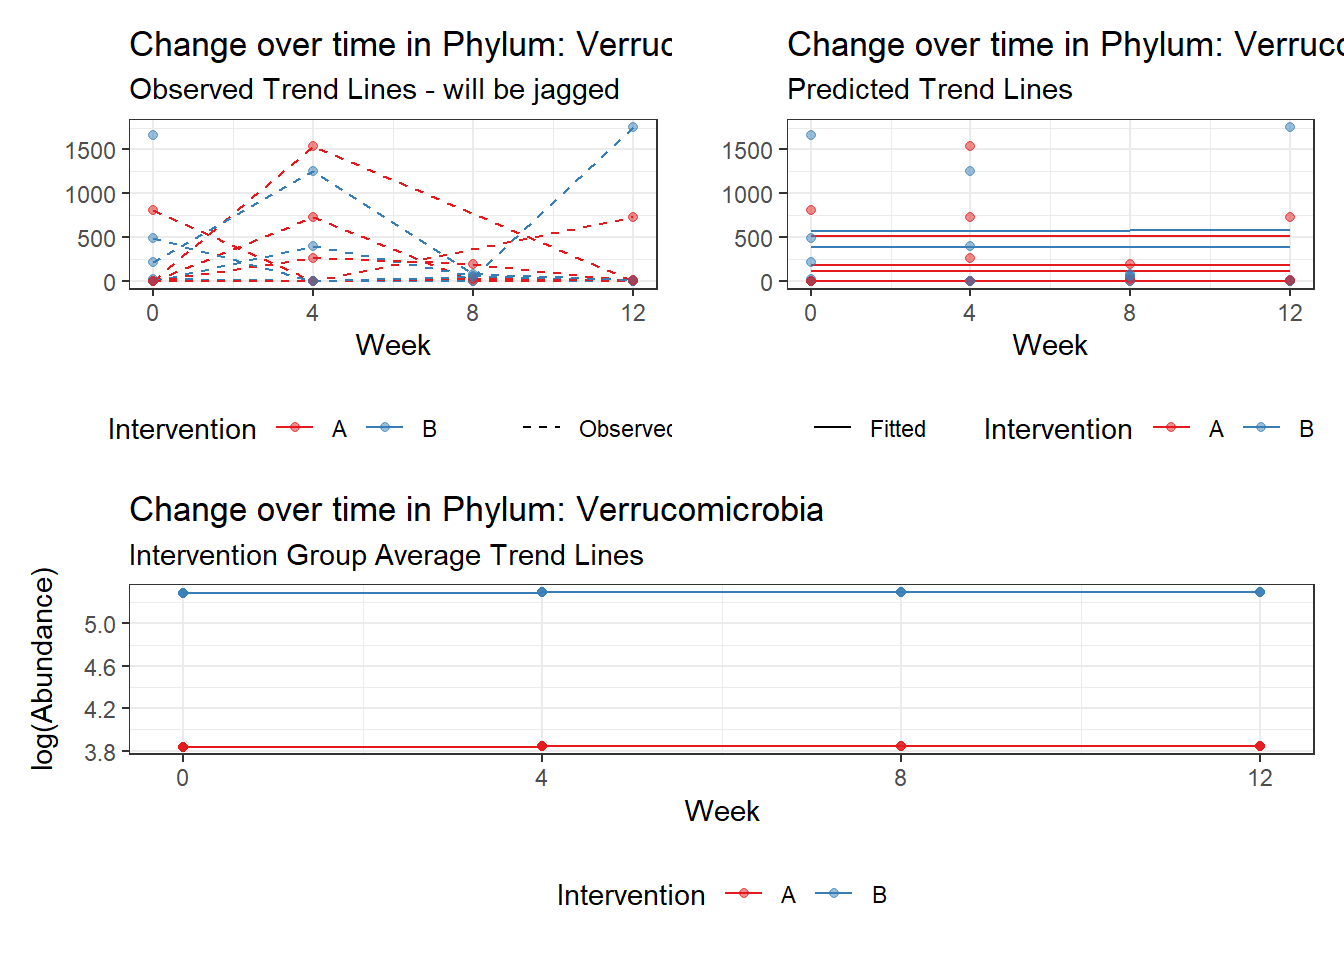
Fixed Effects (change in log)

                    Outcome Estimate Std. Error z value Pr(>|z|)
(Intercept) Verrucomicrobia  3.83782    0.99389 3.86142  0.00011
intB        Verrucomicrobia  1.45103    1.46178 0.99264  0.32088
time        Verrucomicrobia  0.00189    0.00938 0.20199  0.83993


Random Effects (SD on log scale)

 Groups    Name        Std.Dev.
 SubjectID (Intercept) 2.3914

Significance test not available for random effects
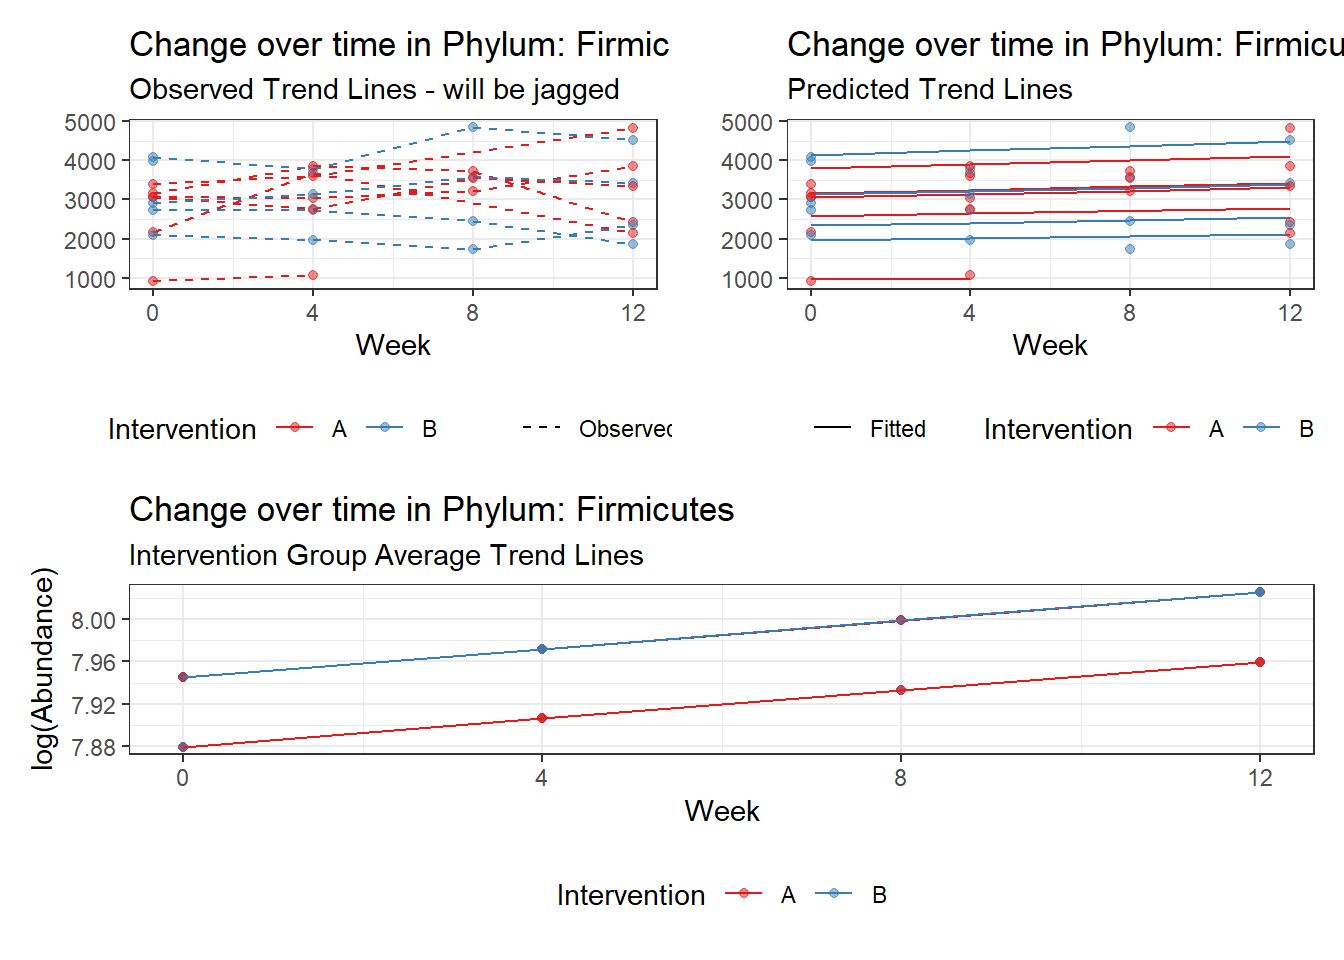
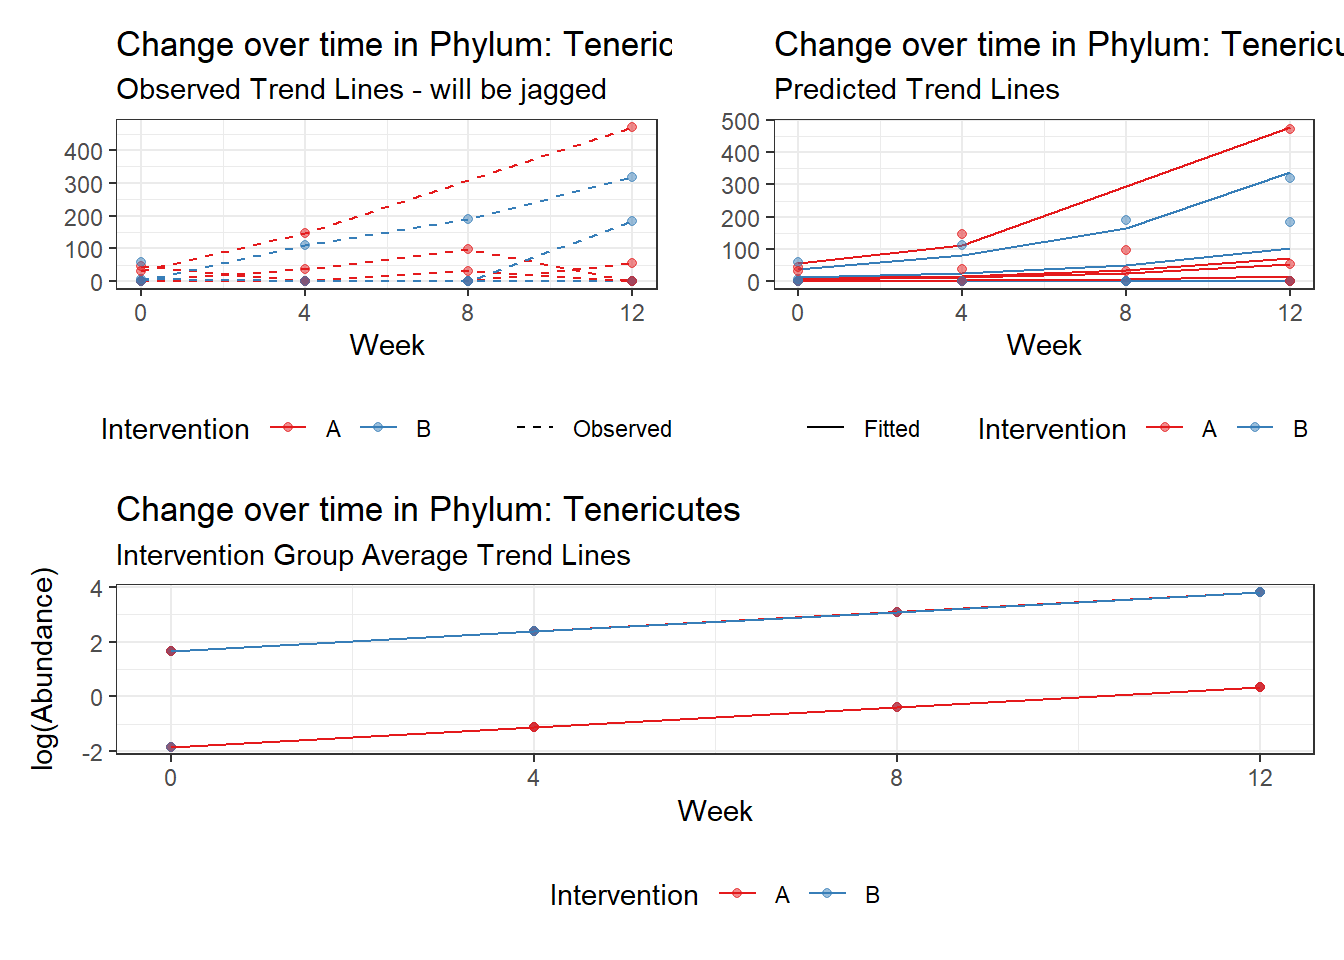
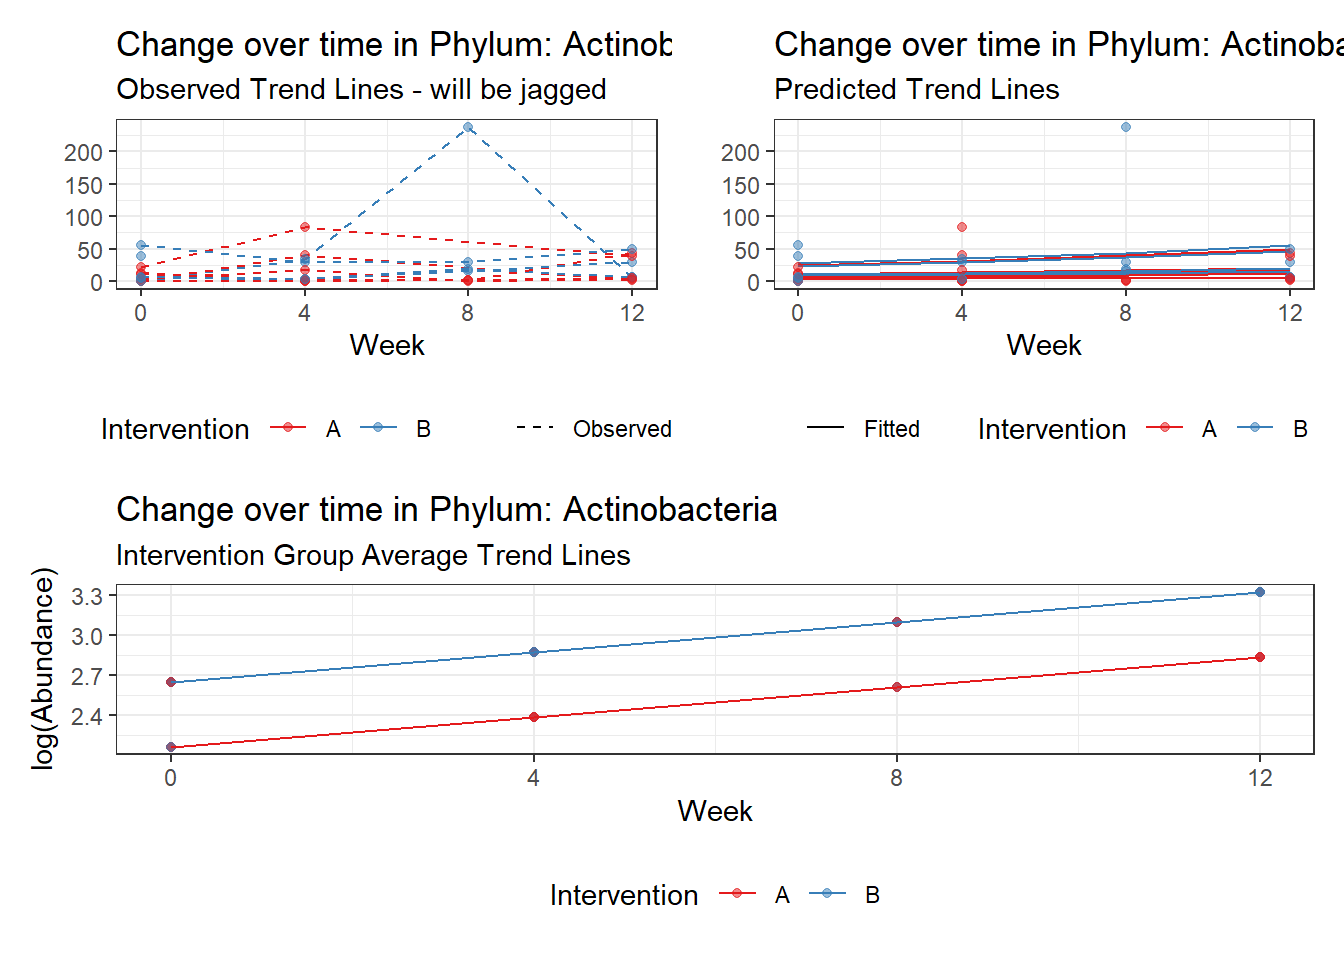
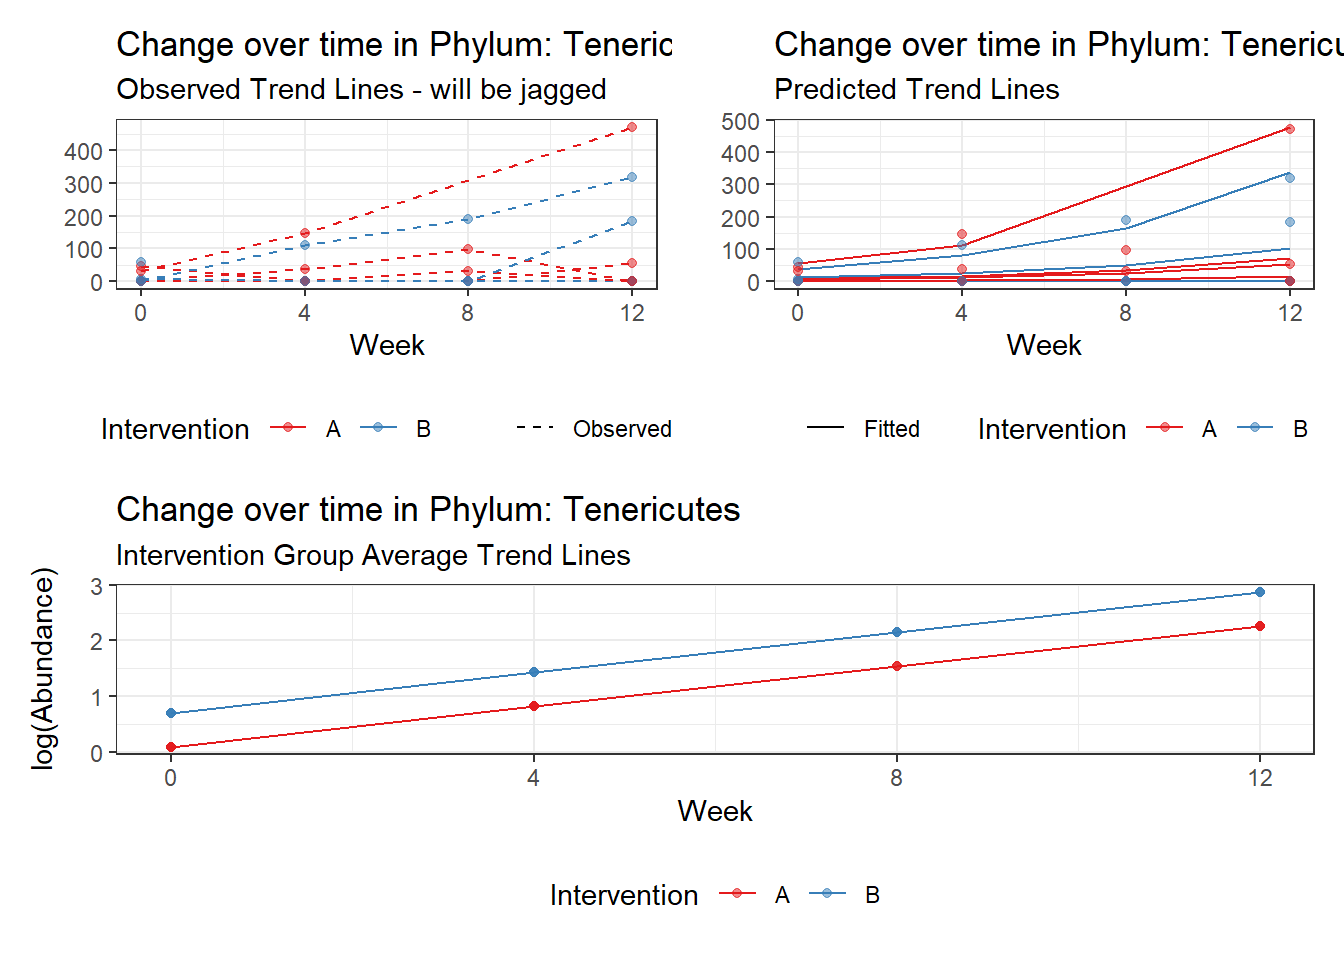
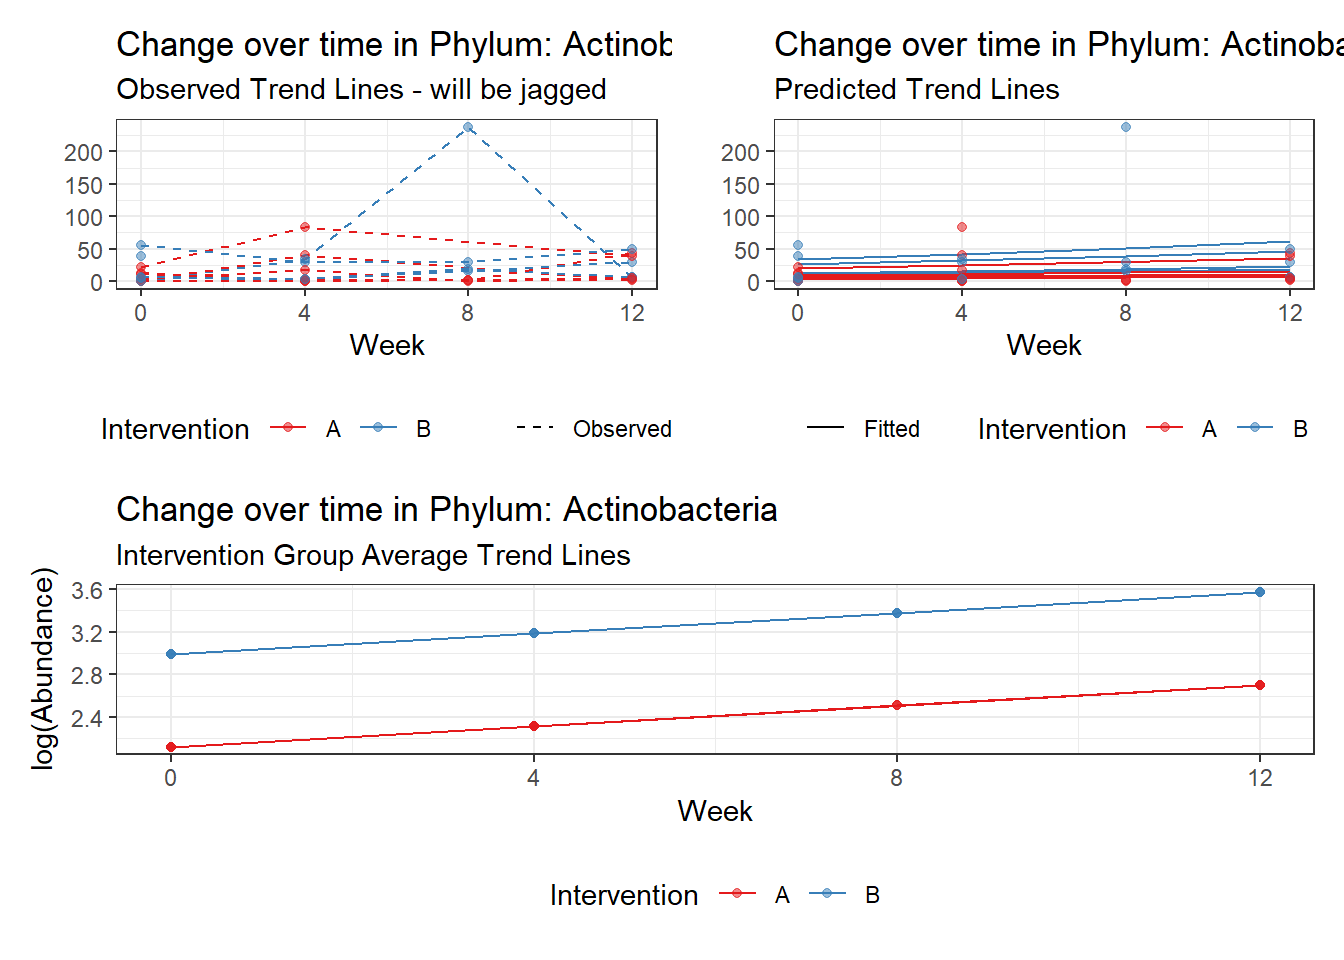
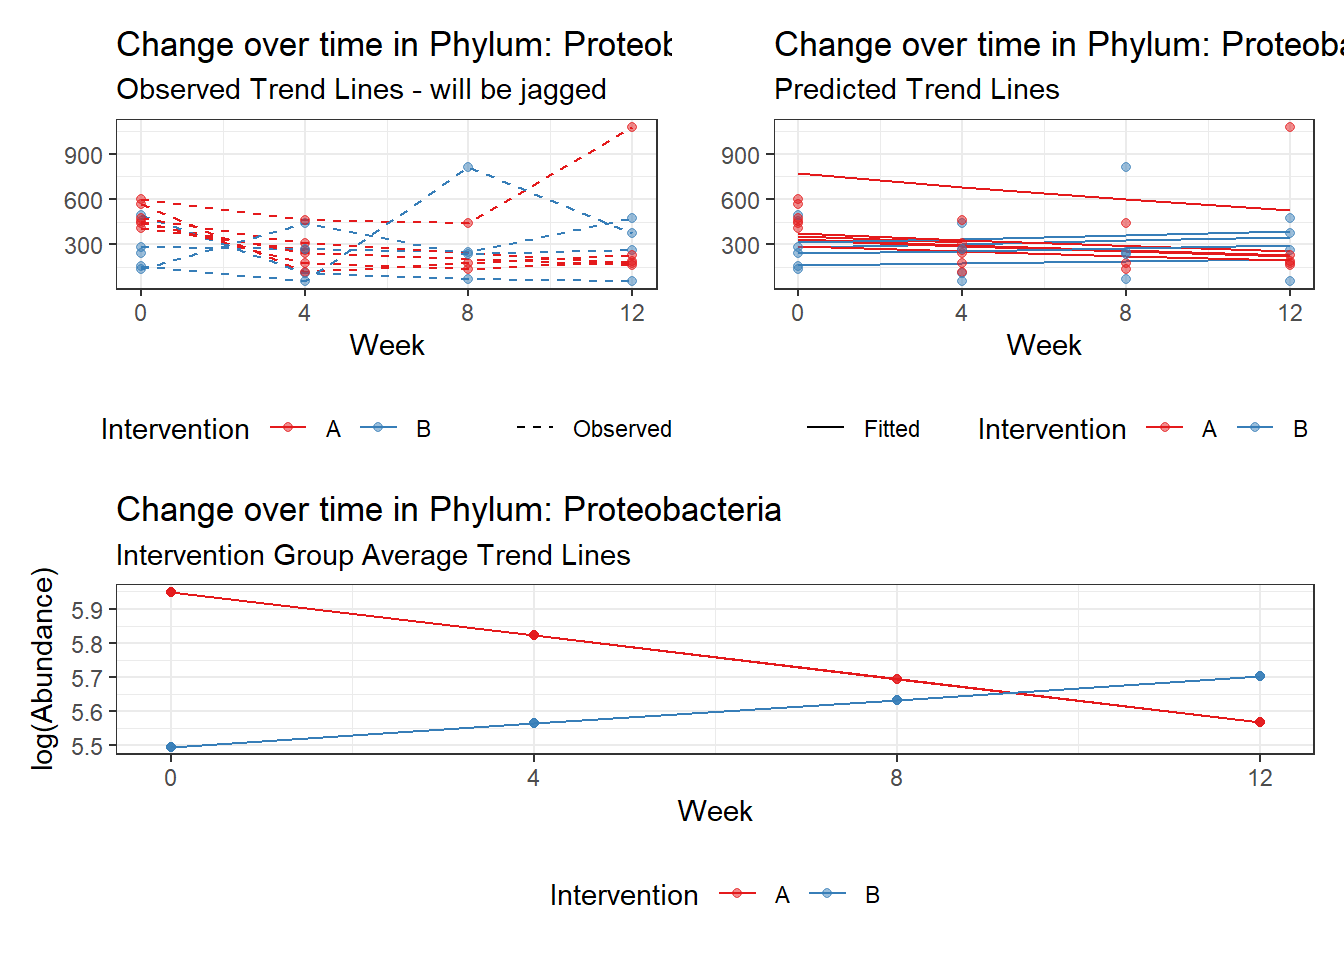
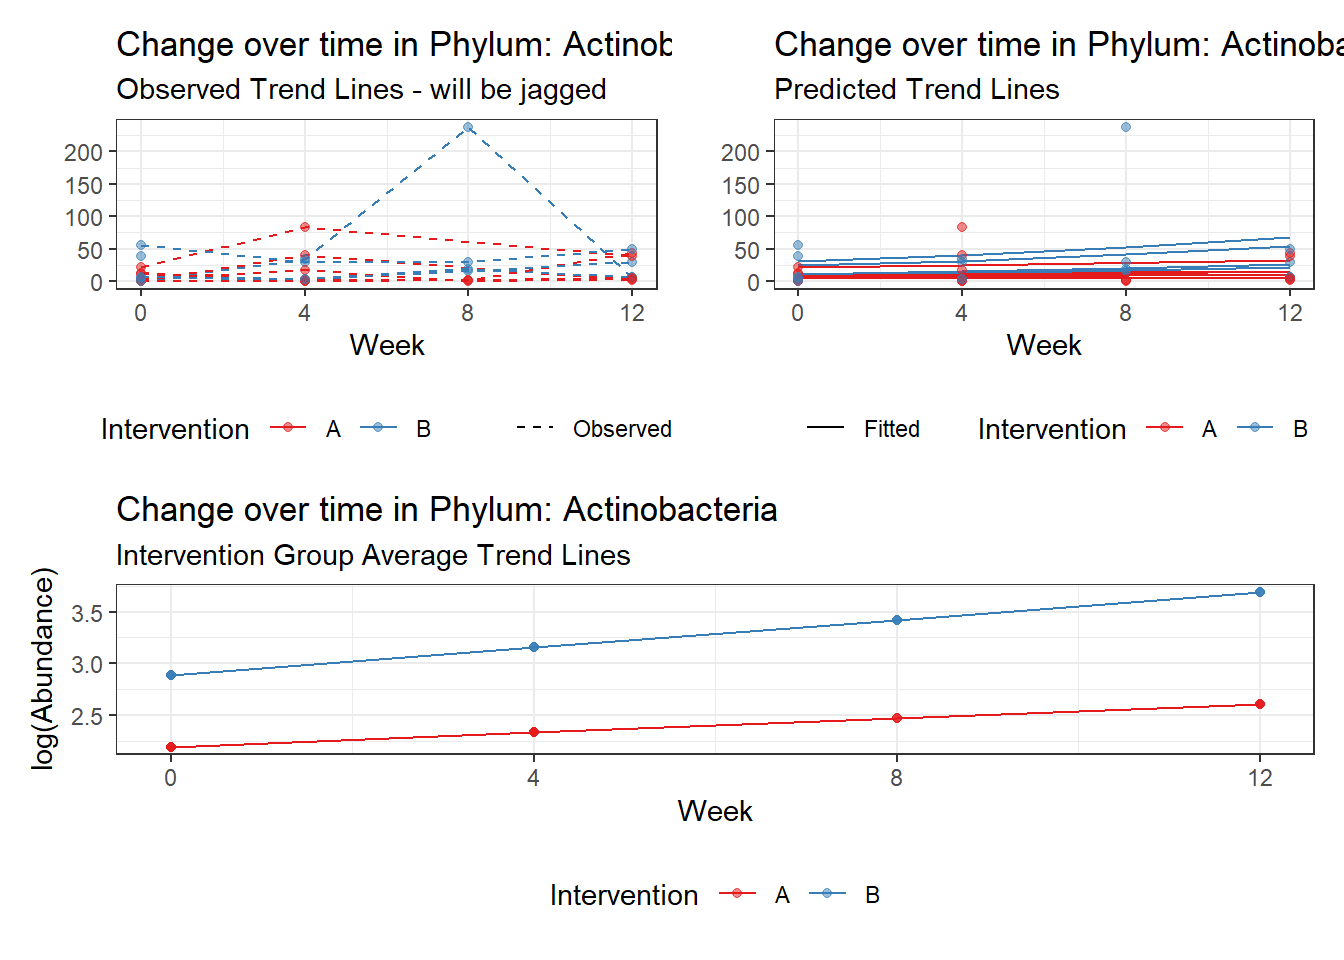
Controlling for the effect of time, the intervention resulted in a significant increase in abundance of Phylums: Euryarchaeota. This is in contrast to the effect of time, which was negatively associated with abundance. So, abundance of Euryarchaeota increased in intervention group B but not in group A.
Other interesting but not significant results. The effect of the intervention was in the opposite direction (positive) compared to the effect of time (negative) is Phylums: Actinobacteria, Firmicutes, Lentisphaerae, and Tenericutes.
Covariate(s): Time by intervention interaction
Here, the model tests whether the effect of the intervention is constant across time or does the effect of the intervention get stronger (or weaker) at time progress. And remember, time is coded 0, 1, 2, 3, so a 1 unit increase in time corresponds to 1 month or 4 weeks of the intervention.
\[\begin{align*} h\left(Y_{ij}\right)&=\beta_{0j} + \beta_{1j}(Week)_{ij} + r_{ij}\\ \beta_{0j}&= \gamma_{00} + \gamma_{01}(Intervention)_{j} + u_{0j}\\ \beta_{1j}&= \gamma_{10} + \gamma_{11}(Intervention)_{j}\\ \end{align*}\]
It could be that the intervention is directly related to time so included a average effect of time through the main effect effect is just adding more parameters and is not informative. If the effect of the intervention is still essentially zero, we will re-estimate the model without the main effect.
phylum.fit5 <- glmm_microbiome(mydata=microbiome_data,model.number=5,
                               taxa.level="Phylum", link="poisson",
                               model="1 + intB + time + intB:time + (1|SubjectID)")
#########################################
#########################################
Model:  Actinobacteria ~ 1 + intB + time + intB:time + (1 | SubjectID)
<environment: 0x0000000043de42d0>

Link:    poisson


Intraclass Correlation (ICC):   0.436752

Fixed Effects (change in log)

                   Outcome Estimate Std. Error z value Pr(>|z|)
(Intercept) Actinobacteria  2.17672    0.37536 5.79901  0.00000
intB        Actinobacteria  0.78150    0.54991 1.42113  0.15528
time        Actinobacteria  0.09795    0.04867 2.01258  0.04416
intB:time   Actinobacteria  0.13414    0.06271 2.13884  0.03245


Random Effects (SD on log scale)

 Groups    Name        Std.Dev.
 SubjectID (Intercept) 0.88058

Significance test not available for random effects

#########################################
#########################################
Model:  Bacteroidetes ~ 1 + intB + time + intB:time + (1 | SubjectID)
<environment: 0x0000000043de42d0>

Link:    poisson


Intraclass Correlation (ICC):   0.1703446

Fixed Effects (change in log)

                  Outcome Estimate Std. Error  z value Pr(>|z|)
(Intercept) Bacteroidetes  8.12428    0.18509 43.89474  0.00000
intB        Bacteroidetes -0.25420    0.27458 -0.92577  0.35456
time        Bacteroidetes -0.02187    0.00363 -6.02179  0.00000
intB:time   Bacteroidetes -0.02236    0.00532 -4.20690  0.00003


Random Effects (SD on log scale)

 Groups    Name        Std.Dev.
 SubjectID (Intercept) 0.45312

Significance test not available for random effects

#########################################
#########################################
Model:  Cyanobacteria ~ 1 + intB + time + intB:time + (1 | SubjectID)
<environment: 0x0000000043de42d0>

Link:    poisson


Intraclass Correlation (ICC):   0.9437787

Fixed Effects (change in log)

                  Outcome Estimate Std. Error  z value Pr(>|z|)
(Intercept) Cyanobacteria -1.65226    2.22499 -0.74259  0.45773
intB        Cyanobacteria  1.82089    2.84741  0.63949  0.52250
time        Cyanobacteria -0.07461    0.04114 -1.81363  0.06973
intB:time   Cyanobacteria -0.49582    0.06785 -7.30780  0.00000


Random Effects (SD on log scale)

 Groups    Name        Std.Dev.
 SubjectID (Intercept) 4.0972

Significance test not available for random effects

#########################################
#########################################
Model:  Euryarchaeota ~ 1 + intB + time + intB:time + (1 | SubjectID)
<environment: 0x0000000043de42d0>

Link:    poisson


Intraclass Correlation (ICC):   0.6283401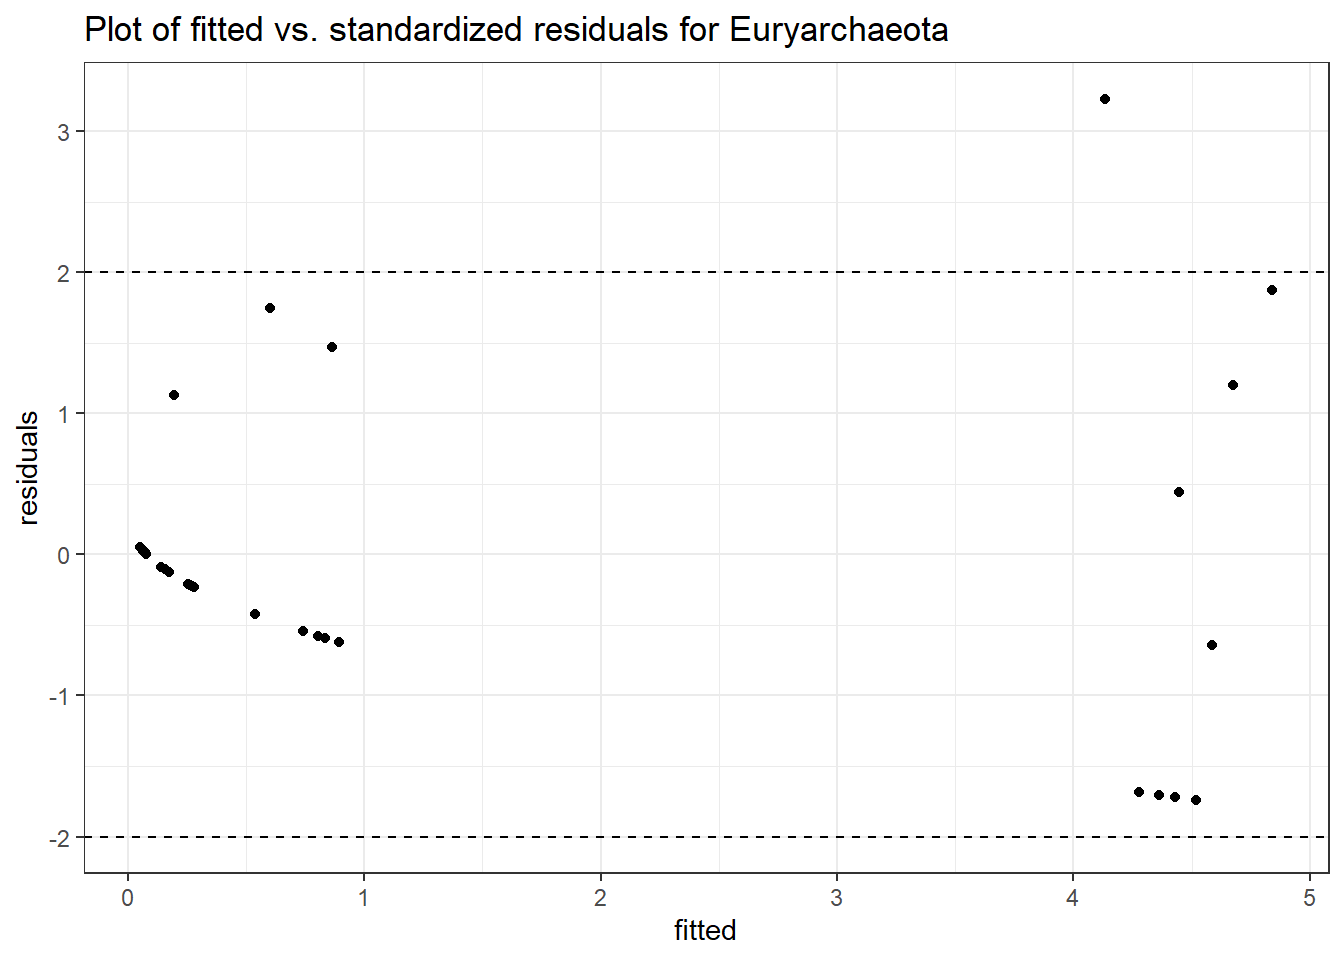

Fixed Effects (change in log)

                  Outcome Estimate Std. Error  z value Pr(>|z|)
(Intercept) Euryarchaeota -2.50184    1.11847 -2.23684  0.02530
intB        Euryarchaeota  3.05713    1.24510  2.45533  0.01408
time        Euryarchaeota  0.10681    0.41712  0.25607  0.79790
intB:time   Euryarchaeota -0.14146    0.43994 -0.32153  0.74781


Random Effects (SD on log scale)

 Groups    Name        Std.Dev.
 SubjectID (Intercept) 1.3002

Significance test not available for random effects

#########################################
#########################################
Model:  Firmicutes ~ 1 + intB + time + intB:time + (1 | SubjectID)
<environment: 0x0000000043de42d0>

Link:    poisson


Intraclass Correlation (ICC):   0.1267112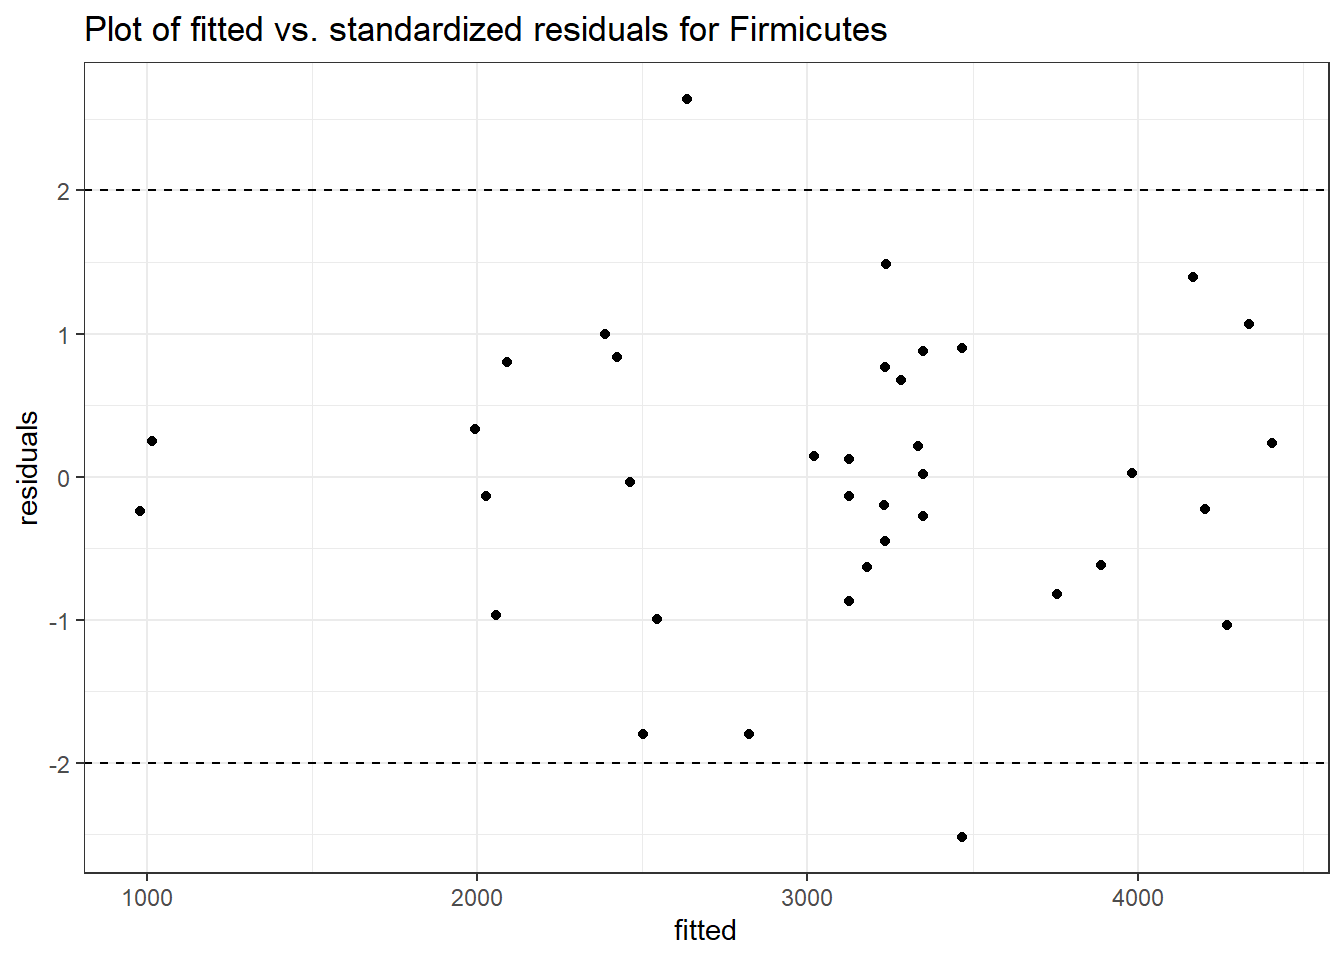

Fixed Effects (change in log)

               Outcome Estimate Std. Error  z value Pr(>|z|)
(Intercept) Firmicutes  7.84451    0.15566 50.39470  0.00000
intB        Firmicutes  0.17010    0.23087  0.73679  0.46125
time        Firmicutes  0.03463    0.00352  9.83067  0.00000
intB:time   Firmicutes -0.01883    0.00539 -3.49576  0.00047


Random Effects (SD on log scale)

 Groups    Name        Std.Dev.
 SubjectID (Intercept) 0.38092

Significance test not available for random effects

#########################################
#########################################
Model:  Lentisphaerae ~ 1 + intB + time + intB:time + (1 | SubjectID)
<environment: 0x0000000043de42d0>

Link:    poisson


Intraclass Correlation (ICC):   0.8722509

Fixed Effects (change in log)

                  Outcome Estimate Std. Error  z value Pr(>|z|)
(Intercept) Lentisphaerae  0.33280    1.19692  0.27805  0.78097
intB        Lentisphaerae -1.36502    1.72220 -0.79260  0.42801
time        Lentisphaerae -0.00972    0.07896 -0.12315  0.90199
intB:time   Lentisphaerae  0.73924    0.12791  5.77923  0.00000


Random Effects (SD on log scale)

 Groups    Name        Std.Dev.
 SubjectID (Intercept) 2.613

Significance test not available for random effects

#########################################
#########################################
Model:  Proteobacteria ~ 1 + intB + time + intB:time + (1 | SubjectID)
<environment: 0x0000000043de42d0>

Link:    poisson


Intraclass Correlation (ICC):   0.07355022
Fixed Effects (change in log)

                   Outcome Estimate Std. Error   z value Pr(>|z|)
(Intercept) Proteobacteria  5.94829    0.11641  51.09812  0.00000
intB        Proteobacteria -0.45370    0.17331  -2.61791  0.00885
time        Proteobacteria -0.12701    0.01087 -11.68390  0.00000
intB:time   Proteobacteria  0.19592    0.01725  11.35999  0.00000


Random Effects (SD on log scale)

 Groups    Name        Std.Dev.
 SubjectID (Intercept) 0.28176

Significance test not available for random effects

#########################################
#########################################
Model:  Tenericutes ~ 1 + intB + time + intB:time + (1 | SubjectID)
<environment: 0x0000000043de42d0>

Link:    poisson


Intraclass Correlation (ICC):   0.9207144
Fixed Effects (change in log)

                Outcome Estimate Std. Error  z value Pr(>|z|)
(Intercept) Tenericutes  0.34347    1.45013  0.23685  0.81277
intB        Tenericutes -0.09897    2.12036 -0.04668  0.96277
time        Tenericutes  0.58336    0.03024 19.28914  0.00000
intB:time   Tenericutes  0.37119    0.05296  7.00871  0.00000


Random Effects (SD on log scale)

 Groups    Name        Std.Dev.
 SubjectID (Intercept) 3.4077

Significance test not available for random effects

#########################################
#########################################
Model:  Verrucomicrobia ~ 1 + intB + time + intB:time + (1 | SubjectID)
<environment: 0x0000000043de42d0>

Link:    poisson


Intraclass Correlation (ICC):   0.8554283
Fixed Effects (change in log)

                    Outcome Estimate Std. Error  z value Pr(>|z|)
(Intercept) Verrucomicrobia  3.98707    1.00988  3.94807  0.00008
intB        Verrucomicrobia  1.11249    1.48508  0.74911  0.45379
time        Verrucomicrobia -0.12308    0.01296 -9.49425  0.00000
intB:time   Verrucomicrobia  0.27329    0.01883 14.51628  0.00000


Random Effects (SD on log scale)

 Groups    Name        Std.Dev.
 SubjectID (Intercept) 2.4325

Significance test not available for random effects
phylum.fit5b <- glmm_microbiome(mydata=microbiome_data,model.number=5,
taxa.level="Phylum", link="negbinom",
model="1 + intB + time + intB:time + (1|SubjectID)")
#########################################
#########################################
Model:  Actinobacteria ~ 1 + intB + time + intB:time + (1 | SubjectID)
<environment: 0x000000004aef09d0>

Link:    negbinom


Intraclass Correlation (ICC):   0.3032304
Fixed Effects (change in log)

                   Outcome Estimate Std. Error z value Pr(>|z|)
(Intercept) Actinobacteria  2.19349    0.51139 4.28922  0.00002
intB        Actinobacteria  0.69673    0.75295 0.92533  0.35480
time        Actinobacteria  0.13647    0.24738 0.55168  0.58117
intB:time   Actinobacteria  0.12973    0.37276 0.34802  0.72782


Random Effects (SD on log scale)

 Groups    Name        Std.Dev.
 SubjectID (Intercept) 0.65969

Significance test not available for random effects

#########################################
#########################################
Model:  Bacteroidetes ~ 1 + intB + time + intB:time + (1 | SubjectID)
<environment: 0x000000004aef09d0>

Link:    negbinom


Intraclass Correlation (ICC):   0.1379942
Fixed Effects (change in log)

                  Outcome Estimate Std. Error  z value Pr(>|z|)
(Intercept) Bacteroidetes  8.14348    0.18180 44.79293  0.00000
intB        Bacteroidetes -0.21784    0.27192 -0.80113  0.42305
time        Bacteroidetes -0.04041    0.04609 -0.87681  0.38059
intB:time   Bacteroidetes -0.01395    0.07007 -0.19911  0.84218


Random Effects (SD on log scale)

 Groups    Name        Std.Dev.
 SubjectID (Intercept) 0.40011

Significance test not available for random effects

#########################################
#########################################
Model:  Cyanobacteria ~ 1 + intB + time + intB:time + (1 | SubjectID)
<environment: 0x000000004aef09d0>

Link:    negbinom
Warning in theta.ml(Y, mu, weights = object@resp$weights, limit = limit, :
iteration limit reachedWarning in sqrt(1/i): NaNs produced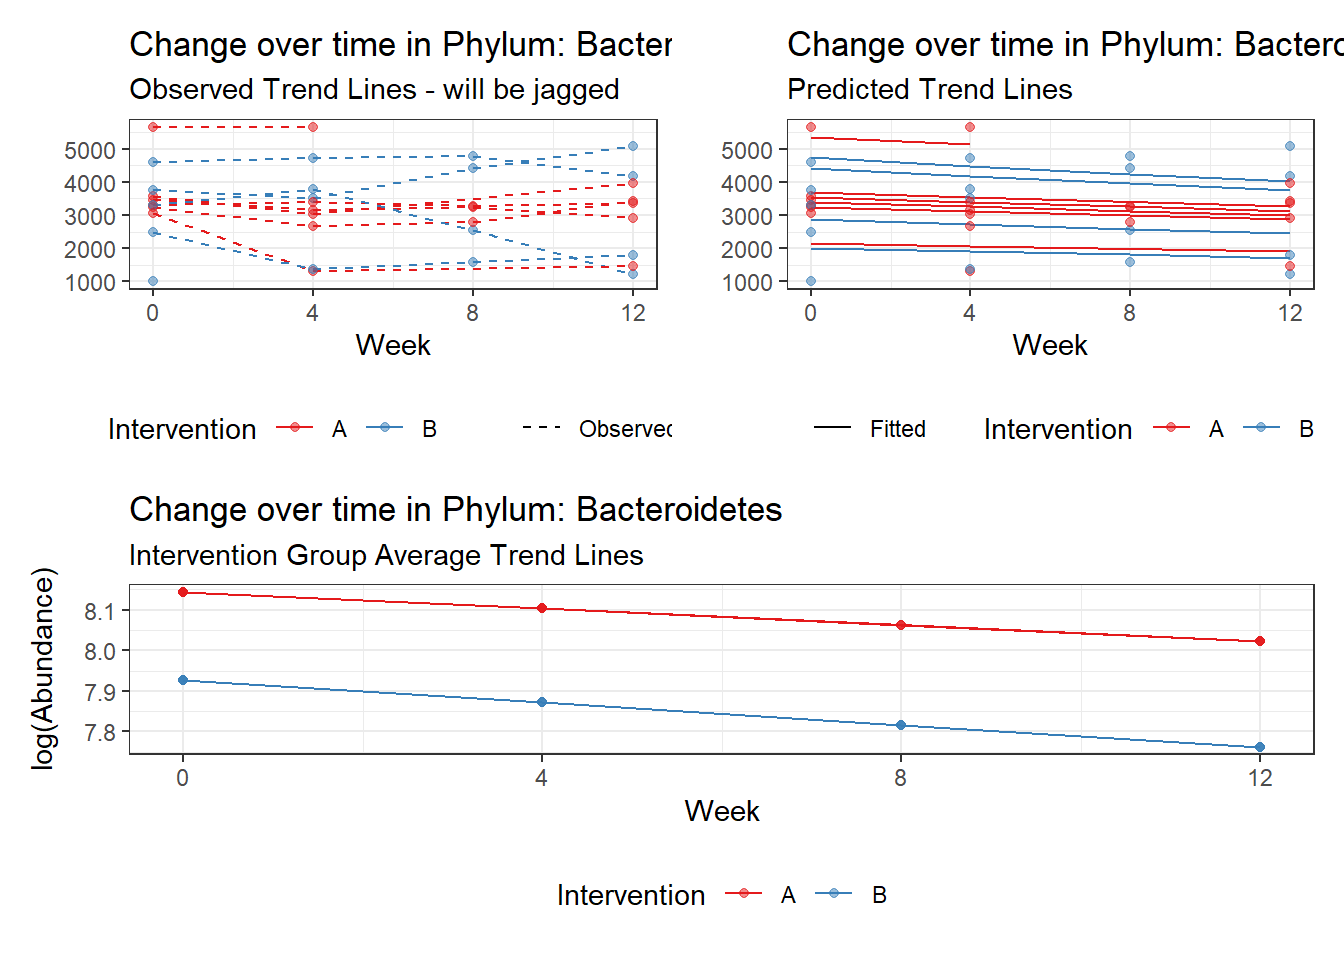
Intraclass Correlation (ICC): 0.9443394
Fixed Effects (change in log)

                  Outcome Estimate Std. Error  z value Pr(>|z|)
(Intercept) Cyanobacteria -1.69265    2.28381 -0.74115  0.45860
intB        Cyanobacteria  1.85125    2.85158  0.64920  0.51621
time        Cyanobacteria -0.07222    0.04213 -1.71399  0.08653
intB:time   Cyanobacteria -0.50485    0.06903 -7.31379  0.00000


Random Effects (SD on log scale)

 Groups    Name        Std.Dev.
 SubjectID (Intercept) 4.119

Significance test not available for random effects

#########################################
#########################################
Model:  Euryarchaeota ~ 1 + intB + time + intB:time + (1 | SubjectID)
<environment: 0x000000004aef09d0>

Link:    negbinom
boundary (singular) fit: see ?isSingular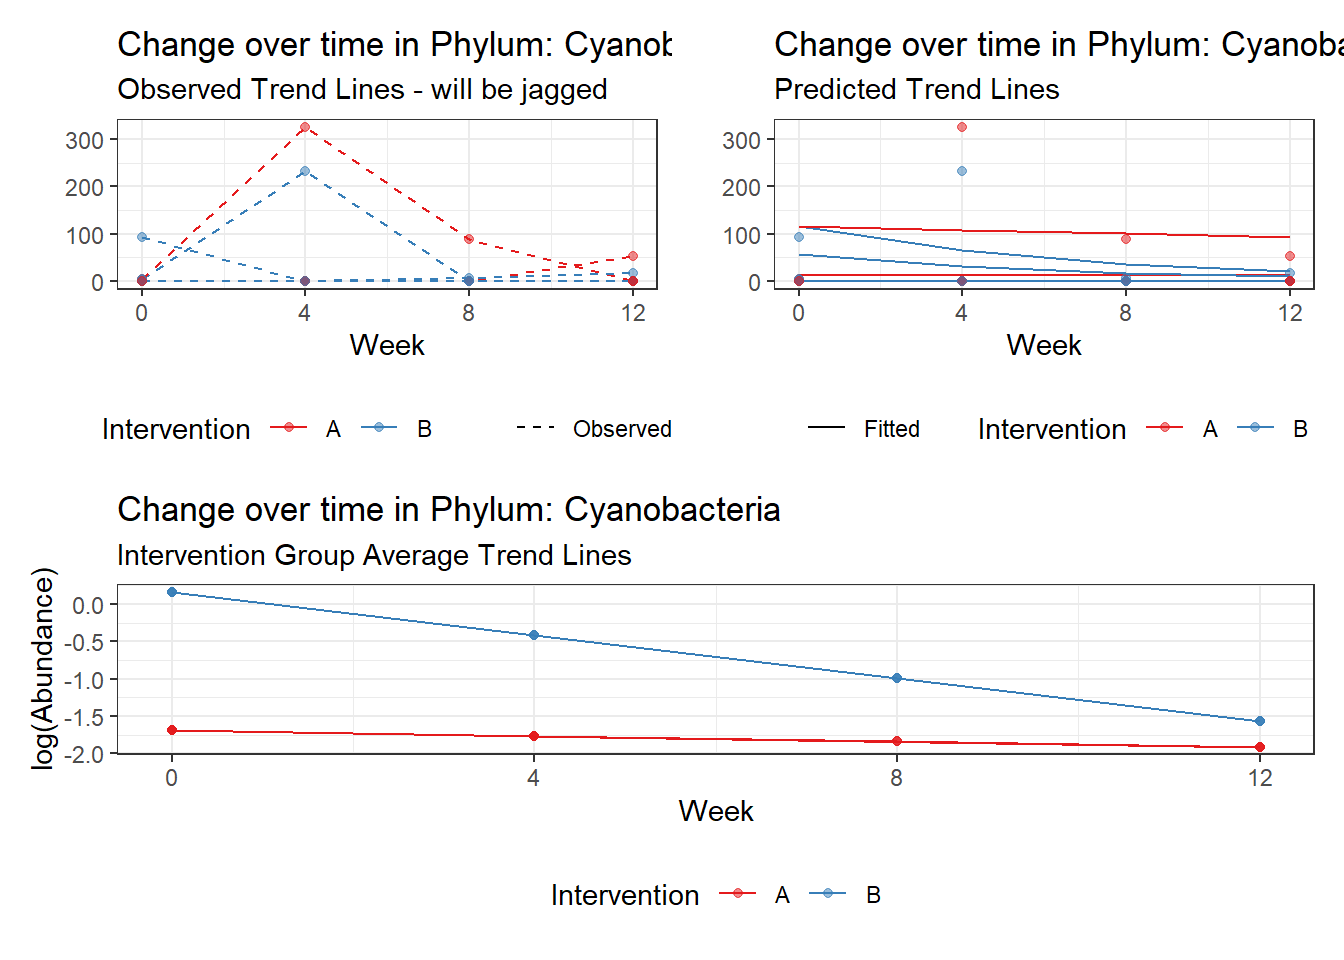
Intraclass Correlation (ICC): 0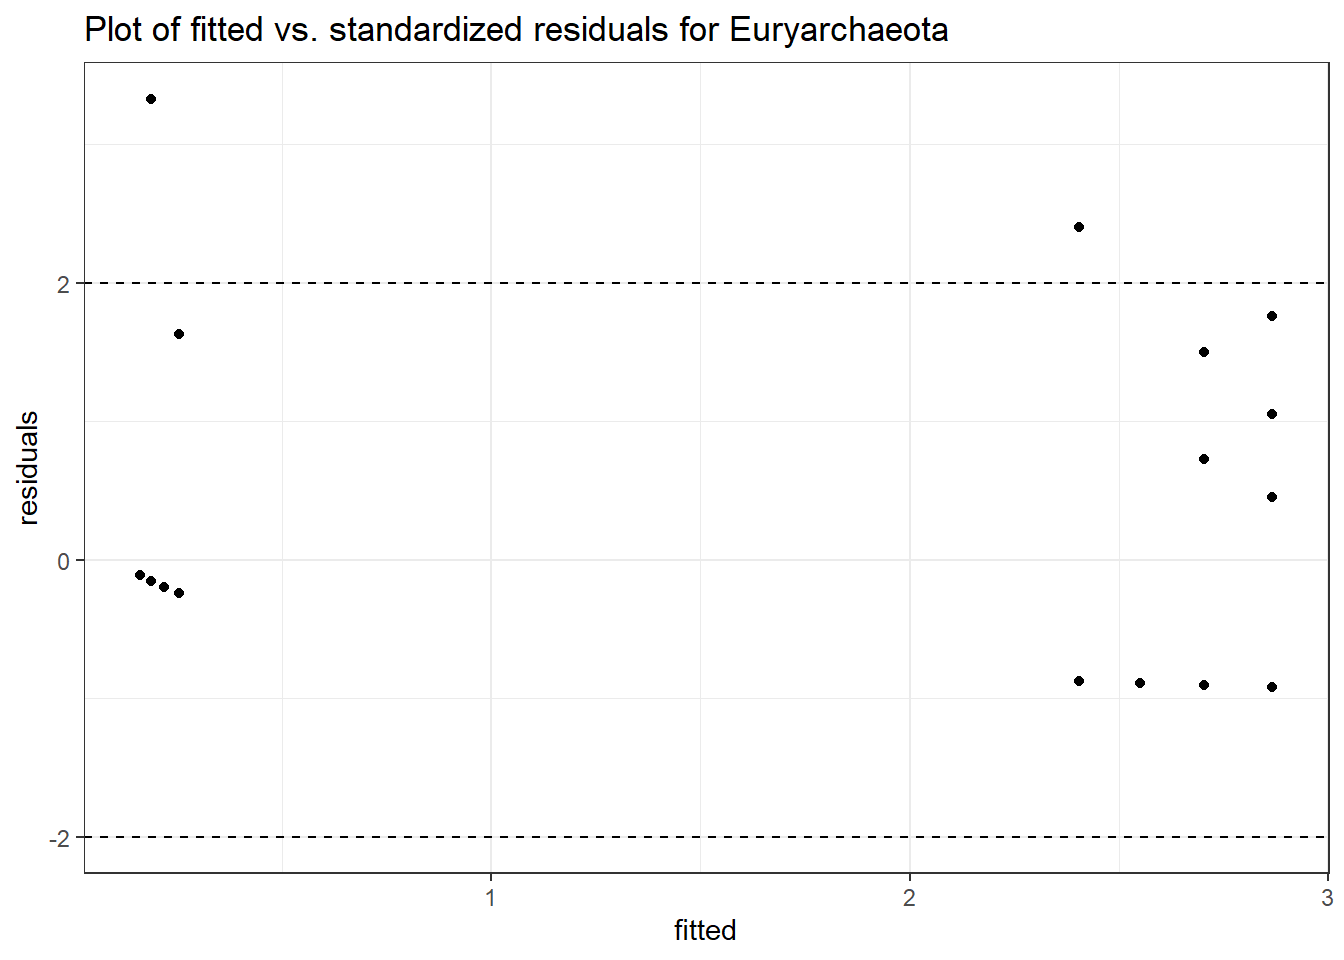
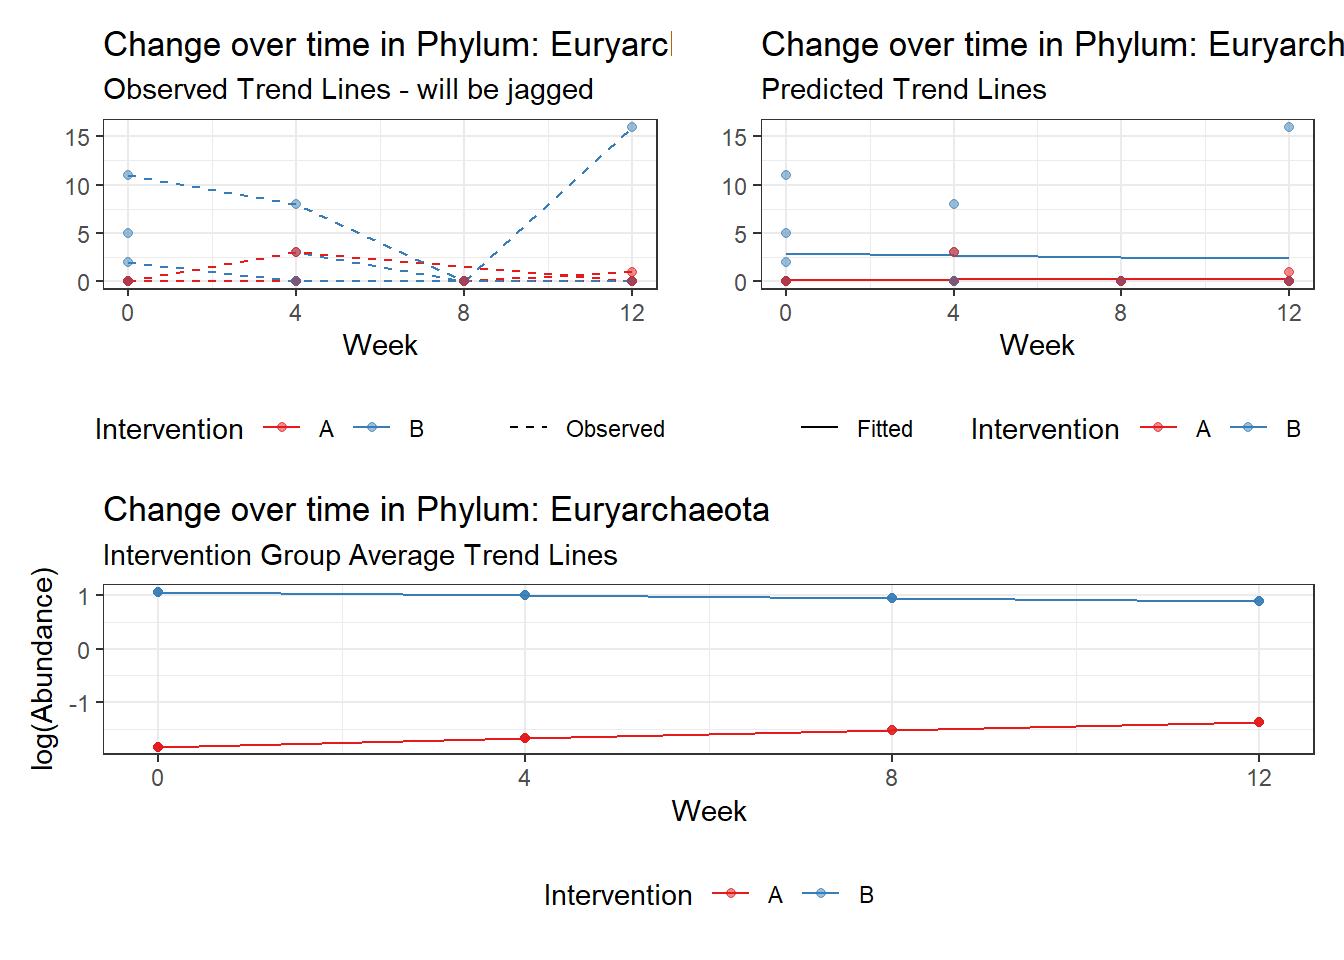
Fixed Effects (change in log)

                  Outcome Estimate Std. Error  z value Pr(>|z|)
(Intercept) Euryarchaeota -1.82395    1.32482 -1.37675  0.16859
intB        Euryarchaeota  2.87704    1.62156  1.77424  0.07602
time        Euryarchaeota  0.15064    0.76730  0.19633  0.84435
intB:time   Euryarchaeota -0.20915    0.90786 -0.23038  0.81780


Random Effects (SD on log scale)

 Groups    Name        Std.Dev.
 SubjectID (Intercept) 0

Significance test not available for random effects

#########################################
#########################################
Model:  Firmicutes ~ 1 + intB + time + intB:time + (1 | SubjectID)
<environment: 0x000000004aef09d0>

Link:    negbinom


Intraclass Correlation (ICC):   0.115014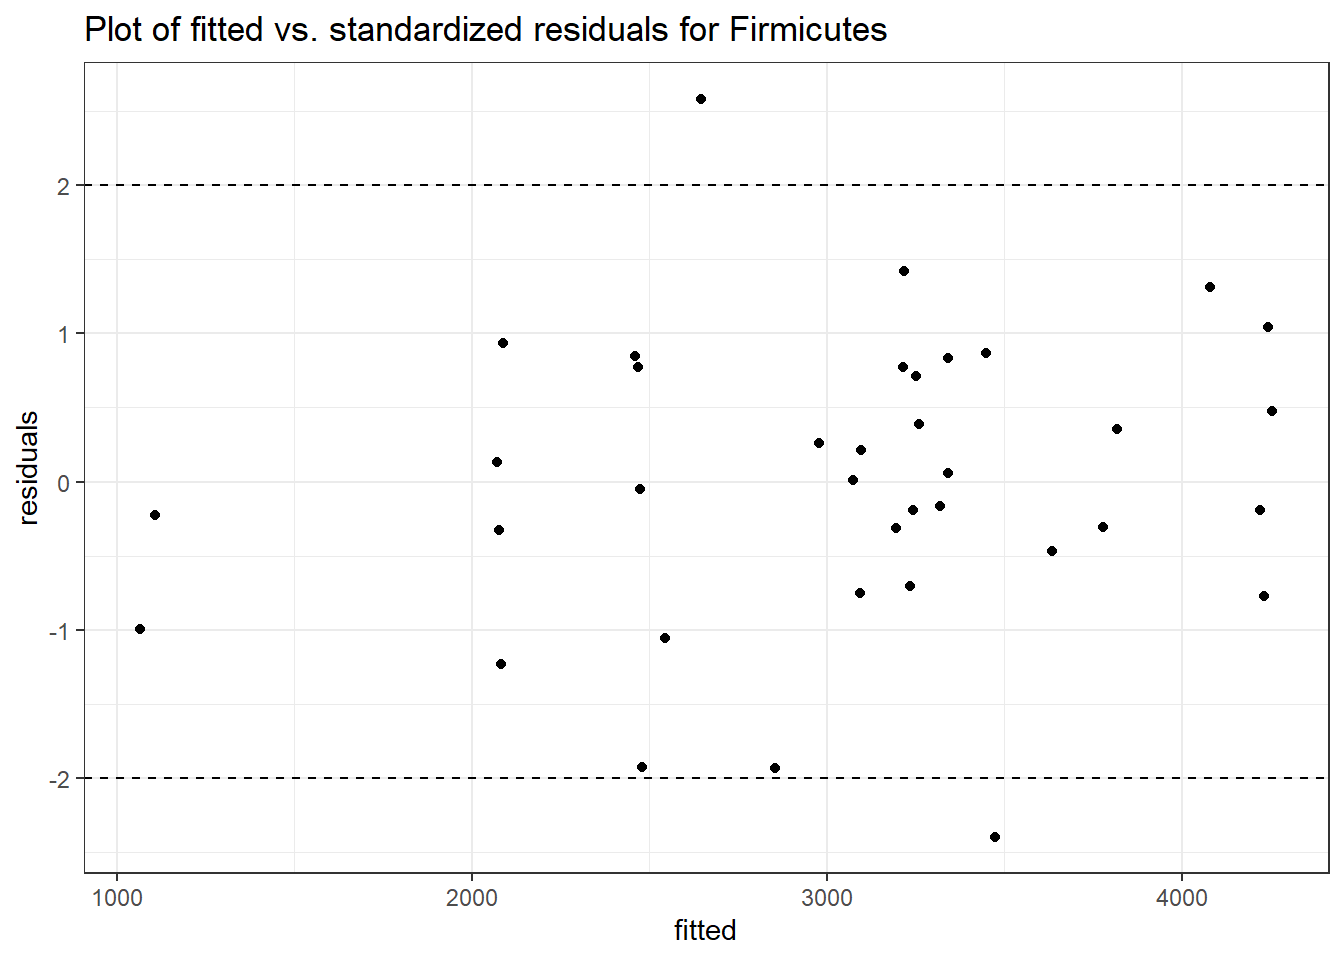
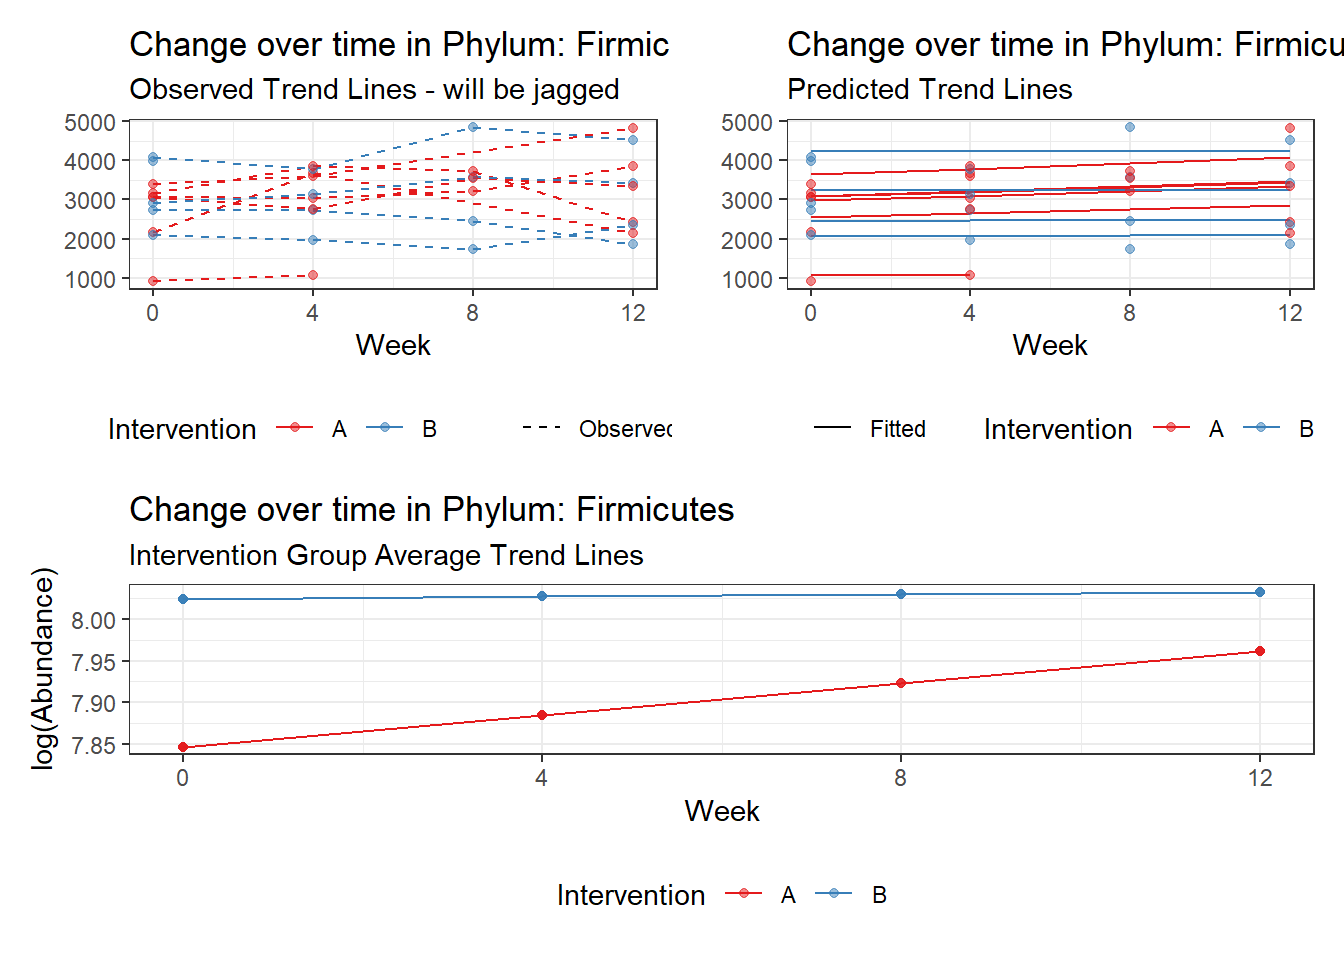
Fixed Effects (change in log)

               Outcome Estimate Std. Error  z value Pr(>|z|)
(Intercept) Firmicutes  7.84659    0.15736 49.86502  0.00000
intB        Firmicutes  0.17778    0.23362  0.76098  0.44667
time        Firmicutes  0.03833    0.03259  1.17590  0.23963
intB:time   Firmicutes -0.03570    0.04825 -0.73979  0.45942


Random Effects (SD on log scale)

 Groups    Name        Std.Dev.
 SubjectID (Intercept) 0.3605

Significance test not available for random effects

#########################################
#########################################
Model:  Lentisphaerae ~ 1 + intB + time + intB:time + (1 | SubjectID)
<environment: 0x000000004aef09d0>

Link:    negbinom


Intraclass Correlation (ICC):   0.8191818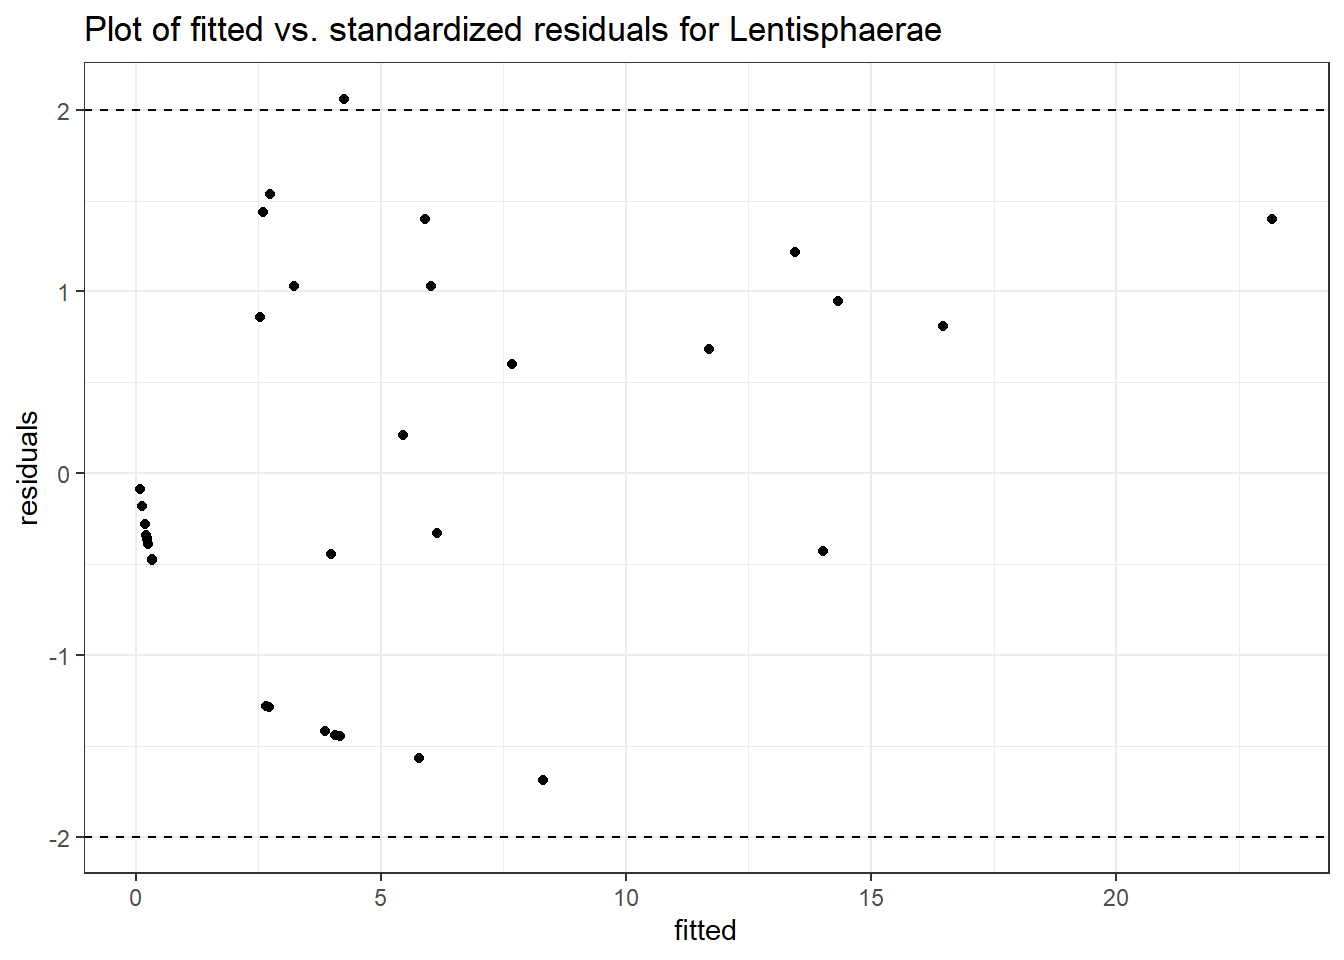
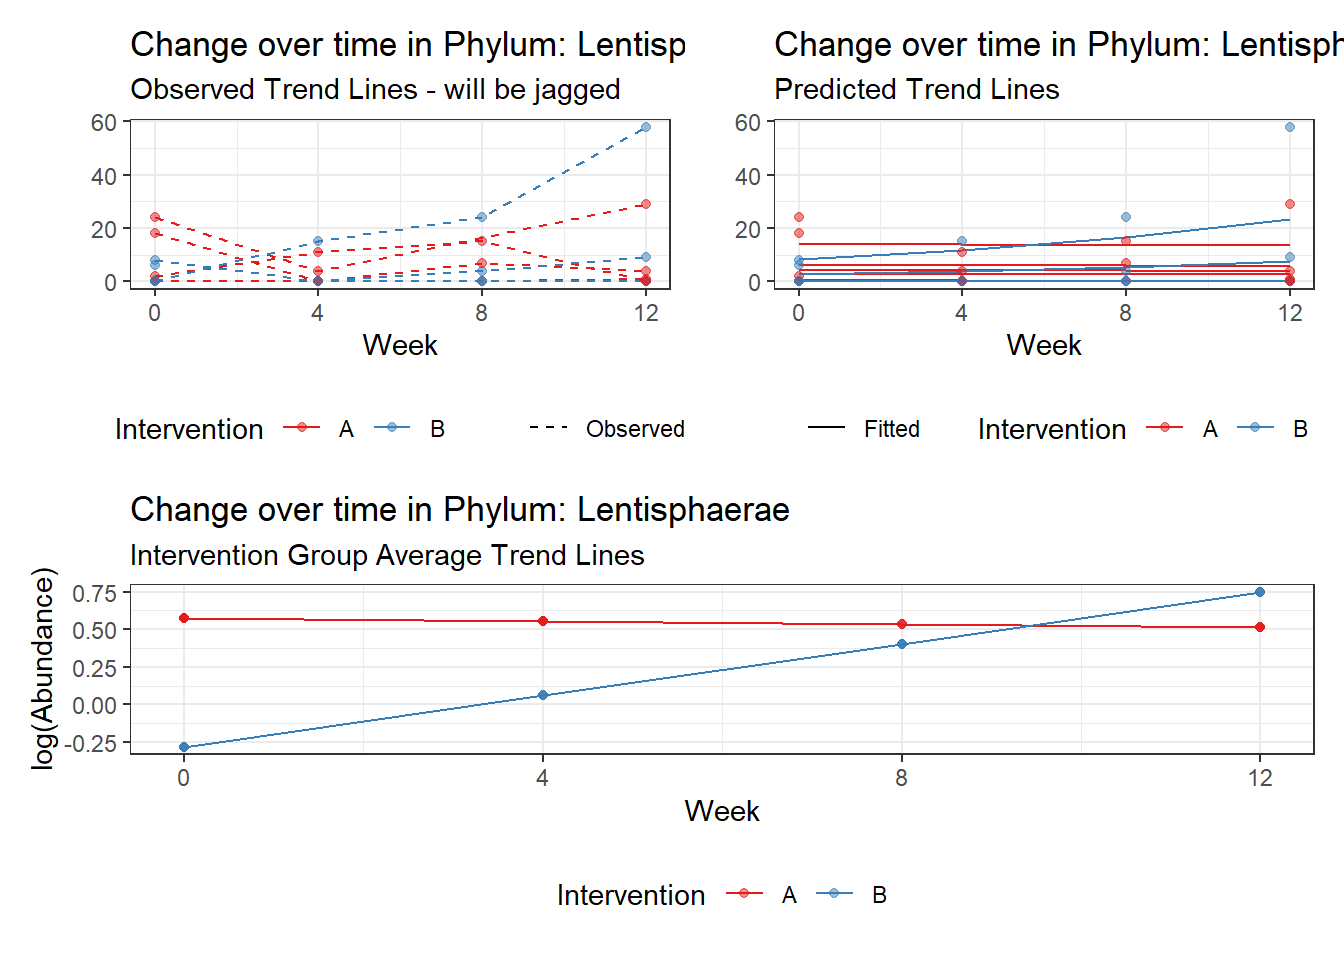
Fixed Effects (change in log)

                  Outcome Estimate Std. Error  z value Pr(>|z|)
(Intercept) Lentisphaerae  0.57683    1.17881  0.48933  0.62461
intB        Lentisphaerae -0.85736    1.67372 -0.51225  0.60848
time        Lentisphaerae -0.02082    0.37741 -0.05515  0.95602
intB:time   Lentisphaerae  0.36326    0.55644  0.65282  0.51387


Random Effects (SD on log scale)

 Groups    Name        Std.Dev.
 SubjectID (Intercept) 2.1285

Significance test not available for random effects

#########################################
#########################################
Model:  Proteobacteria ~ 1 + intB + time + intB:time + (1 | SubjectID)
<environment: 0x000000004aef09d0>

Link:    negbinom


Intraclass Correlation (ICC):   0.02837805
Fixed Effects (change in log)

                   Outcome Estimate Std. Error  z value Pr(>|z|)
(Intercept) Proteobacteria  5.98502    0.20762 28.82736  0.00000
intB        Proteobacteria -0.45039    0.32063 -1.40473  0.16010
time        Proteobacteria -0.12373    0.11430 -1.08256  0.27901
intB:time   Proteobacteria  0.17719    0.16924  1.04695  0.29512


Random Effects (SD on log scale)

 Groups    Name        Std.Dev.
 SubjectID (Intercept) 0.1709

Significance test not available for random effects

#########################################
#########################################
Model:  Tenericutes ~ 1 + intB + time + intB:time + (1 | SubjectID)
<environment: 0x000000004aef09d0>

Link:    negbinom
Warning in checkConv(attr(opt, "derivs"), opt$par, ctrl = control$checkConv, :
Model failed to converge with max|grad| = 0.00438541 (tol = 0.002, component 1)boundary (singular) fit: see ?isSingular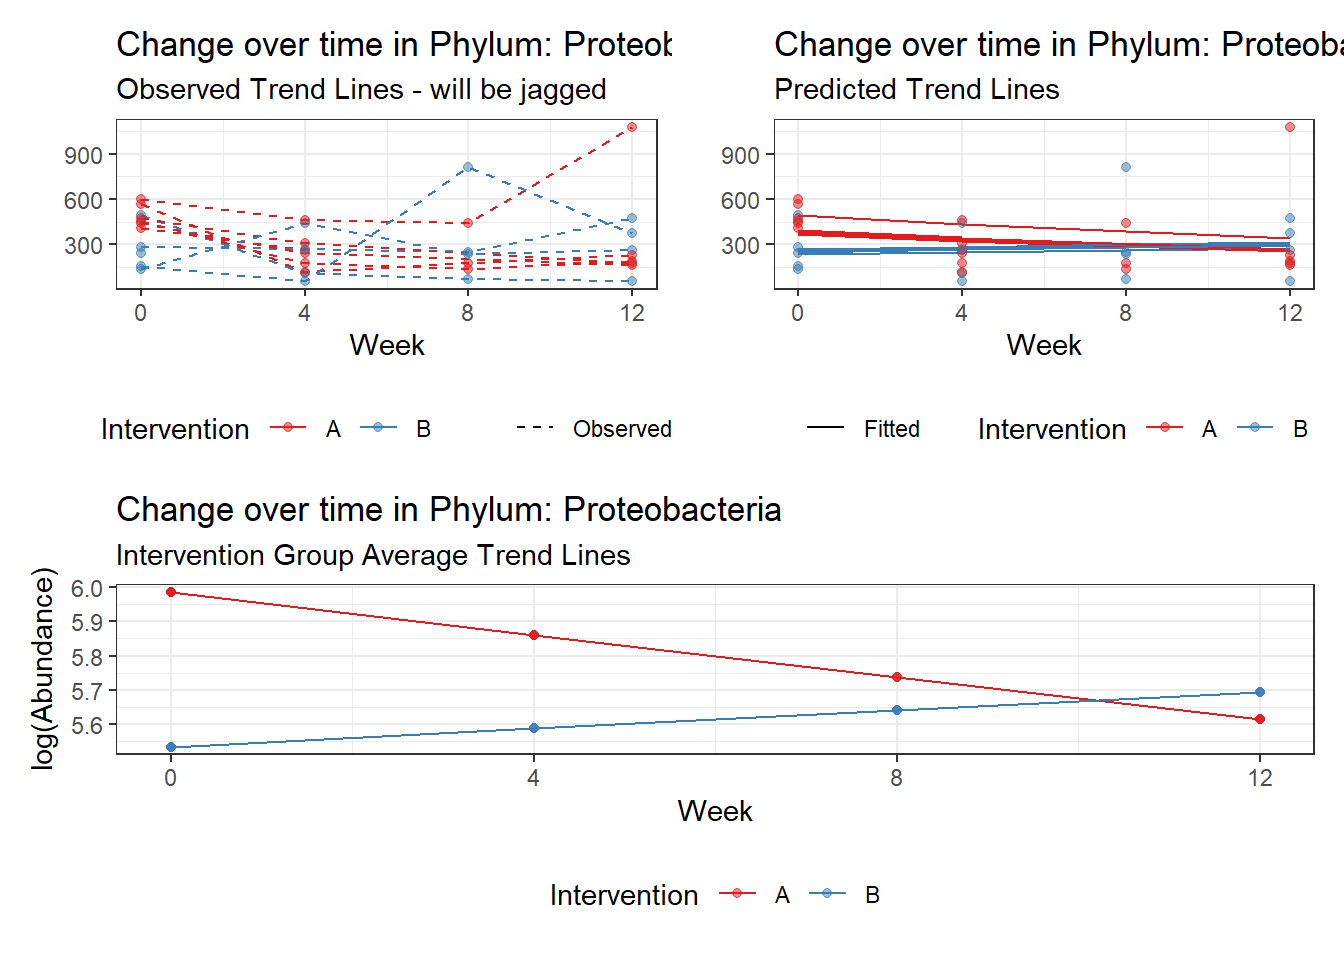
Intraclass Correlation (ICC): 4.481095e-12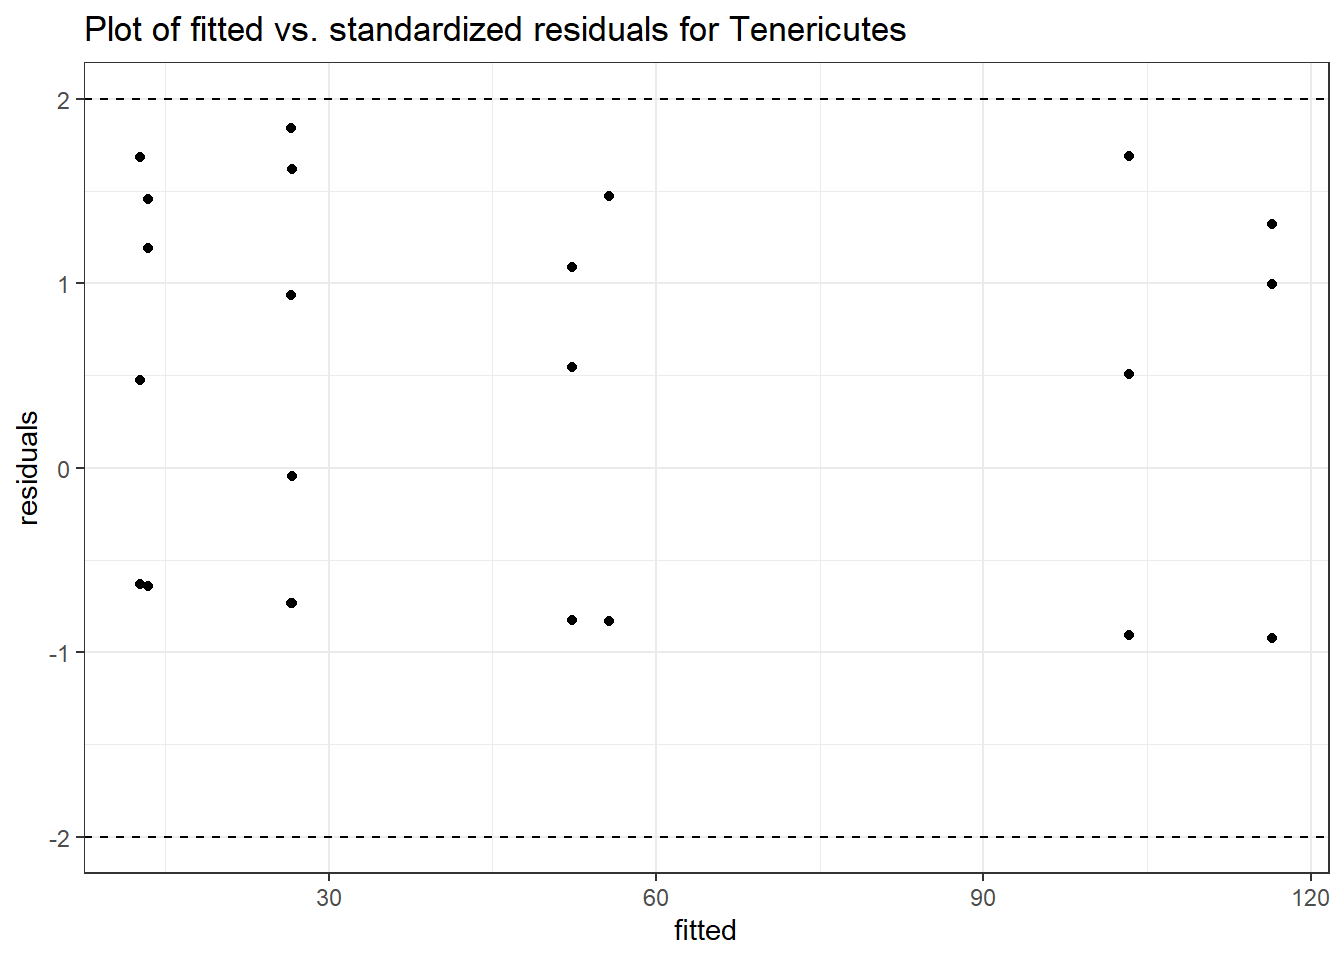
Fixed Effects (change in log)

                Outcome Estimate Std. Error  z value Pr(>|z|)
(Intercept) Tenericutes  2.59705    1.09668  2.36811  0.01788
intB        Tenericutes -0.05400    1.63231 -0.03308  0.97361
time        Tenericutes  0.68027    0.62041  1.09649  0.27286
intB:time   Tenericutes  0.05798    0.90675  0.06394  0.94902


Random Effects (SD on log scale)

 Groups    Name        Std.Dev.
 SubjectID (Intercept) 2.1169e-06

Significance test not available for random effects

#########################################
#########################################
Model:  Verrucomicrobia ~ 1 + intB + time + intB:time + (1 | SubjectID)
<environment: 0x000000004aef09d0>

Link:    negbinom
boundary (singular) fit: see ?isSingular
Intraclass Correlation (ICC): 1.976585e-11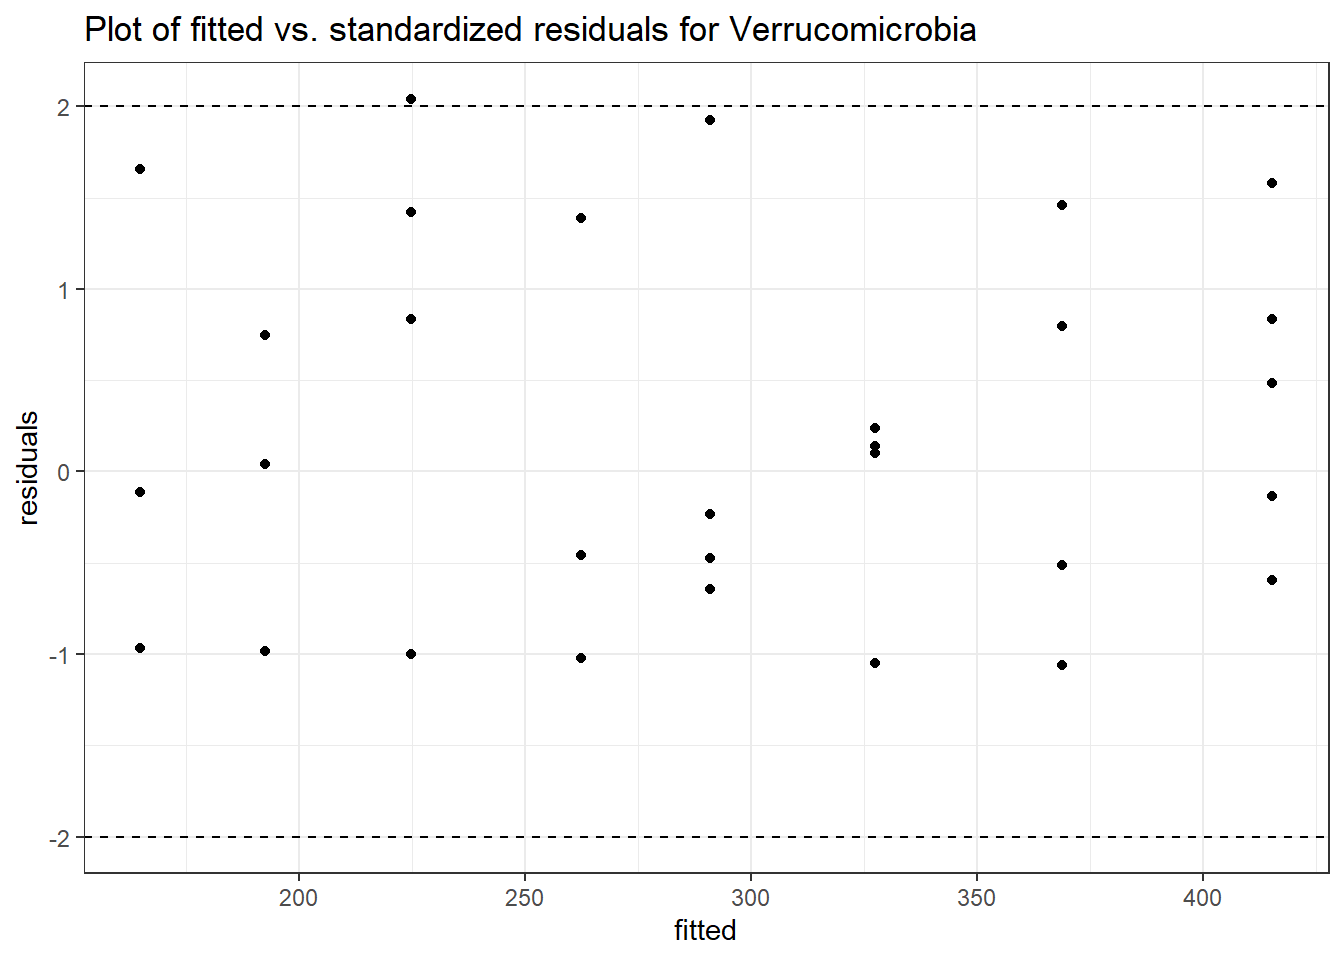

Fixed Effects (change in log)

                    Outcome Estimate Std. Error  z value Pr(>|z|)
(Intercept) Verrucomicrobia  5.56968    0.96093  5.79616  0.00000
intB        Verrucomicrobia  0.45954    1.33004  0.34551  0.72971
time        Verrucomicrobia -0.15489    0.57324 -0.27020  0.78701
intB:time   Verrucomicrobia  0.03610    0.74911  0.04819  0.96157


Random Effects (SD on log scale)

 Groups    Name        Std.Dev.
 SubjectID (Intercept) 4.4459e-06

Significance test not available for random effects
Covariate(s): Time by intervention interaction (only)
Only the interaction term.
\[\begin{align*} h\left(Y_{ij}\right)&=\beta_{0j} + \beta_{1j}(Week)_{ij}+ r_{ij}\\ \beta_{0j}&= \gamma_{00} + u_{0j}\\ \beta_{1j}&= \gamma_{10} + \gamma_{11}(Intervention)_{j}\\ \end{align*}\]
phylum.fit6 <- glmm_microbiome(mydata=microbiome_data,model.number=6,
                               taxa.level="Phylum", link="poisson",
                               model="1 + time + intB:time + (1|SubjectID)")
#########################################
#########################################
Model:  Actinobacteria ~ 1 + time + intB:time + (1 | SubjectID)
<environment: 0x000000004cb03058>

Link:    poisson


Intraclass Correlation (ICC):   0.4783296

Fixed Effects (change in log)

                   Outcome Estimate Std. Error z value Pr(>|z|)
(Intercept) Actinobacteria  2.53592    0.29696 8.53961  0.00000
time        Actinobacteria  0.09052    0.04830 1.87418  0.06091
time:intB   Actinobacteria  0.14692    0.06211 2.36544  0.01801


Random Effects (SD on log scale)

 Groups    Name        Std.Dev.
 SubjectID (Intercept) 0.95756

Significance test not available for random effects

#########################################
#########################################
Model:  Bacteroidetes ~ 1 + time + intB:time + (1 | SubjectID)
<environment: 0x000000004cb03058>

Link:    poisson


Intraclass Correlation (ICC):   0.1811897

Fixed Effects (change in log)

                  Outcome Estimate Std. Error  z value Pr(>|z|)
(Intercept) Bacteroidetes  8.00875    0.14193 56.42900    0e+00
time        Bacteroidetes -0.02181    0.00363 -6.00767    0e+00
time:intB   Bacteroidetes -0.02248    0.00531 -4.22991    2e-05


Random Effects (SD on log scale)

 Groups    Name        Std.Dev.
 SubjectID (Intercept) 0.47041

Significance test not available for random effects

#########################################
#########################################
Model:  Cyanobacteria ~ 1 + time + intB:time + (1 | SubjectID)
<environment: 0x000000004cb03058>

Link:    poisson


Intraclass Correlation (ICC):   0.9459588

Fixed Effects (change in log)

                  Outcome Estimate Std. Error  z value Pr(>|z|)
(Intercept) Cyanobacteria -0.83959    1.71059 -0.49082  0.62355
time        Cyanobacteria -0.07509    0.04112 -1.82584  0.06787
time:intB   Cyanobacteria -0.49494    0.06783 -7.29656  0.00000


Random Effects (SD on log scale)

 Groups    Name        Std.Dev.
 SubjectID (Intercept) 4.1838

Significance test not available for random effects

#########################################
#########################################
Model:  Euryarchaeota ~ 1 + time + intB:time + (1 | SubjectID)
<environment: 0x000000004cb03058>

Link:    poisson


Intraclass Correlation (ICC):   0.7947804
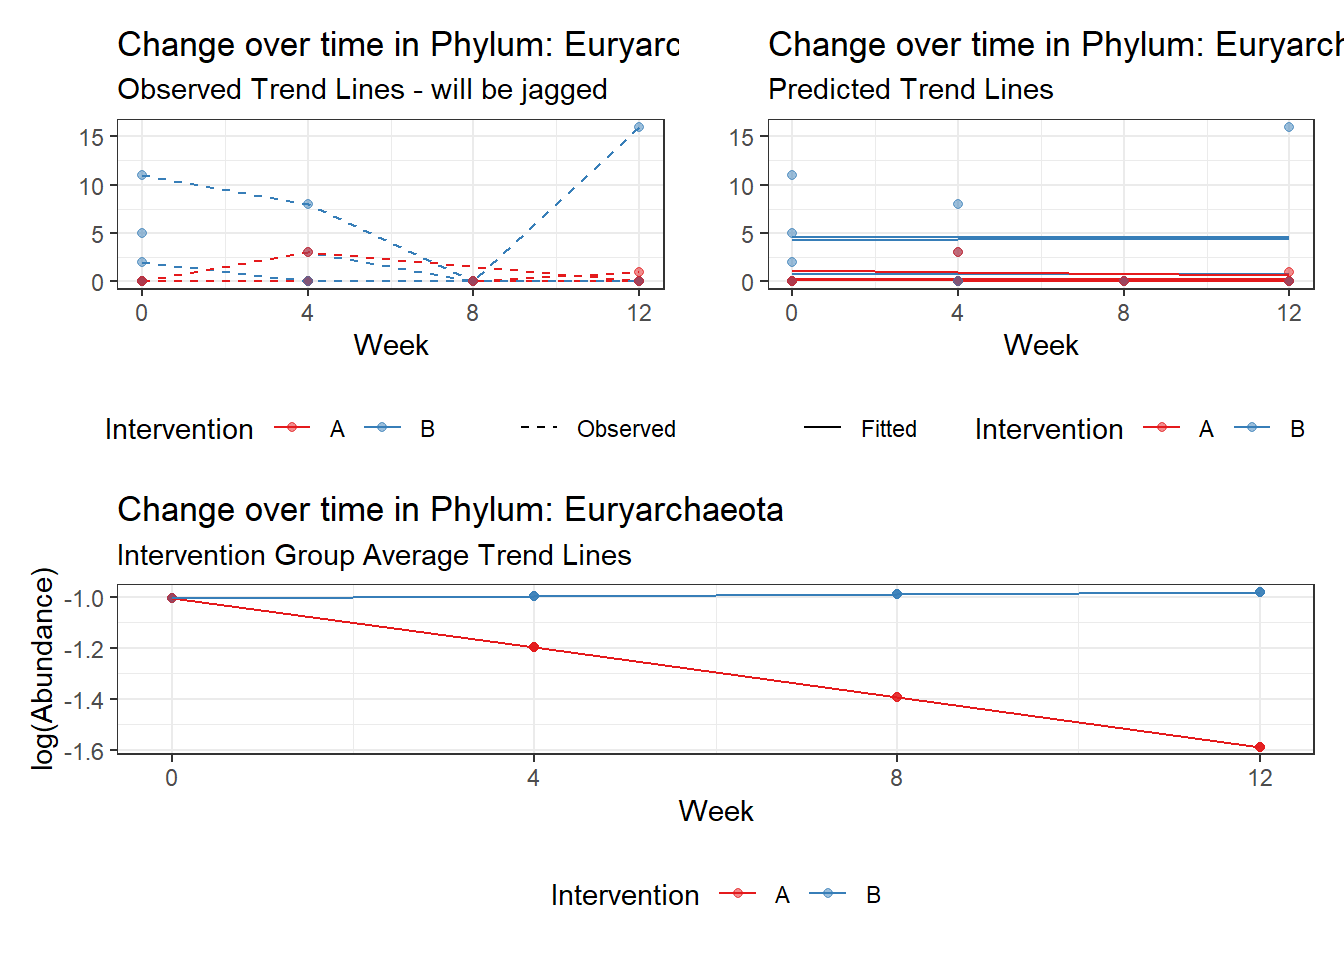
Fixed Effects (change in log)

                  Outcome Estimate Std. Error  z value Pr(>|z|)
(Intercept) Euryarchaeota -1.00544    0.88489 -1.13623  0.25586
time        Euryarchaeota -0.19368    0.38486 -0.50324  0.61480
time:intB   Euryarchaeota  0.20135    0.40971  0.49143  0.62312


Random Effects (SD on log scale)

 Groups    Name        Std.Dev.
 SubjectID (Intercept) 1.968

Significance test not available for random effects

#########################################
#########################################
Model:  Firmicutes ~ 1 + time + intB:time + (1 | SubjectID)
<environment: 0x000000004cb03058>

Link:    poisson


Intraclass Correlation (ICC):   0.1321344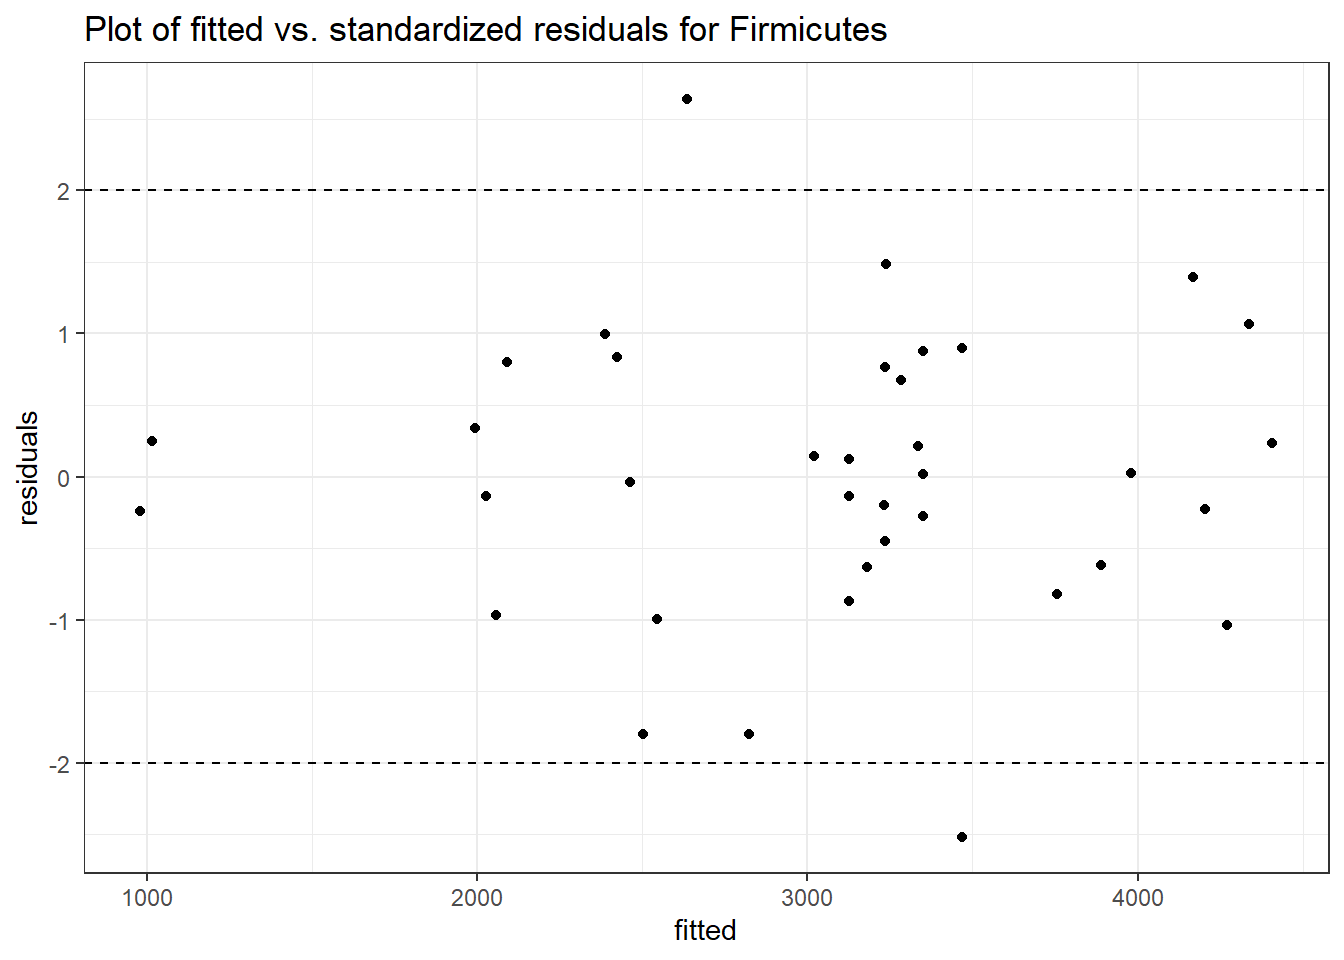
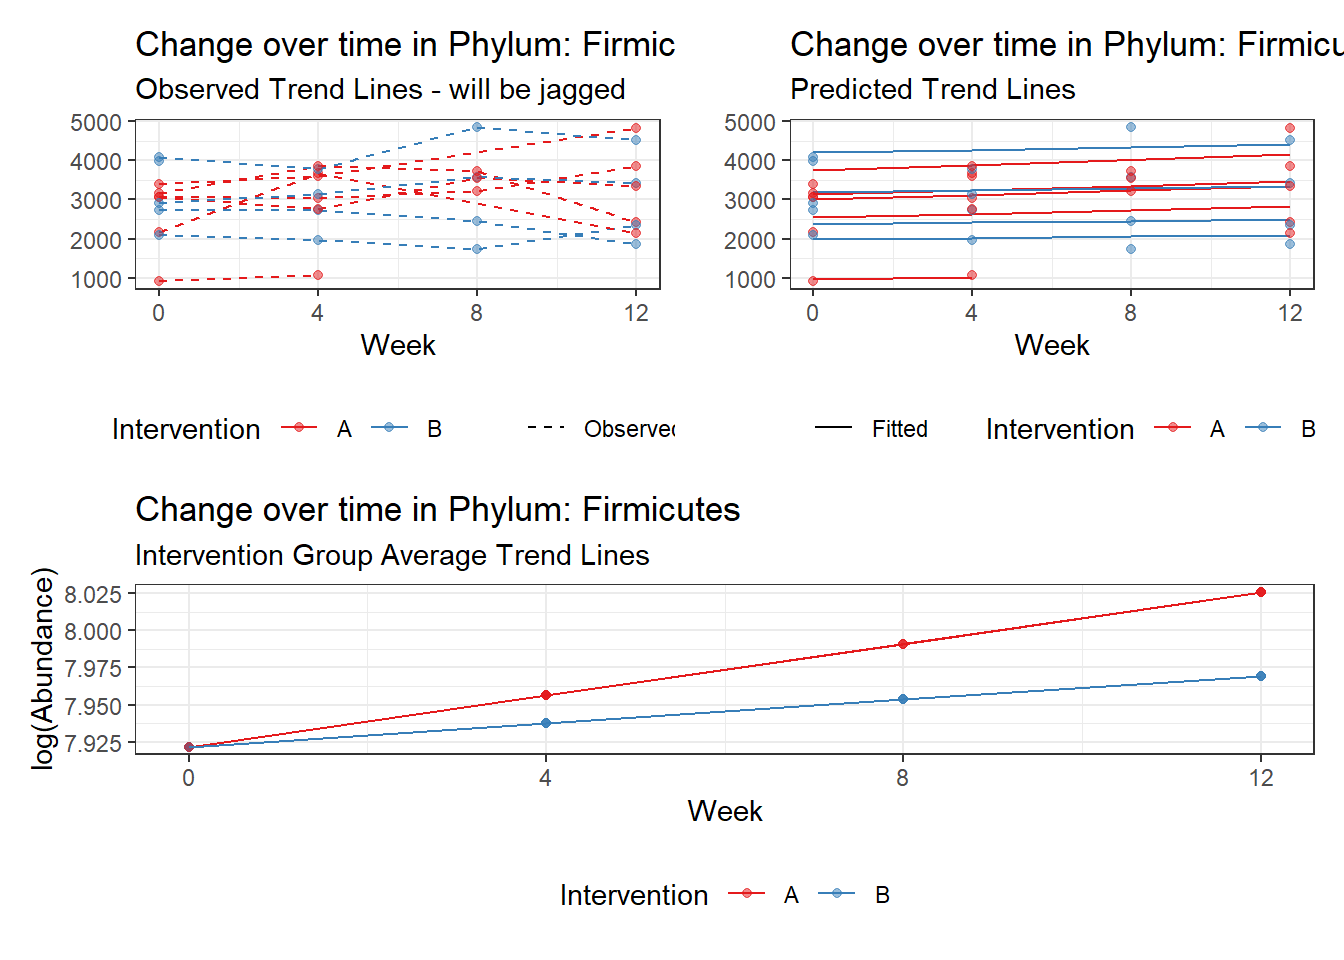
Fixed Effects (change in log)

               Outcome Estimate Std. Error  z value Pr(>|z|)
(Intercept) Firmicutes  7.92184    0.11775 67.27597  0.00000
time        Firmicutes  0.03457    0.00352  9.81800  0.00000
time:intB   Firmicutes -0.01871    0.00538 -3.47559  0.00051


Random Effects (SD on log scale)

 Groups    Name        Std.Dev.
 SubjectID (Intercept) 0.39019

Significance test not available for random effects

#########################################
#########################################
Model:  Lentisphaerae ~ 1 + time + intB:time + (1 | SubjectID)
<environment: 0x000000004cb03058>

Link:    poisson


Intraclass Correlation (ICC):   0.8836954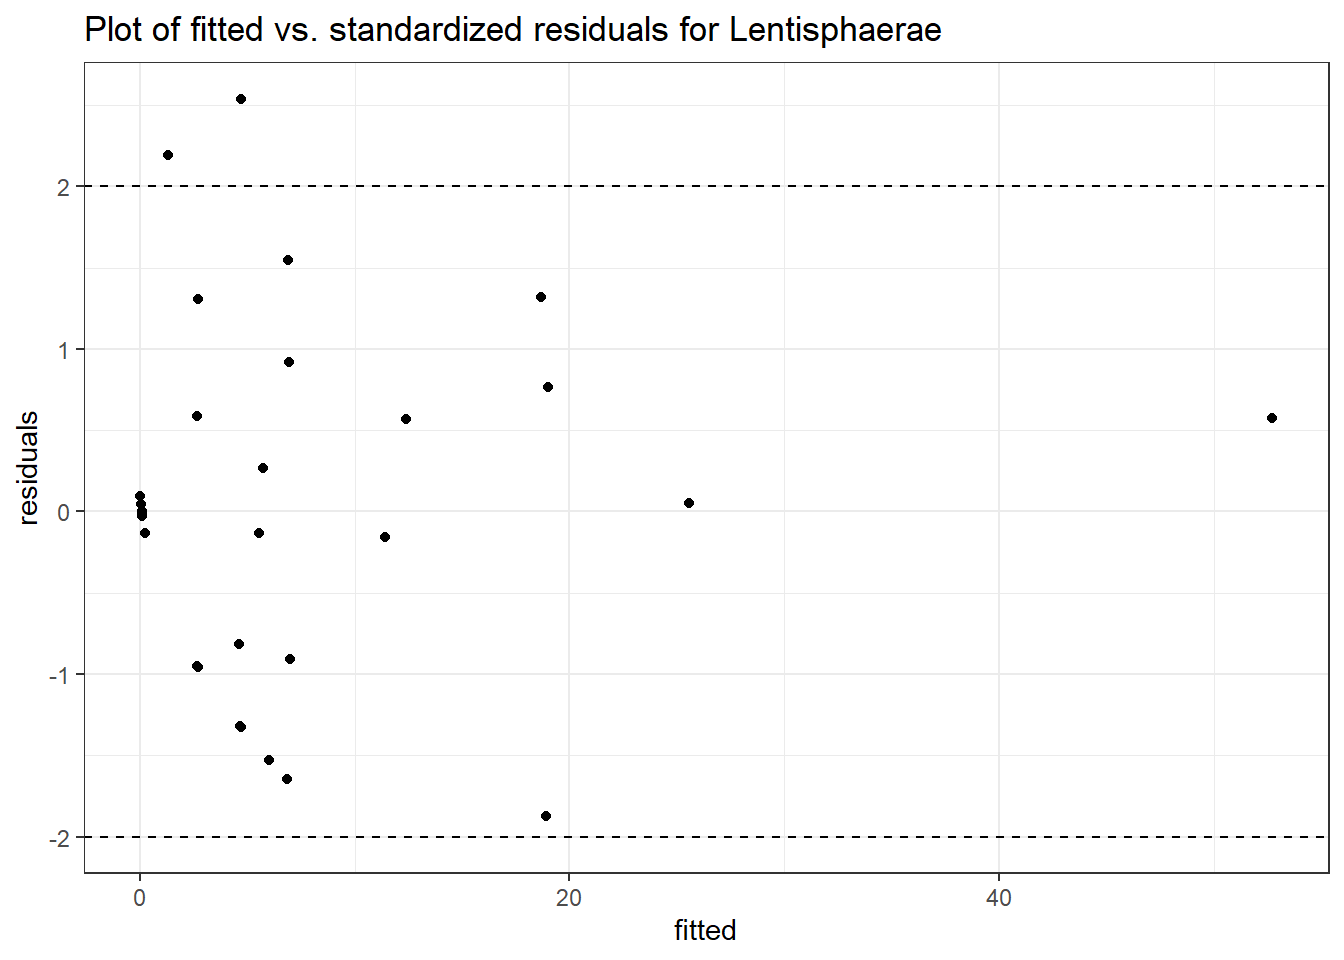
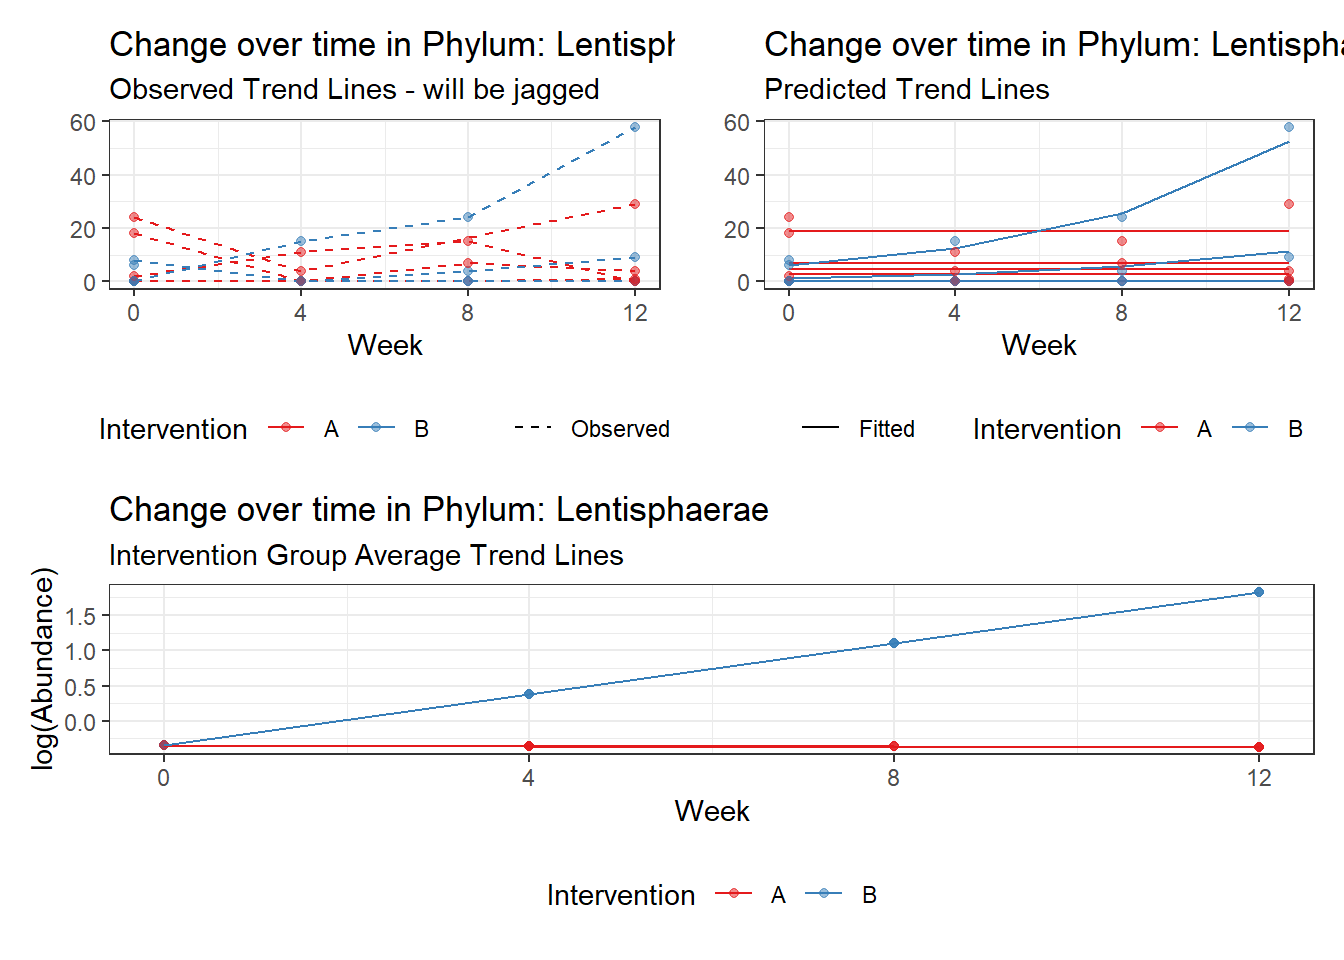
Fixed Effects (change in log)

                  Outcome Estimate Std. Error  z value Pr(>|z|)
(Intercept) Lentisphaerae -0.34507    0.97811 -0.35279  0.72425
time        Lentisphaerae -0.00644    0.07897 -0.08150  0.93504
time:intB   Lentisphaerae  0.72920    0.12722  5.73197  0.00000


Random Effects (SD on log scale)

 Groups    Name        Std.Dev.
 SubjectID (Intercept) 2.7565

Significance test not available for random effects

#########################################
#########################################
Model:  Proteobacteria ~ 1 + time + intB:time + (1 | SubjectID)
<environment: 0x000000004cb03058>

Link:    poisson


Intraclass Correlation (ICC):   0.114292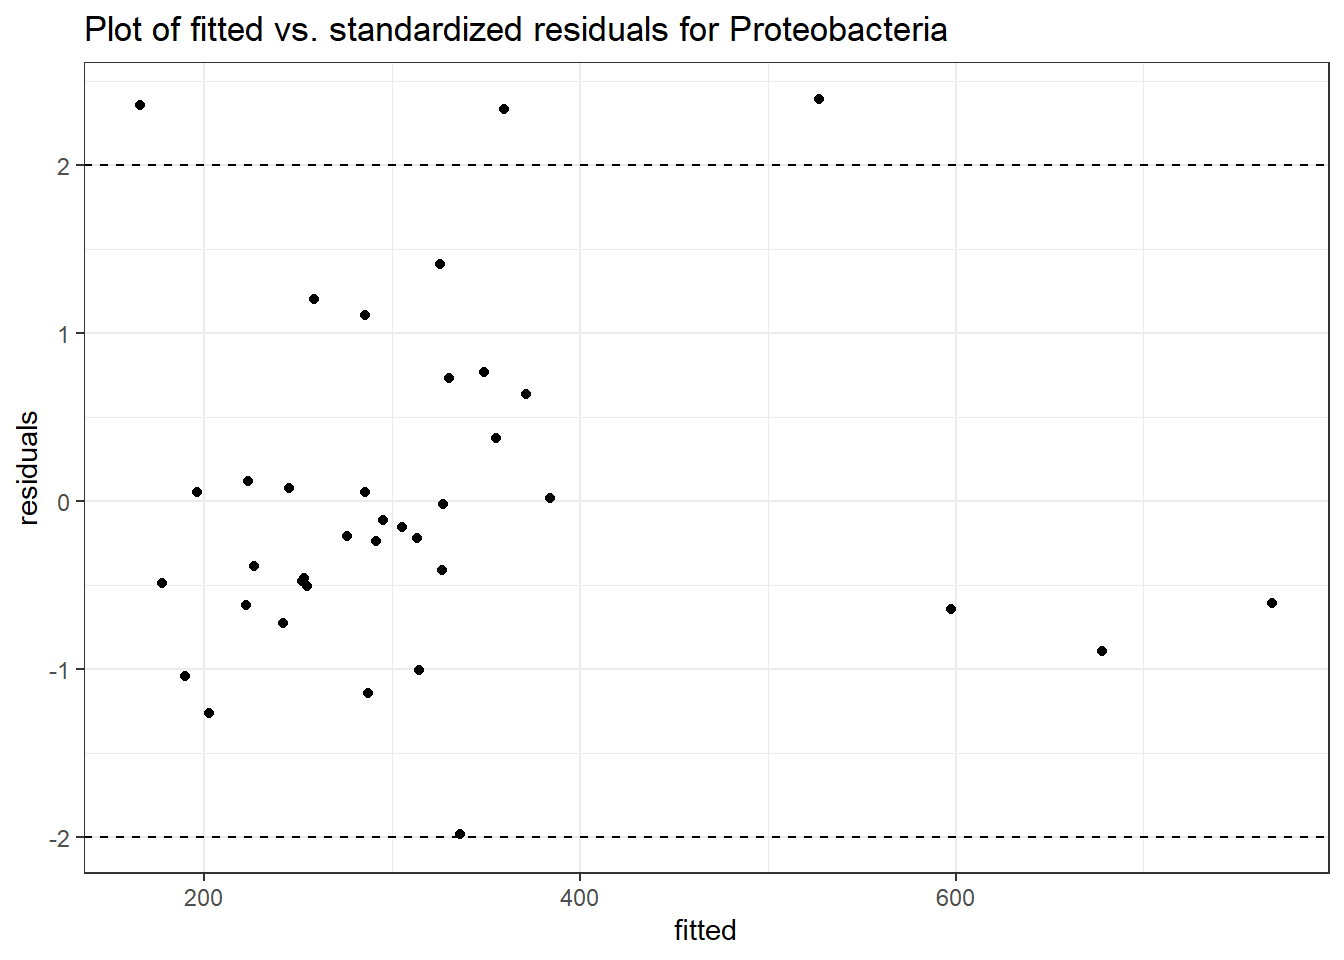

Fixed Effects (change in log)

                   Outcome Estimate Std. Error   z value Pr(>|z|)
(Intercept) Proteobacteria  5.74272    0.10932  52.53091        0
time        Proteobacteria -0.12581    0.01087 -11.56941        0
time:intB   Proteobacteria  0.19257    0.01723  11.17407        0


Random Effects (SD on log scale)

 Groups    Name        Std.Dev.
 SubjectID (Intercept) 0.35922

Significance test not available for random effects

#########################################
#########################################
Model:  Tenericutes ~ 1 + time + intB:time + (1 | SubjectID)
<environment: 0x000000004cb03058>

Link:    poisson


Intraclass Correlation (ICC):   0.9209168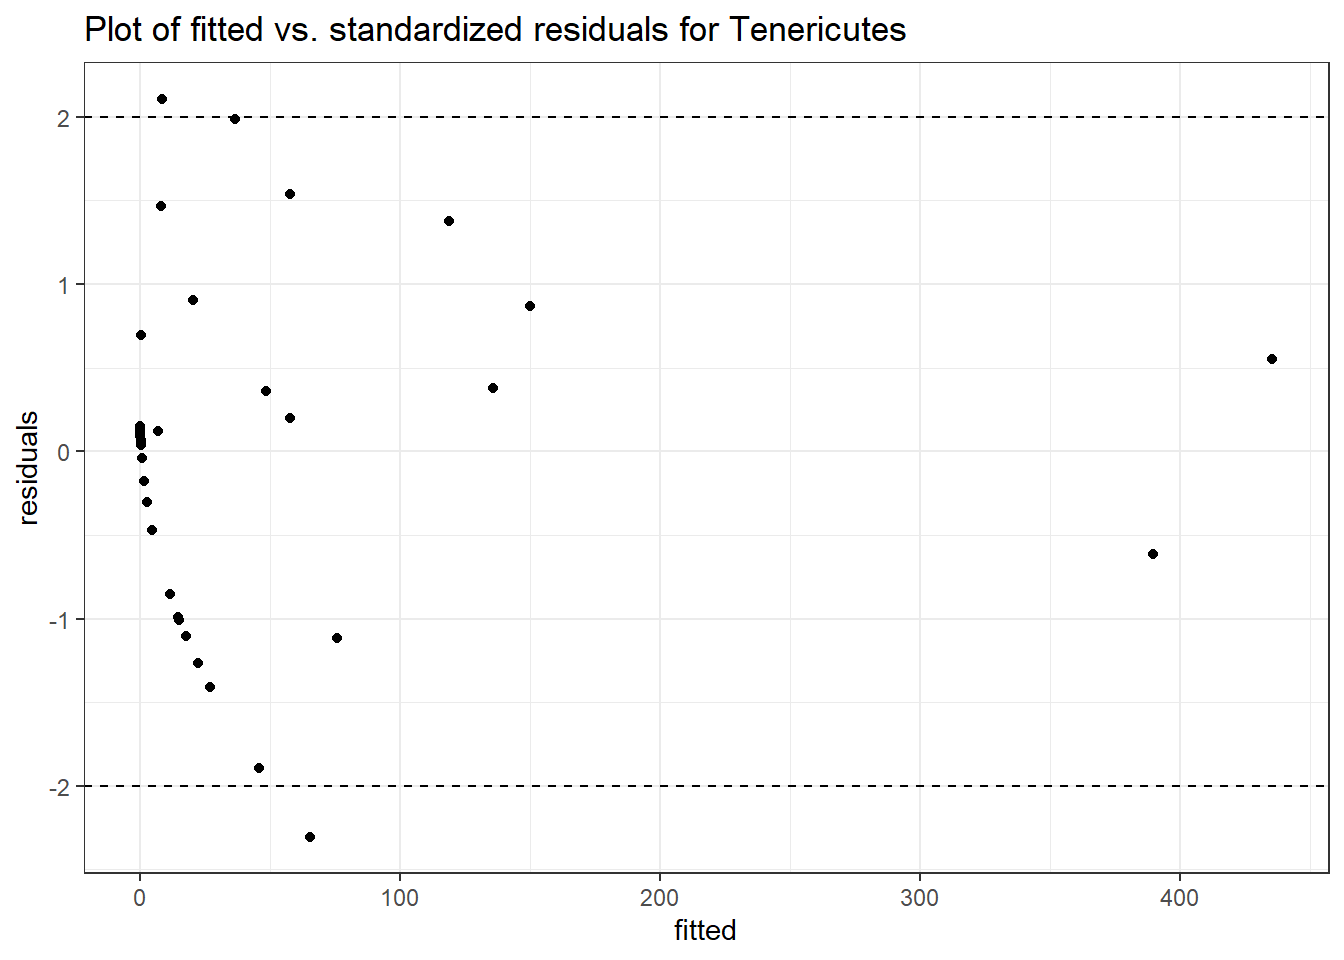
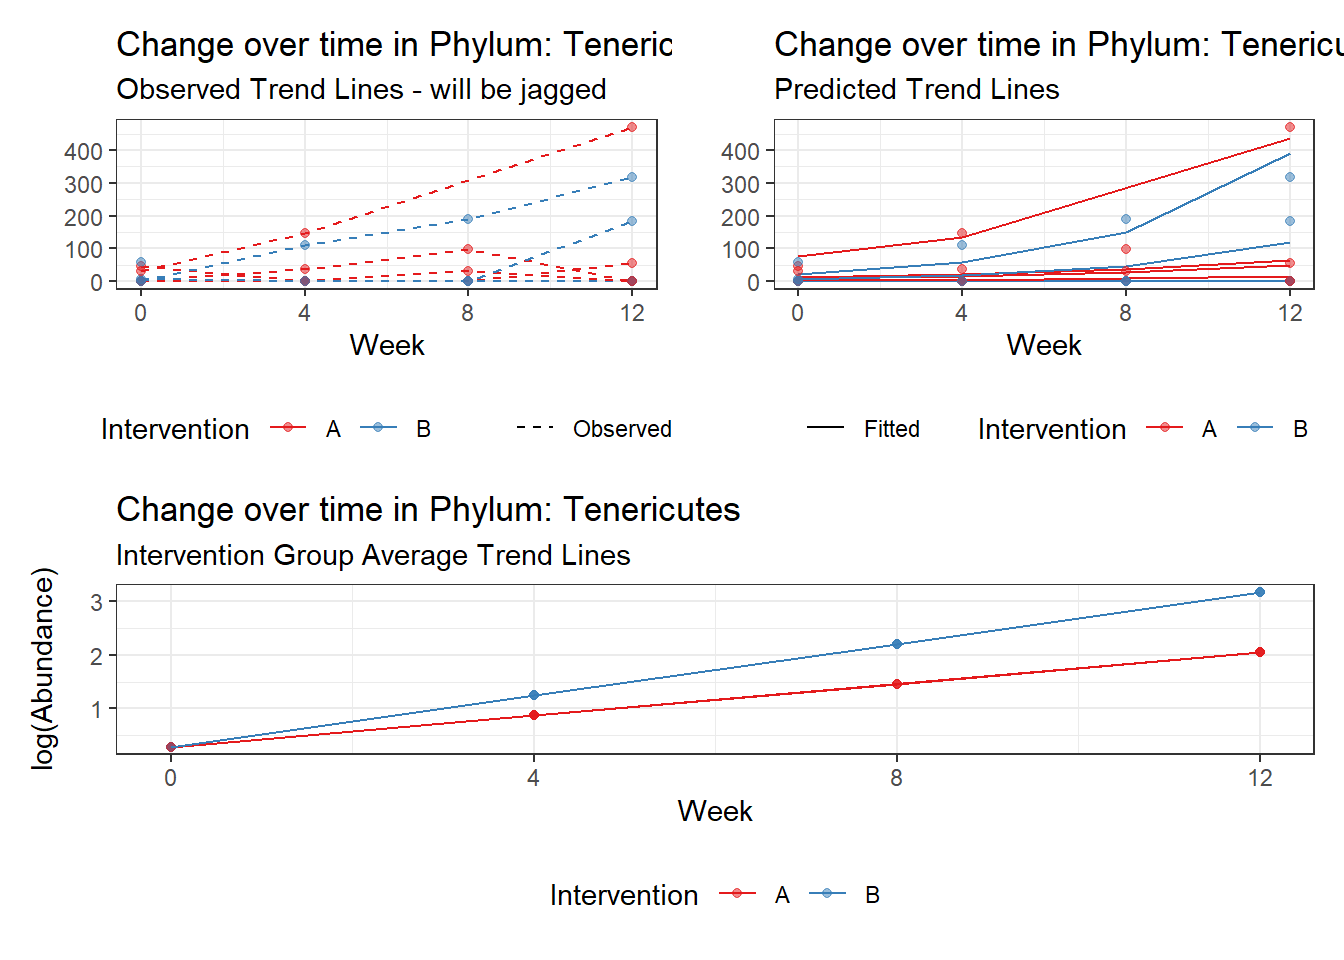
Fixed Effects (change in log)

                Outcome Estimate Std. Error  z value Pr(>|z|)
(Intercept) Tenericutes  0.29442    1.06903  0.27541    0.783
time        Tenericutes  0.58340    0.03023 19.29717    0.000
time:intB   Tenericutes  0.37108    0.05290  7.01497    0.000


Random Effects (SD on log scale)

 Groups    Name        Std.Dev.
 SubjectID (Intercept) 3.4125

Significance test not available for random effects

#########################################
#########################################
Model:  Verrucomicrobia ~ 1 + time + intB:time + (1 | SubjectID)
<environment: 0x000000004cb03058>

Link:    poisson


Intraclass Correlation (ICC):   0.8603956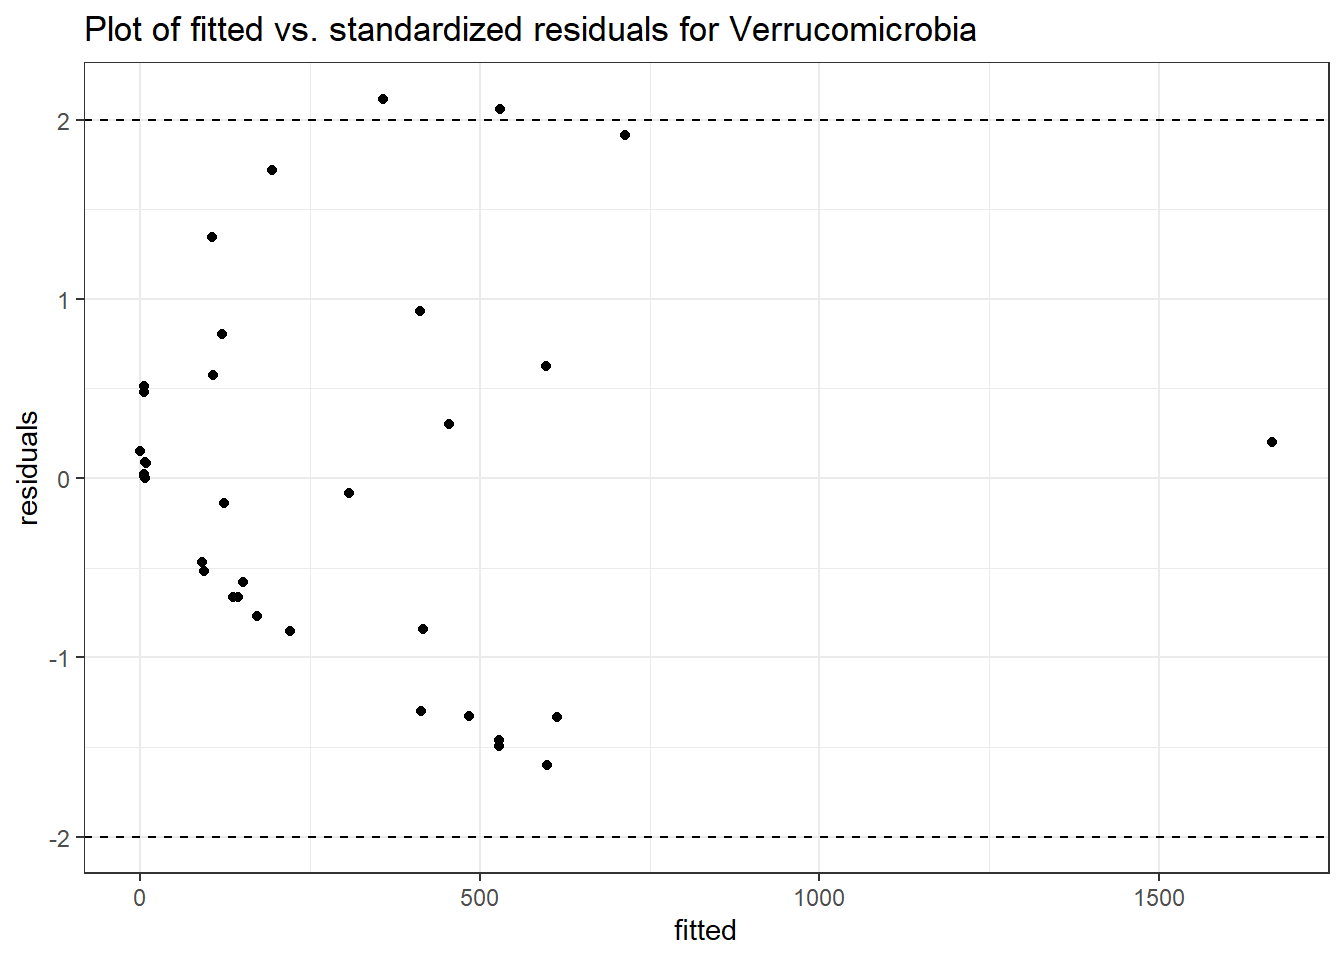
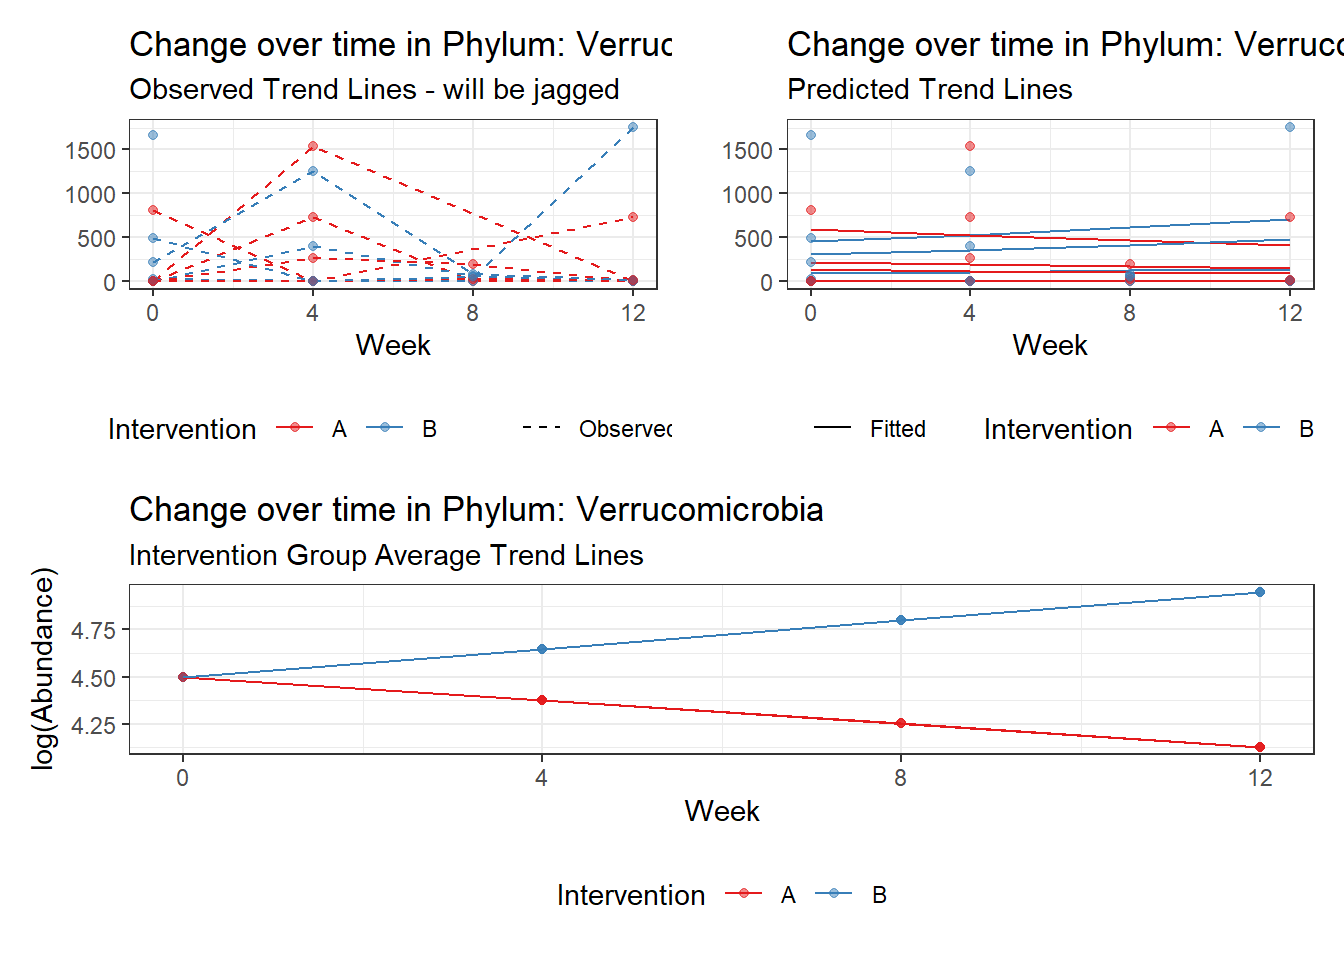
Fixed Effects (change in log)

                    Outcome Estimate Std. Error  z value Pr(>|z|)
(Intercept) Verrucomicrobia  4.49776    0.75515  5.95610        0
time        Verrucomicrobia -0.12318    0.01296 -9.50252        0
time:intB   Verrucomicrobia  0.27351    0.01882 14.52988        0


Random Effects (SD on log scale)

 Groups    Name        Std.Dev.
 SubjectID (Intercept) 2.4826

Significance test not available for random effects
phylum.fit6b <- glmm_microbiome(mydata=microbiome_data,model.number=6,
taxa.level="Phylum", link="negbinom",
model="1 + time + intB:time + (1|SubjectID)")
#########################################
#########################################
Model:  Actinobacteria ~ 1 + time + intB:time + (1 | SubjectID)
<environment: 0x000000000acec120>

Link:    negbinom


Intraclass Correlation (ICC):   0.3183468
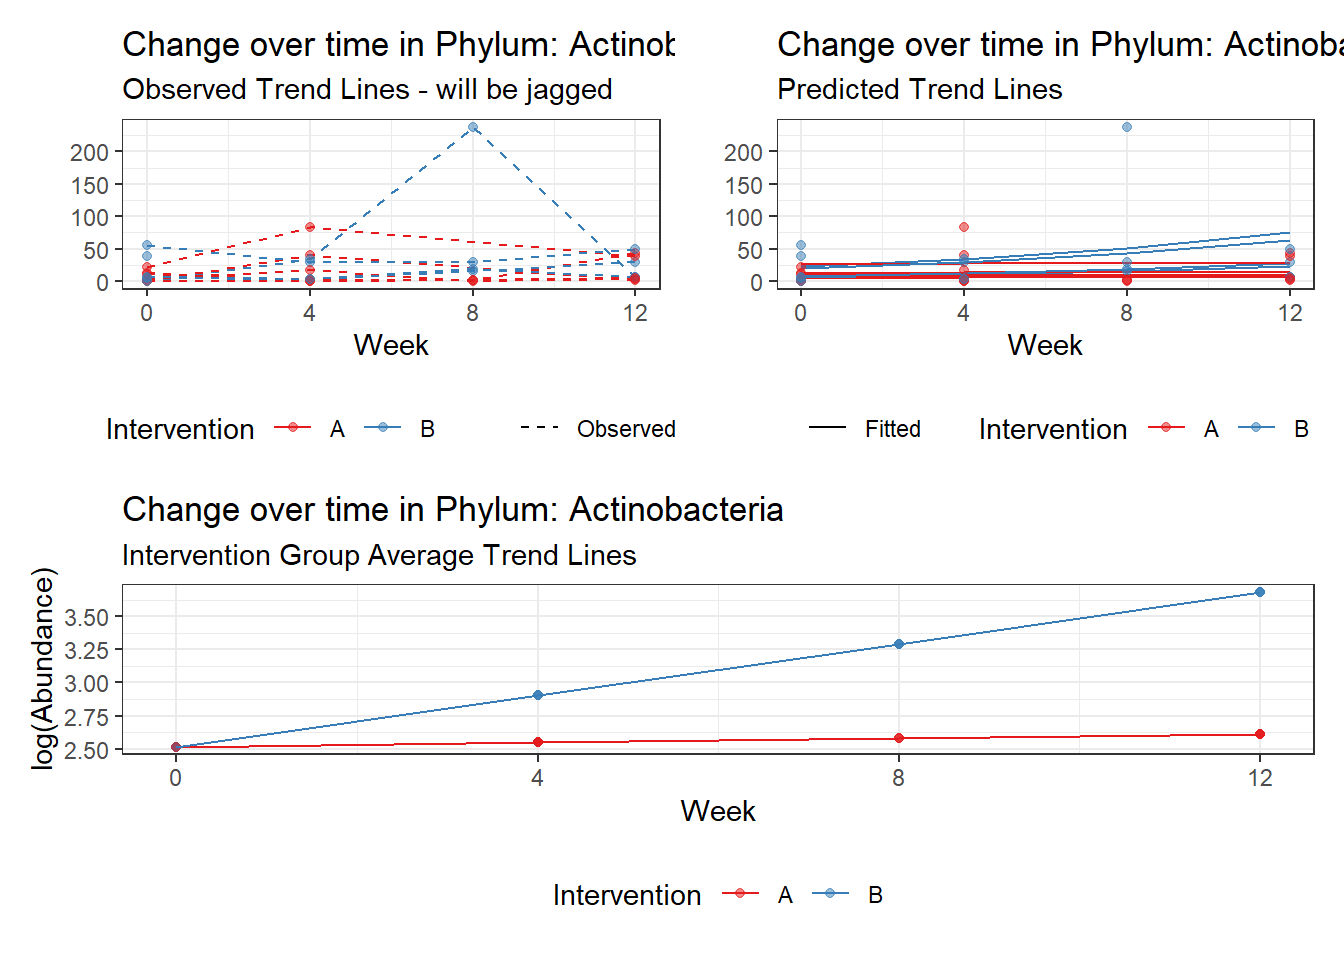
Fixed Effects (change in log)

                   Outcome Estimate Std. Error z value Pr(>|z|)
(Intercept) Actinobacteria  2.51648    0.39112 6.43396  0.00000
time        Actinobacteria  0.03273    0.22700 0.14419  0.88535
time:intB   Actinobacteria  0.35587    0.28469 1.25005  0.21128


Random Effects (SD on log scale)

 Groups    Name        Std.Dev.
 SubjectID (Intercept) 0.68339

Significance test not available for random effects

#########################################
#########################################
Model:  Bacteroidetes ~ 1 + time + intB:time + (1 | SubjectID)
<environment: 0x000000000acec120>

Link:    negbinom


Intraclass Correlation (ICC):   0.1443309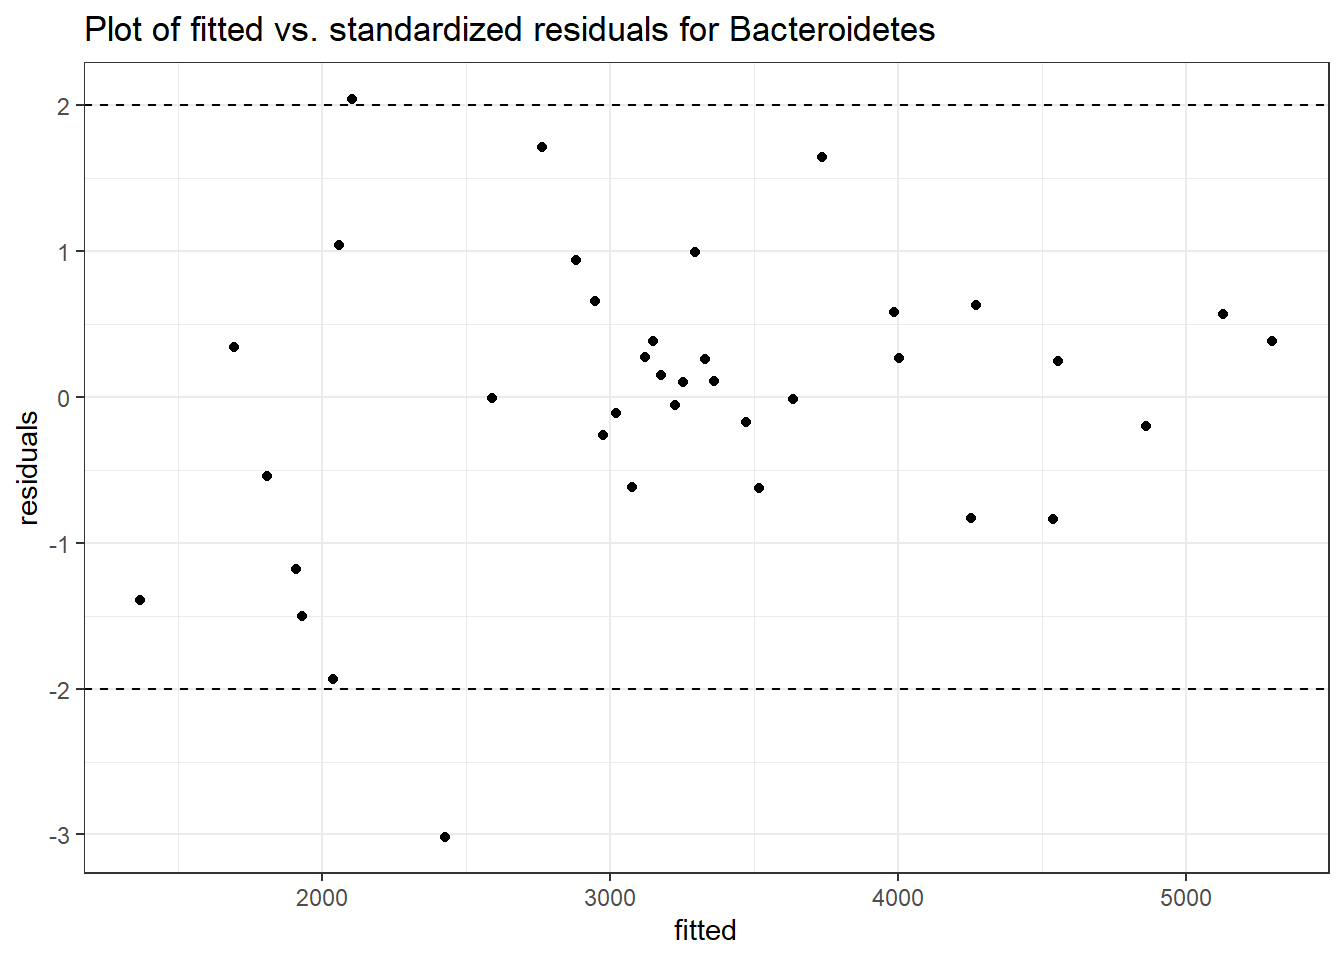
Fixed Effects (change in log)

                  Outcome Estimate Std. Error  z value Pr(>|z|)
(Intercept) Bacteroidetes  8.04560    0.13814 58.24076  0.00000
time        Bacteroidetes -0.03257    0.04502 -0.72351  0.46937
time:intB   Bacteroidetes -0.03216    0.06613 -0.48629  0.62676


Random Effects (SD on log scale)

 Groups    Name        Std.Dev.
 SubjectID (Intercept) 0.4107

Significance test not available for random effects

#########################################
#########################################
Model:  Cyanobacteria ~ 1 + time + intB:time + (1 | SubjectID)
<environment: 0x000000000acec120>

Link:    negbinom
Warning in theta.ml(Y, mu, weights = object@resp$weights, limit = limit, :
iteration limit reachedWarning in sqrt(1/i): NaNs produced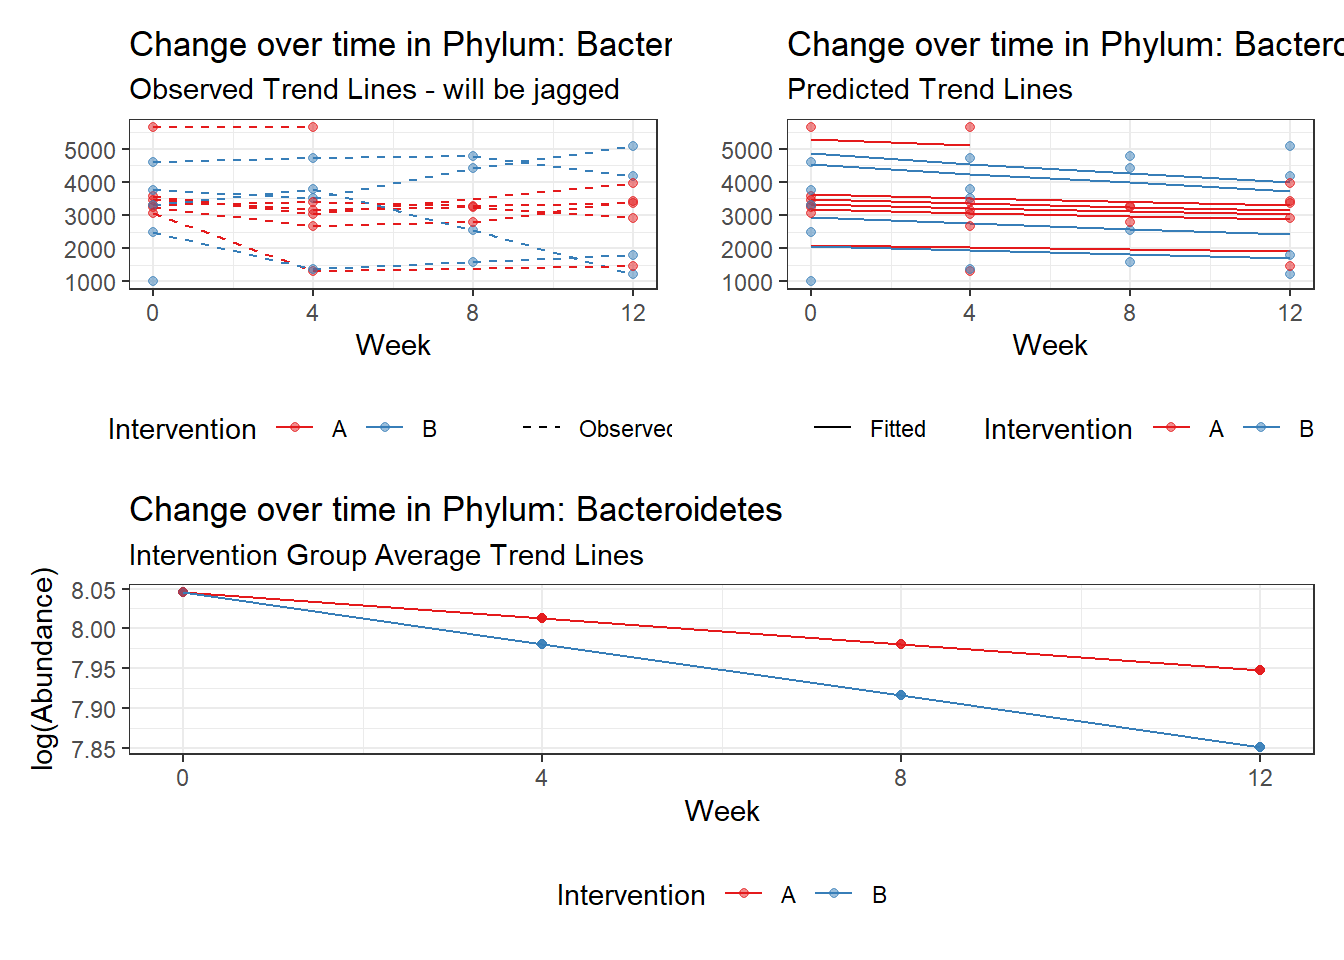
Intraclass Correlation (ICC): 0.9464282
Fixed Effects (change in log)

                  Outcome Estimate Std. Error  z value Pr(>|z|)
(Intercept) Cyanobacteria -0.86194    1.78254 -0.48355  0.62871
time        Cyanobacteria -0.07268    0.04214 -1.72474  0.08457
time:intB   Cyanobacteria -0.50410    0.06903 -7.30215  0.00000


Random Effects (SD on log scale)

 Groups    Name        Std.Dev.
 SubjectID (Intercept) 4.2032

Significance test not available for random effects

#########################################
#########################################
Model:  Euryarchaeota ~ 1 + time + intB:time + (1 | SubjectID)
<environment: 0x000000000acec120>

Link:    negbinom
boundary (singular) fit: see ?isSingular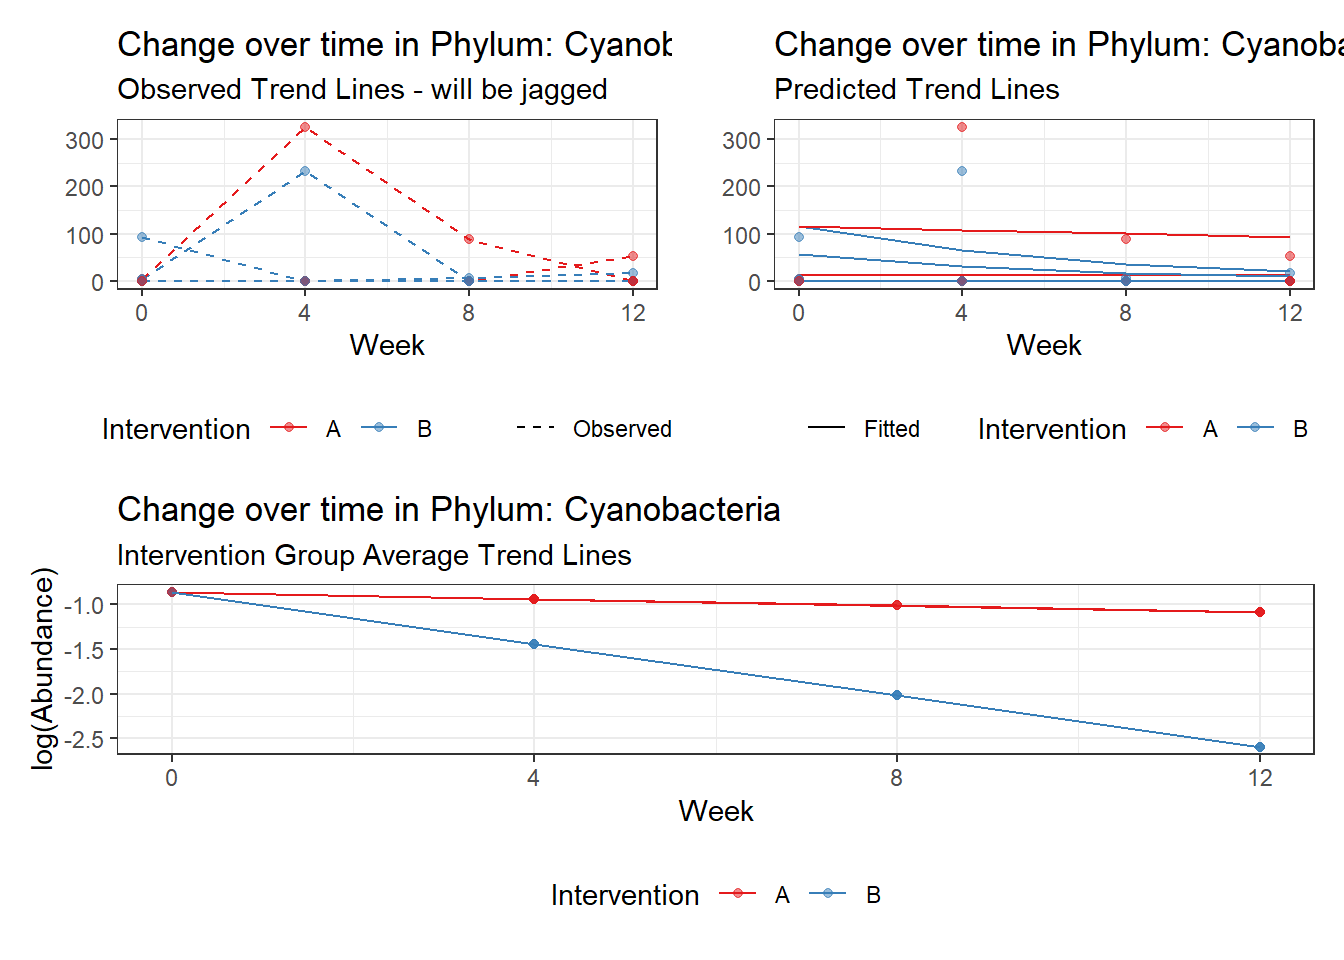
Intraclass Correlation (ICC): 8.624806e-12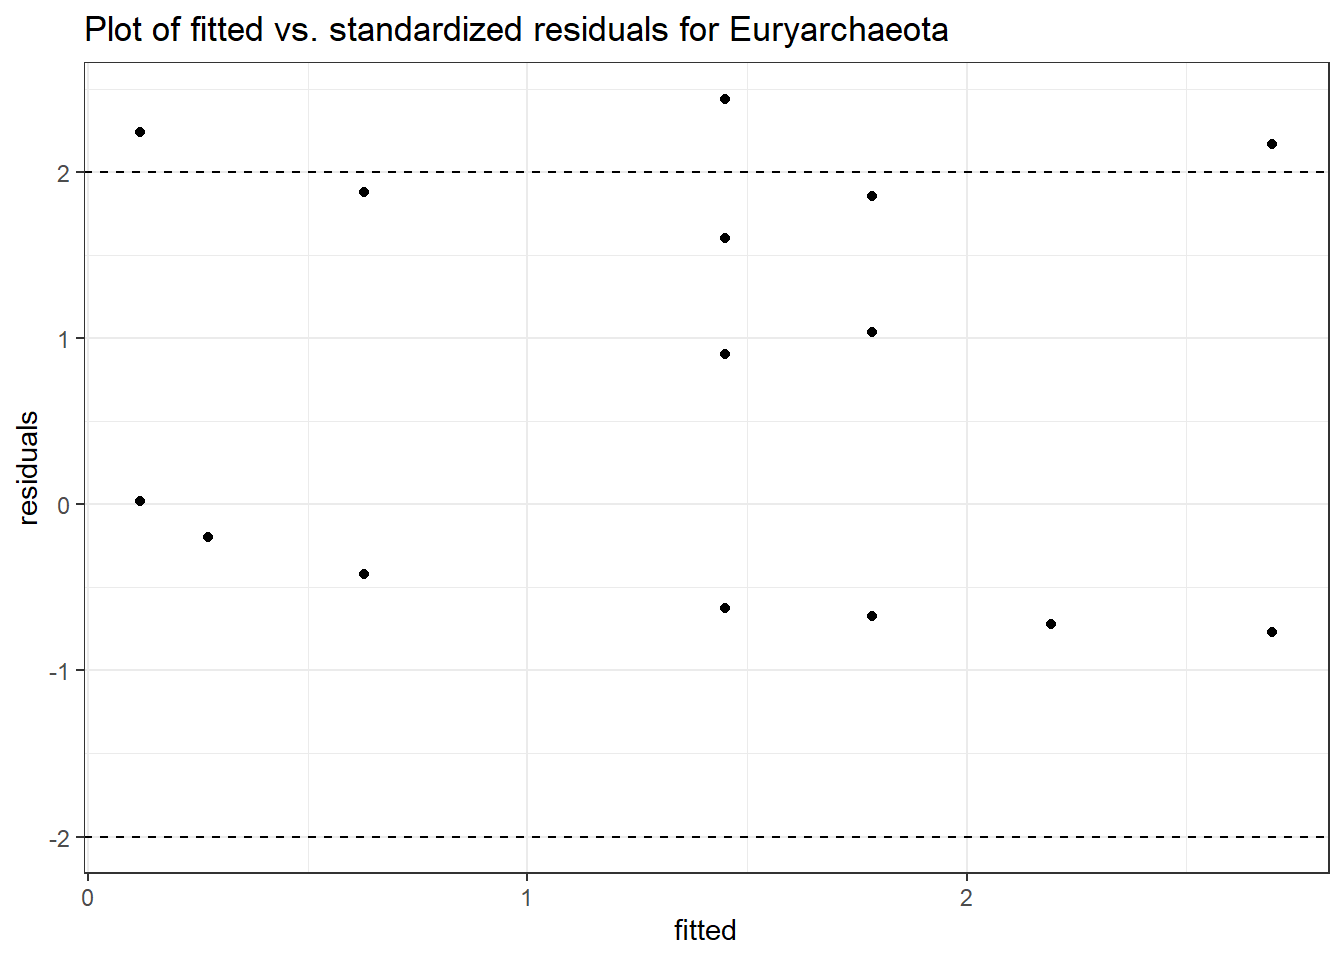

Fixed Effects (change in log)

                  Outcome Estimate Std. Error  z value Pr(>|z|)
(Intercept) Euryarchaeota  0.37213    0.74974  0.49634  0.61965
time        Euryarchaeota -0.83611    0.57406 -1.45647  0.14526
time:intB   Euryarchaeota  1.04268    0.61811  1.68688  0.09163


Random Effects (SD on log scale)

 Groups    Name        Std.Dev.
 SubjectID (Intercept) 2.9368e-06

Significance test not available for random effects

#########################################
#########################################
Model:  Firmicutes ~ 1 + time + intB:time + (1 | SubjectID)
<environment: 0x000000000acec120>

Link:    negbinom


Intraclass Correlation (ICC):   0.1204993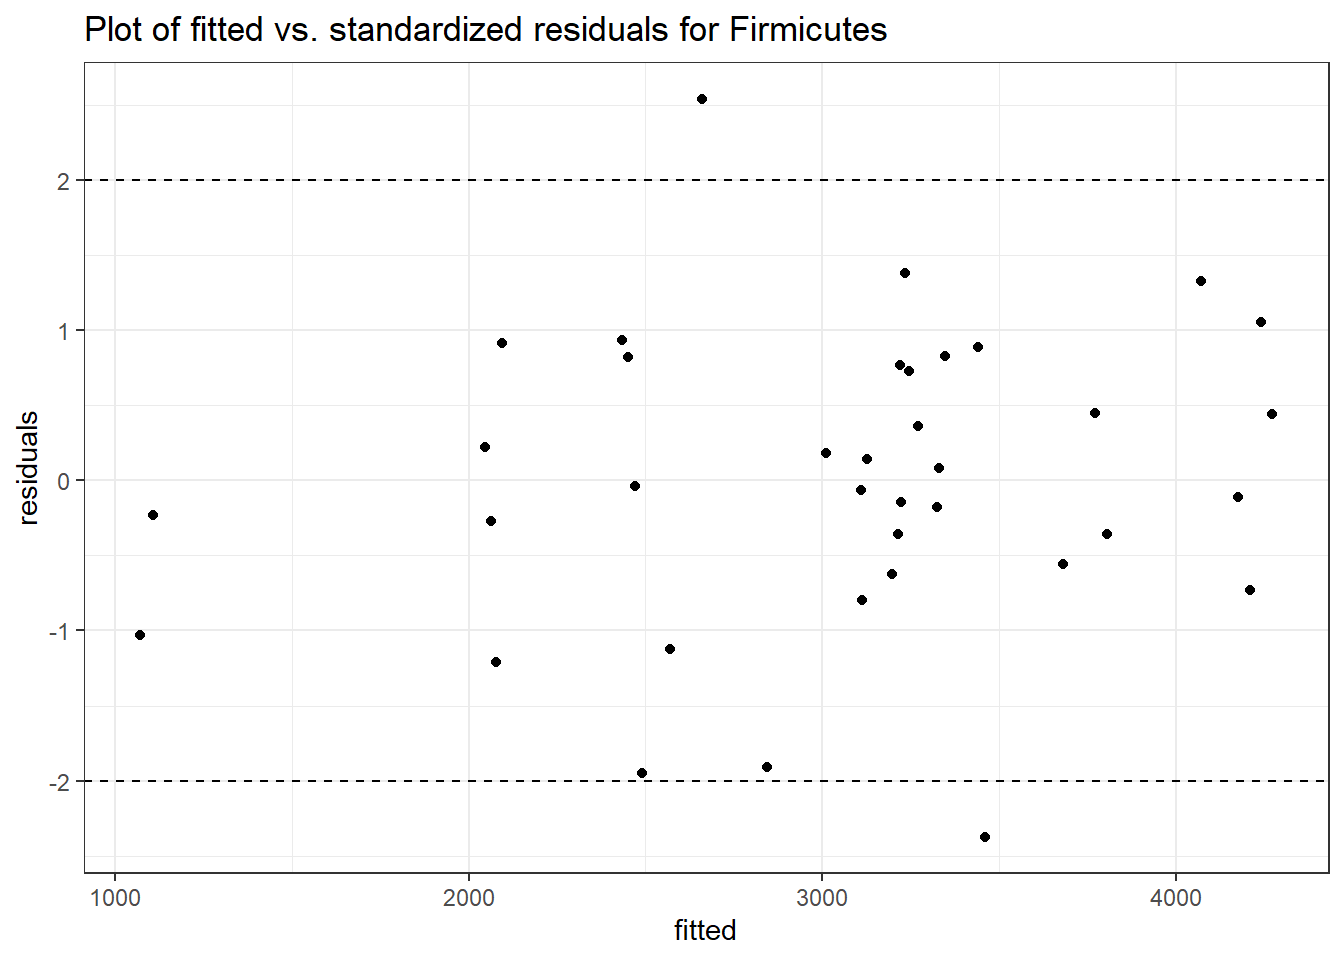

Fixed Effects (change in log)

               Outcome Estimate Std. Error  z value Pr(>|z|)
(Intercept) Firmicutes  7.92736    0.11904 66.59525  0.00000
time        Firmicutes  0.03379    0.03205  1.05435  0.29172
time:intB   Firmicutes -0.02624    0.04655 -0.56365  0.57300


Random Effects (SD on log scale)

 Groups    Name        Std.Dev.
 SubjectID (Intercept) 0.37015

Significance test not available for random effects

#########################################
#########################################
Model:  Lentisphaerae ~ 1 + time + intB:time + (1 | SubjectID)
<environment: 0x000000000acec120>

Link:    negbinom


Intraclass Correlation (ICC):   0.8255539
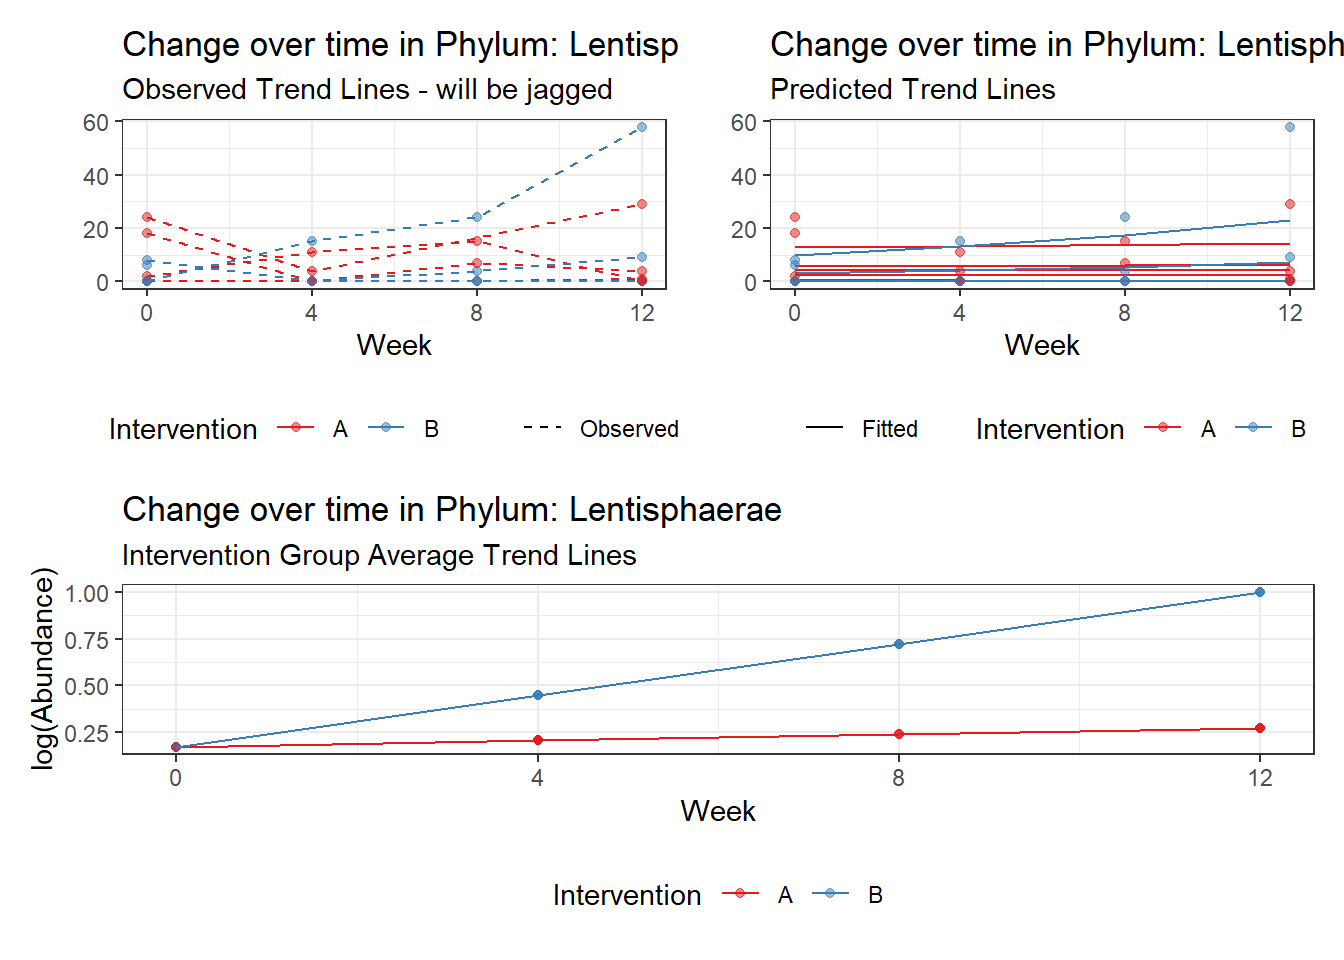
Fixed Effects (change in log)

                  Outcome Estimate Std. Error z value Pr(>|z|)
(Intercept) Lentisphaerae  0.17260    0.93378 0.18484  0.85336
time        Lentisphaerae  0.03298    0.36281 0.09089  0.92758
time:intB   Lentisphaerae  0.24276    0.50880 0.47713  0.63327


Random Effects (SD on log scale)

 Groups    Name        Std.Dev.
 SubjectID (Intercept) 2.1754

Significance test not available for random effects

#########################################
#########################################
Model:  Proteobacteria ~ 1 + time + intB:time + (1 | SubjectID)
<environment: 0x000000000acec120>

Link:    negbinom


Intraclass Correlation (ICC):   0.03896032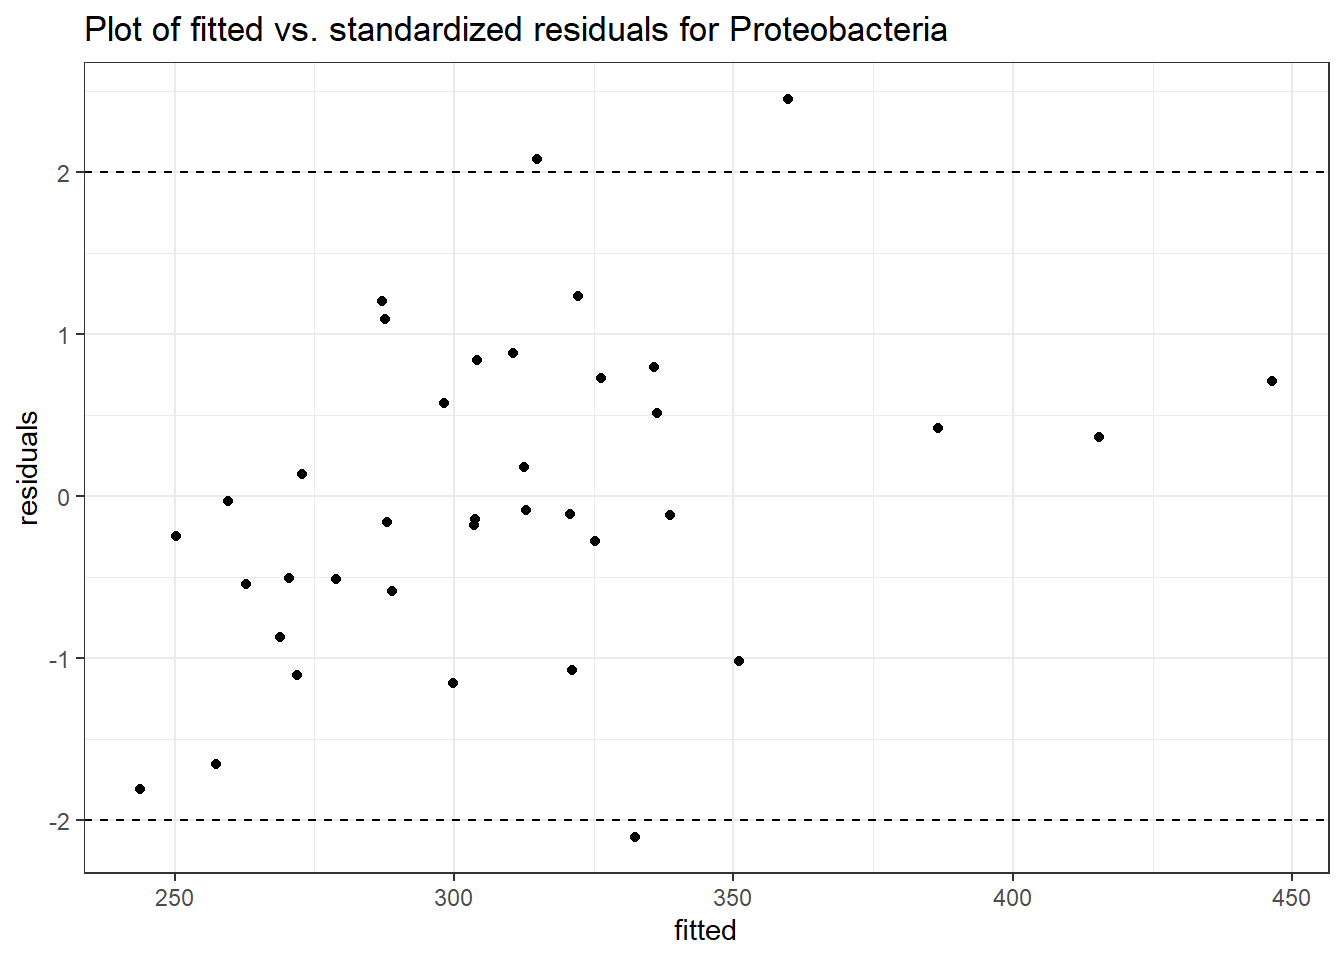
Fixed Effects (change in log)

                   Outcome Estimate Std. Error  z value Pr(>|z|)
(Intercept) Proteobacteria  5.81254    0.16322 35.61208  0.00000
time        Proteobacteria -0.07200    0.10958 -0.65702  0.51117
time:intB   Proteobacteria  0.01761    0.13093  0.13446  0.89304


Random Effects (SD on log scale)

 Groups    Name        Std.Dev.
 SubjectID (Intercept) 0.20134

Significance test not available for random effects

#########################################
#########################################
Model:  Tenericutes ~ 1 + time + intB:time + (1 | SubjectID)
<environment: 0x000000000acec120>

Link:    negbinom
boundary (singular) fit: see ?isSingular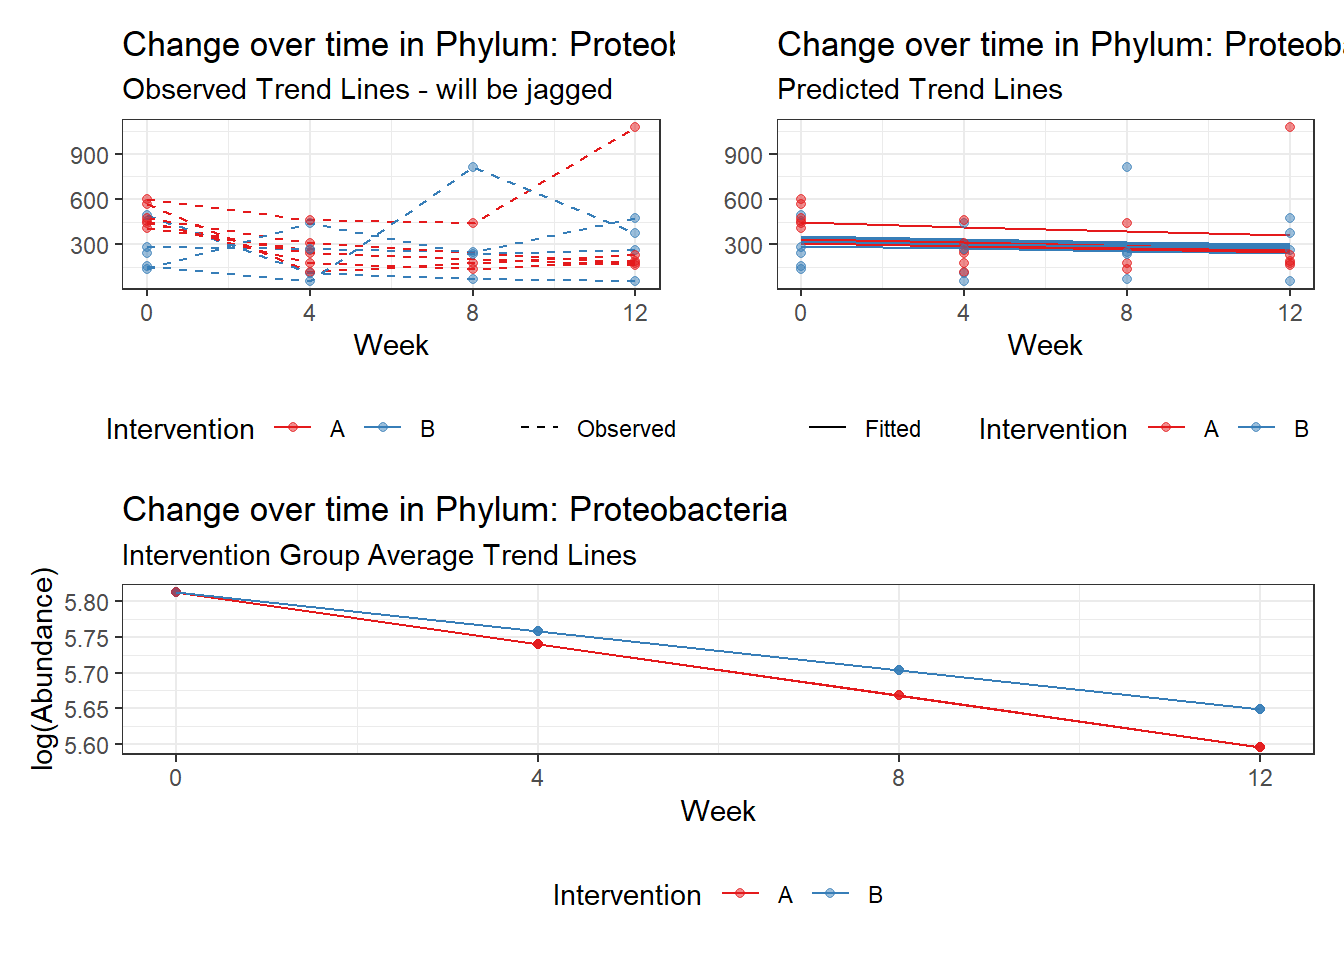
Intraclass Correlation (ICC): 6.796413e-11
Fixed Effects (change in log)

                Outcome Estimate Std. Error z value Pr(>|z|)
(Intercept) Tenericutes  2.57297    0.81255 3.16652  0.00154
time        Tenericutes  0.69072    0.53347 1.29475  0.19541
time:intB   Tenericutes  0.03490    0.57882 0.06029  0.95193


Random Effects (SD on log scale)

 Groups    Name        Std.Dev.
 SubjectID (Intercept) 8.244e-06

Significance test not available for random effects

#########################################
#########################################
Model:  Verrucomicrobia ~ 1 + time + intB:time + (1 | SubjectID)
<environment: 0x000000000acec120>

Link:    negbinom
boundary (singular) fit: see ?isSingular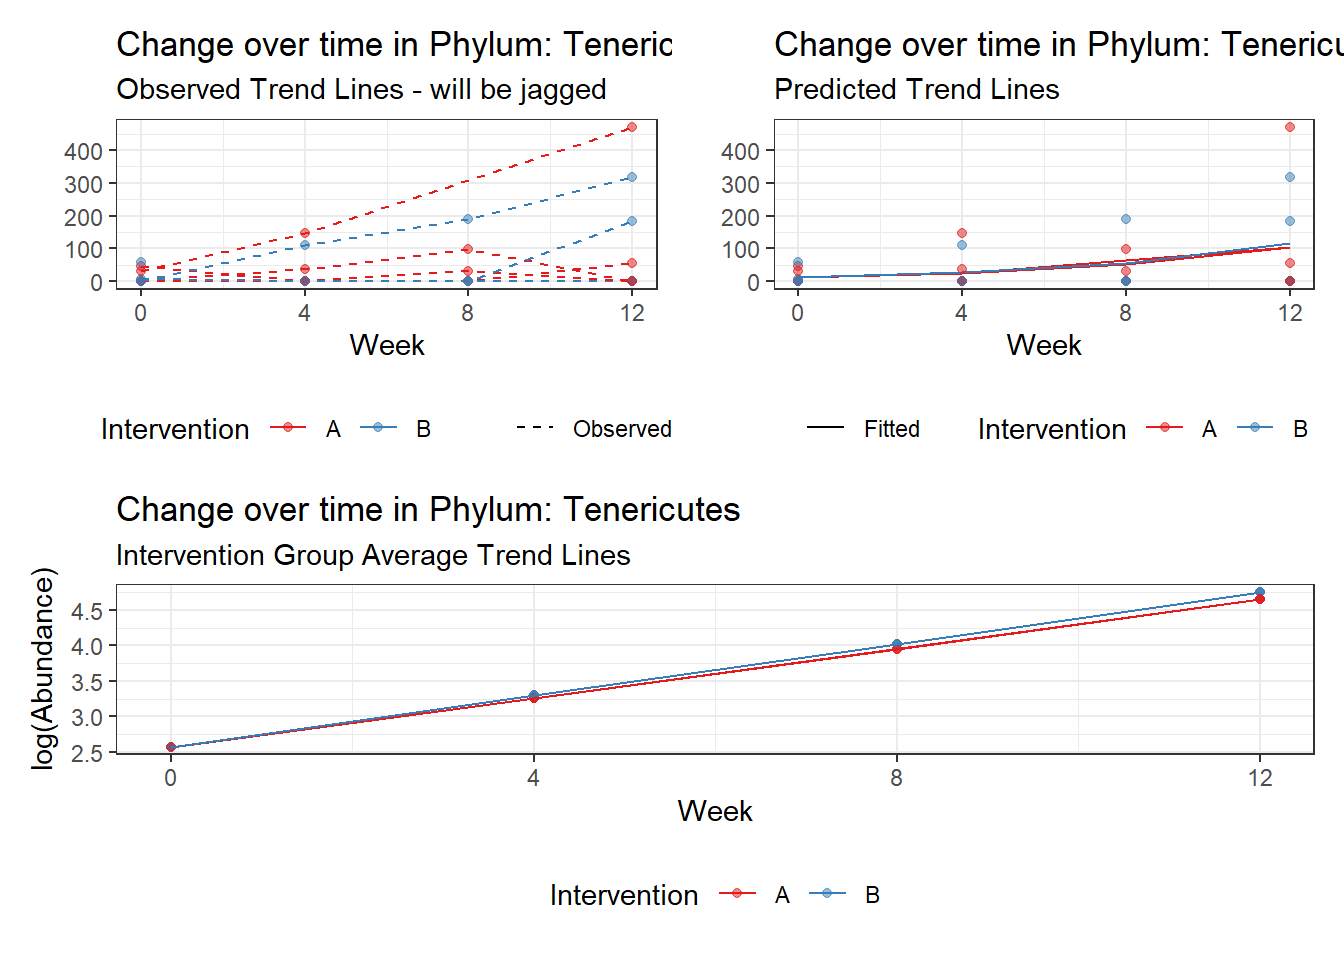
Intraclass Correlation (ICC): 8.057189e-12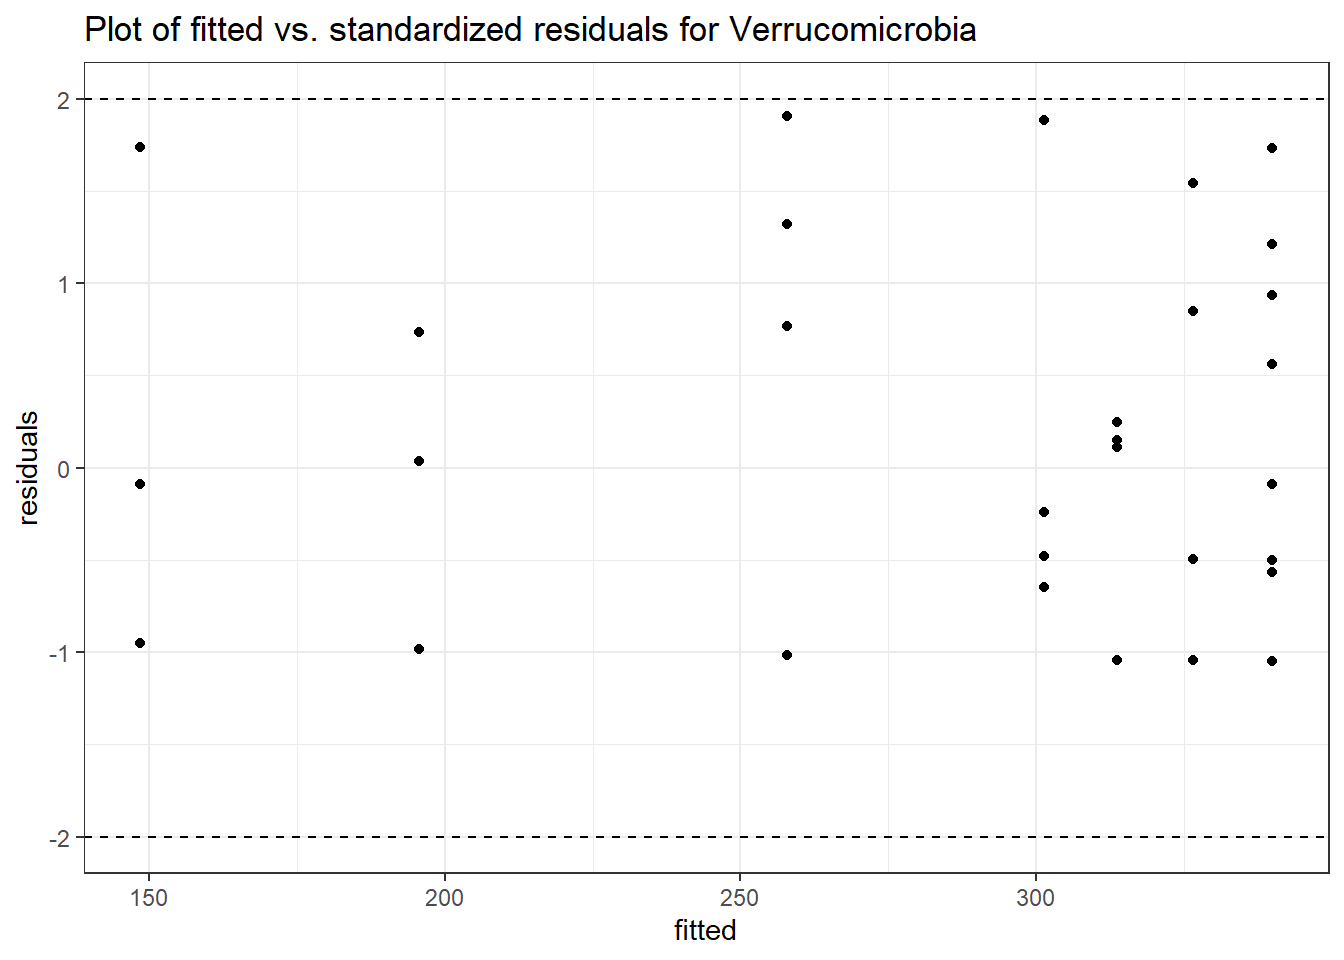
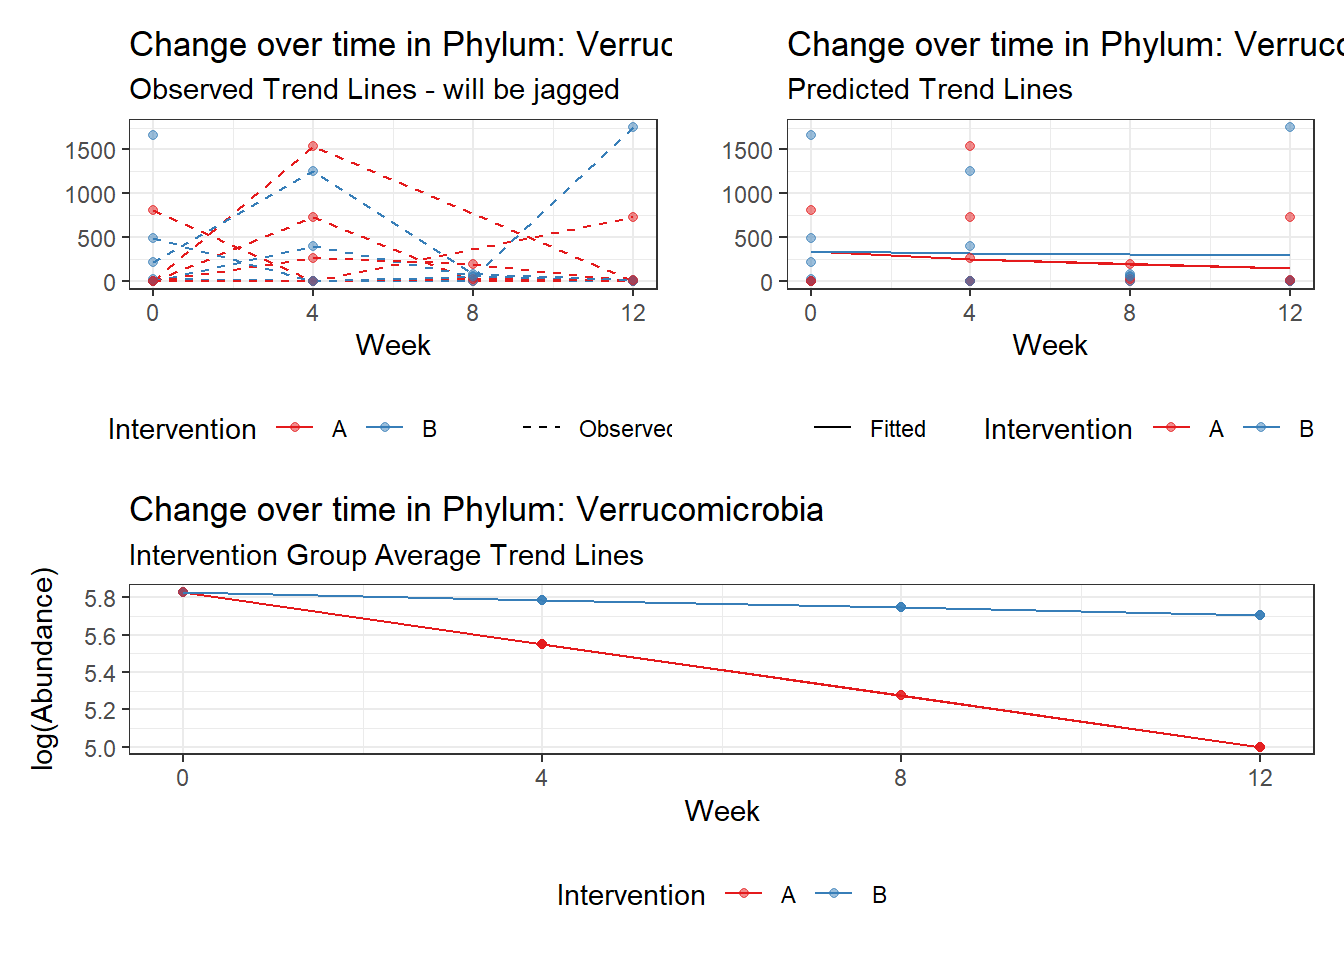
Fixed Effects (change in log)

                    Outcome Estimate Std. Error  z value Pr(>|z|)
(Intercept) Verrucomicrobia  5.82888    0.65482  8.90148  0.00000
time        Verrucomicrobia -0.27623    0.44654 -0.61860  0.53618
time:intB   Verrucomicrobia  0.23601    0.46789  0.50442  0.61397


Random Effects (SD on log scale)

 Groups    Name        Std.Dev.
 SubjectID (Intercept) 2.8385e-06

Significance test not available for random effects
Covariate(s): Time and Gender
\[\begin{align*} h\left(Y_{ij}\right)&=\beta_{0j} + \beta_{1j}(Week)_{ij} + r_{ij}\\ \beta_{0j}&= \gamma_{00} + \gamma_{01}(Gender)_{j} + u_{0j}\\ \beta_{1j}&= \gamma_{10} + \gamma_{11}(Intervention)_{j}\\ \end{align*}\]
phylum.fit7 <- glmm_microbiome(mydata=microbiome_data, model.number=7,
                               taxa.level="Phylum", link="poisson",
                               model="1 + time + intB:time + female + (1|SubjectID)")
#########################################
#########################################
Model:  Actinobacteria ~ 1 + time + intB:time + female + (1 | SubjectID)
<environment: 0x000000004aa9b788>

Link:    poisson


Intraclass Correlation (ICC):   0.4775383

Fixed Effects (change in log)

                   Outcome Estimate Std. Error z value Pr(>|z|)
(Intercept) Actinobacteria  2.47224    0.48834 5.06255  0.00000
time        Actinobacteria  0.09026    0.04833 1.86767  0.06181
female      Actinobacteria  0.10018    0.60971 0.16431  0.86949
time:intB   Actinobacteria  0.14736    0.06217 2.37020  0.01778


Random Effects (SD on log scale)

 Groups    Name        Std.Dev.
 SubjectID (Intercept) 0.95604

Significance test not available for random effects

#########################################
#########################################
Model:  Bacteroidetes ~ 1 + time + intB:time + female + (1 | SubjectID)
<environment: 0x000000004aa9b788>

Link:    poisson


Intraclass Correlation (ICC):   0.1040945

Fixed Effects (change in log)

                  Outcome Estimate Std. Error  z value Pr(>|z|)
(Intercept) Bacteroidetes  8.43685    0.17052 49.47786  0.00000
time        Bacteroidetes -0.02172    0.00363 -5.98163  0.00000
female      Bacteroidetes -0.67250    0.21378 -3.14578  0.00166
time:intB   Bacteroidetes -0.02260    0.00531 -4.25457  0.00002


Random Effects (SD on log scale)

 Groups    Name        Std.Dev.
 SubjectID (Intercept) 0.34087

Significance test not available for random effects

#########################################
#########################################
Model:  Cyanobacteria ~ 1 + time + intB:time + female + (1 | SubjectID)
<environment: 0x000000004aa9b788>

Link:    poisson


Intraclass Correlation (ICC):   0.9508193
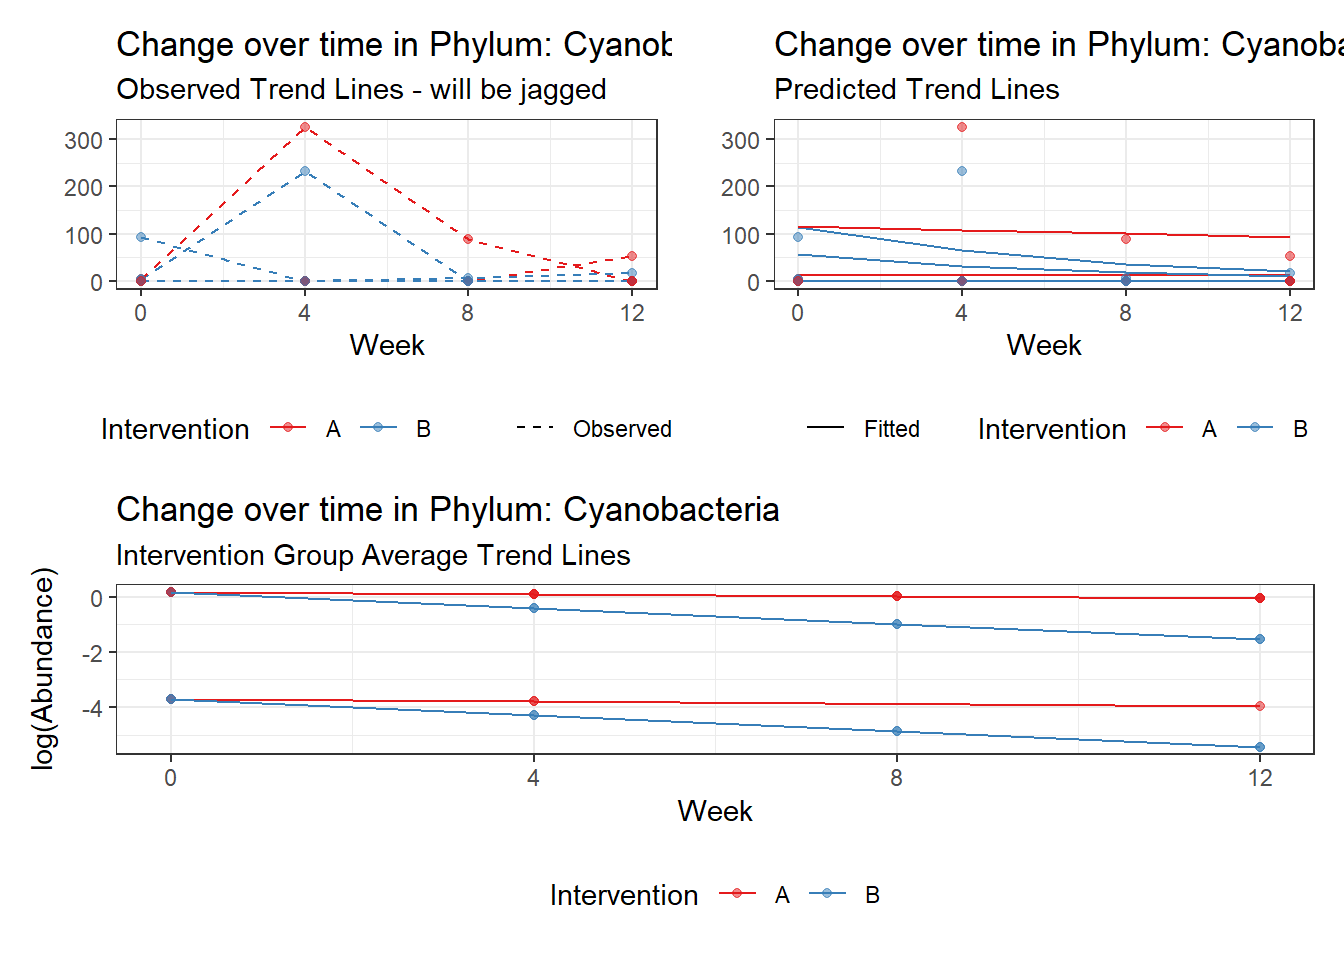
Fixed Effects (change in log)

                  Outcome Estimate Std. Error  z value Pr(>|z|)
(Intercept) Cyanobacteria -3.72197    3.18000 -1.17043  0.24183
time        Cyanobacteria -0.07536    0.04112 -1.83249  0.06688
female      Cyanobacteria  3.88290    3.35921  1.15590  0.24772
time:intB   Cyanobacteria -0.49441    0.06784 -7.28822  0.00000


Random Effects (SD on log scale)

 Groups    Name        Std.Dev.
 SubjectID (Intercept) 4.3969

Significance test not available for random effects

#########################################
#########################################
Model:  Euryarchaeota ~ 1 + time + intB:time + female + (1 | SubjectID)
<environment: 0x000000004aa9b788>

Link:    poisson


Intraclass Correlation (ICC):   0.6687562

Fixed Effects (change in log)

                  Outcome Estimate Std. Error  z value Pr(>|z|)
(Intercept) Euryarchaeota -2.39191    1.28250 -1.86504  0.06218
time        Euryarchaeota -0.35885    0.40875 -0.87793  0.37998
female      Euryarchaeota  2.45898    1.27554  1.92779  0.05388
time:intB   Euryarchaeota  0.39324    0.44285  0.88797  0.37455


Random Effects (SD on log scale)

 Groups    Name        Std.Dev.
 SubjectID (Intercept) 1.4209

Significance test not available for random effects

#########################################
#########################################
Model:  Firmicutes ~ 1 + time + intB:time + female + (1 | SubjectID)
<environment: 0x000000004aa9b788>

Link:    poisson


Intraclass Correlation (ICC):   0.05870396
Fixed Effects (change in log)

               Outcome Estimate Std. Error  z value Pr(>|z|)
(Intercept) Firmicutes  7.52585    0.12513 60.14556    0e+00
time        Firmicutes  0.03449    0.00352  9.79702    0e+00
female      Firmicutes  0.62236    0.15675  3.97033    7e-05
time:intB   Firmicutes -0.01847    0.00538 -3.43189    6e-04


Random Effects (SD on log scale)

 Groups    Name        Std.Dev.
 SubjectID (Intercept) 0.24973

Significance test not available for random effects

#########################################
#########################################
Model:  Lentisphaerae ~ 1 + time + intB:time + female + (1 | SubjectID)
<environment: 0x000000004aa9b788>

Link:    poisson
Warning in checkConv(attr(opt, "derivs"), opt$par, ctrl = control$checkConv, :
unable to evaluate scaled gradientWarning in checkConv(attr(opt, "derivs"), opt$par, ctrl = control$checkConv, :
Model failed to converge: degenerate Hessian with 1 negative eigenvalues
Intraclass Correlation (ICC): 0.3584695
Warning in vcov.merMod(object, use.hessian = use.hessian): variance-covariance matrix computed from finite-difference Hessian is
not positive definite or contains NA values: falling back to var-cov estimated from RX
Warning in vcov.merMod(object, correlation = correlation, sigm = sig): variance-covariance matrix computed from finite-difference Hessian is
not positive definite or contains NA values: falling back to var-cov estimated from RX
Fixed Effects (change in log)

                  Outcome  Estimate Std. Error  z value Pr(>|z|)
(Intercept) Lentisphaerae -19.14196 2412.87711 -0.00793  0.99367
time        Lentisphaerae   0.00049    0.07813  0.00633  0.99495
female      Lentisphaerae  20.76479 2412.87712  0.00861  0.99313
time:intB   Lentisphaerae   0.69748    0.11882  5.87025  0.00000


Random Effects (SD on log scale)

 Groups    Name        Std.Dev.
 SubjectID (Intercept) 0.74751

Significance test not available for random effects

#########################################
#########################################
Model:  Proteobacteria ~ 1 + time + intB:time + female + (1 | SubjectID)
<environment: 0x000000004aa9b788>

Link:    poisson


Intraclass Correlation (ICC):   0.1059356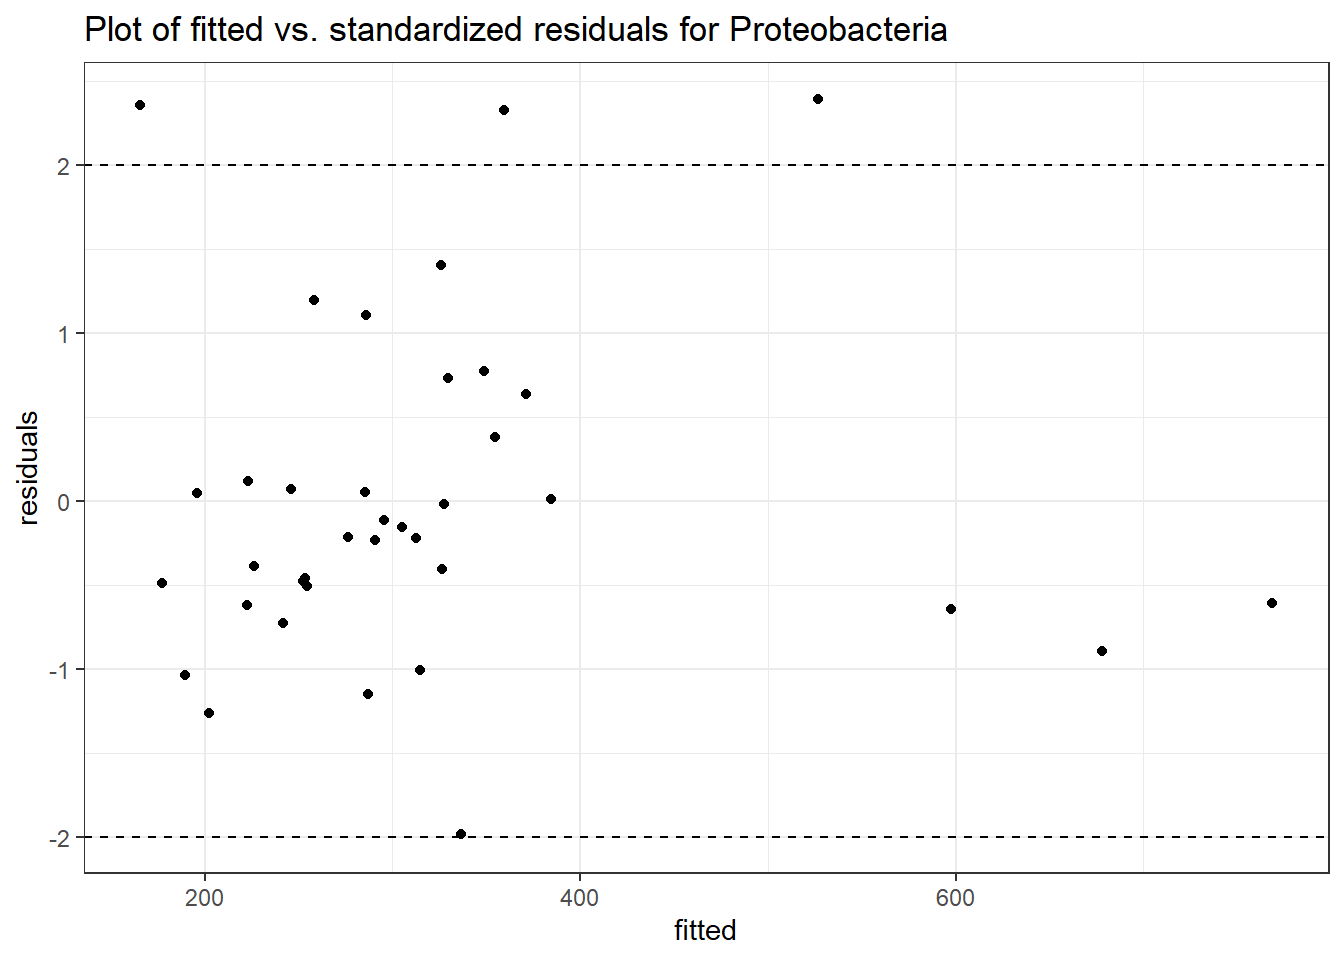

Fixed Effects (change in log)

                   Outcome Estimate Std. Error   z value Pr(>|z|)
(Intercept) Proteobacteria  5.60737    0.17337  32.34425  0.00000
time        Proteobacteria -0.12587    0.01087 -11.57691  0.00000
female      Proteobacteria  0.21288    0.21695   0.98122  0.32648
time:intB   Proteobacteria  0.19271    0.01723  11.18713  0.00000


Random Effects (SD on log scale)

 Groups    Name        Std.Dev.
 SubjectID (Intercept) 0.34422

Significance test not available for random effects

#########################################
#########################################
Model:  Tenericutes ~ 1 + time + intB:time + female + (1 | SubjectID)
<environment: 0x000000004aa9b788>

Link:    poisson


Intraclass Correlation (ICC):   0.5427045
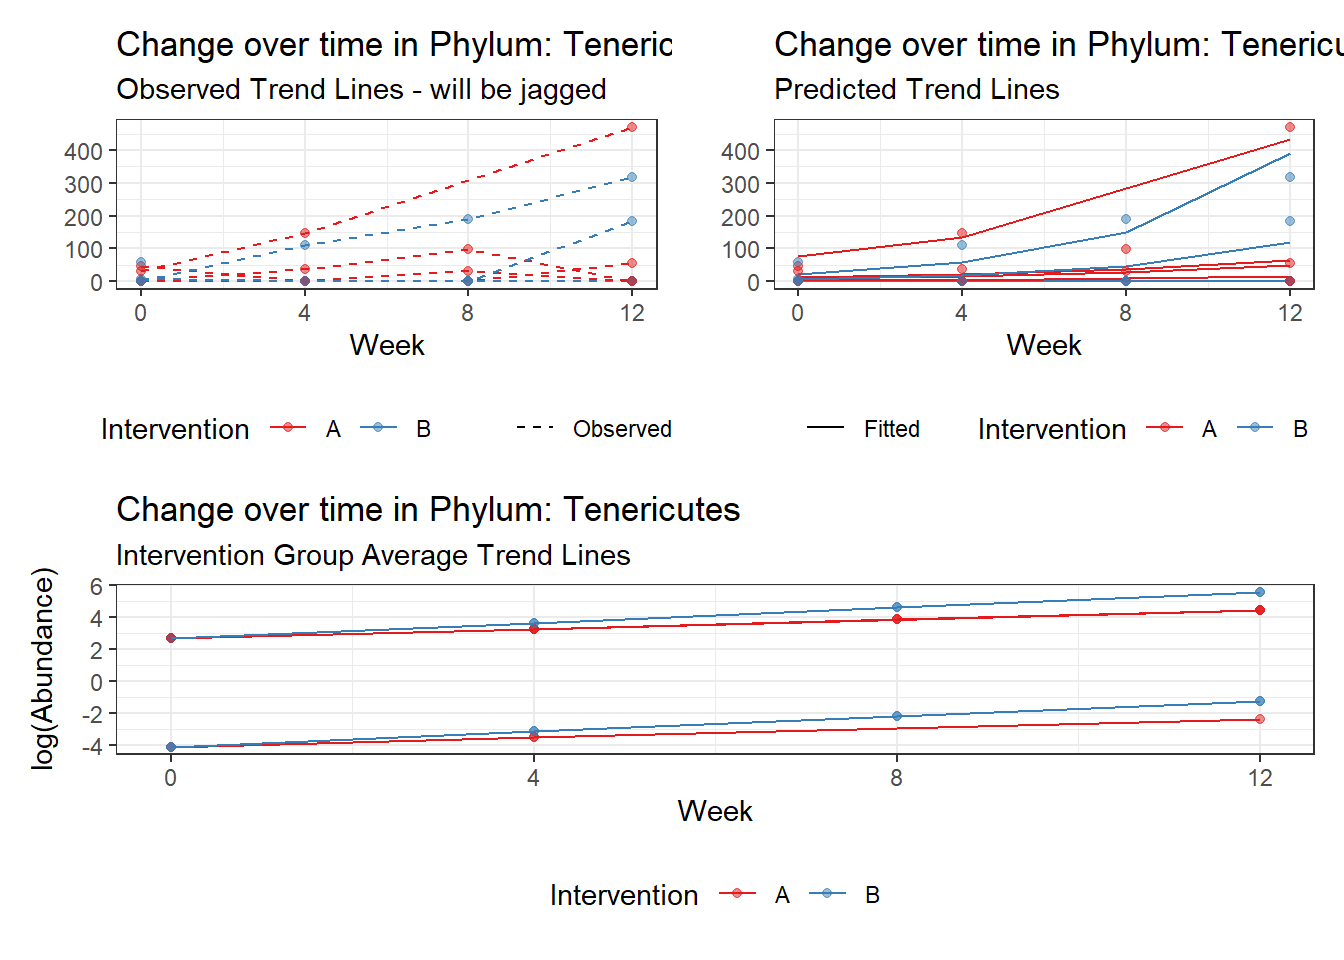
Fixed Effects (change in log)

                Outcome Estimate Std. Error  z value Pr(>|z|)
(Intercept) Tenericutes -4.08068    1.04917 -3.88942    1e-04
time        Tenericutes  0.58101    0.03014 19.27542    0e+00
female      Tenericutes  6.78313    1.12532  6.02774    0e+00
time:intB   Tenericutes  0.37468    0.05251  7.13563    0e+00


Random Effects (SD on log scale)

 Groups    Name        Std.Dev.
 SubjectID (Intercept) 1.0894

Significance test not available for random effects

#########################################
#########################################
Model:  Verrucomicrobia ~ 1 + time + intB:time + female + (1 | SubjectID)
<environment: 0x000000004aa9b788>

Link:    poisson


Intraclass Correlation (ICC):   0.8231144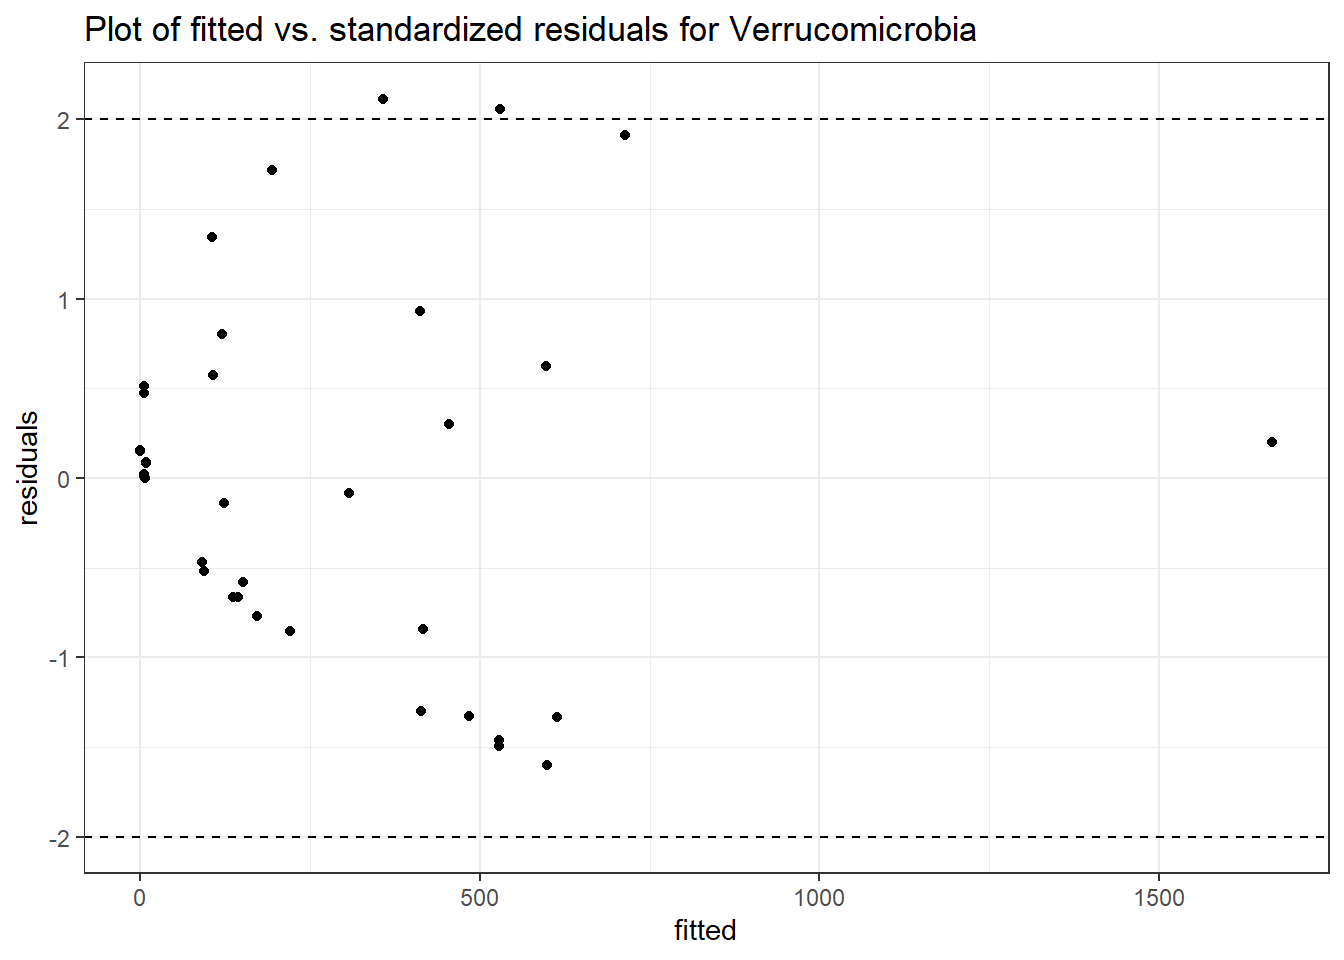

Fixed Effects (change in log)

                    Outcome Estimate Std. Error  z value Pr(>|z|)
(Intercept) Verrucomicrobia  2.84073    1.11205  2.55450  0.01063
time        Verrucomicrobia -0.12326    0.01296 -9.50863  0.00000
female      Verrucomicrobia  2.59757    1.37874  1.88402  0.05956
time:intB   Verrucomicrobia  0.27369    0.01882 14.53922  0.00000


Random Effects (SD on log scale)

 Groups    Name        Std.Dev.
 SubjectID (Intercept) 2.1572

Significance test not available for random effects
phylum.fit7b <- glmm_microbiome(mydata=microbiome_data, model.number=7,
taxa.level="Phylum", link="negbinom",
model="1 + time + intB:time + female + (1|SubjectID)")
#########################################
#########################################
Model:  Actinobacteria ~ 1 + time + intB:time + female + (1 | SubjectID)
<environment: 0x000000004d965328>

Link:    negbinom


Intraclass Correlation (ICC):   0.317027
Fixed Effects (change in log)

                   Outcome Estimate Std. Error z value Pr(>|z|)
(Intercept) Actinobacteria  2.45484    0.55600 4.41515  0.00001
time        Actinobacteria  0.02574    0.23155 0.11117  0.91149
female      Actinobacteria  0.09776    0.62458 0.15653  0.87562
time:intB   Actinobacteria  0.36913    0.29757 1.24048  0.21480


Random Effects (SD on log scale)

 Groups    Name        Std.Dev.
 SubjectID (Intercept) 0.68131

Significance test not available for random effects

#########################################
#########################################
Model:  Bacteroidetes ~ 1 + time + intB:time + female + (1 | SubjectID)
<environment: 0x000000004d965328>

Link:    negbinom
Error in factory(refitNB, types = c("message", "warning"))(lastfit, theta = exp(t), : Downdated VtV is not positive definite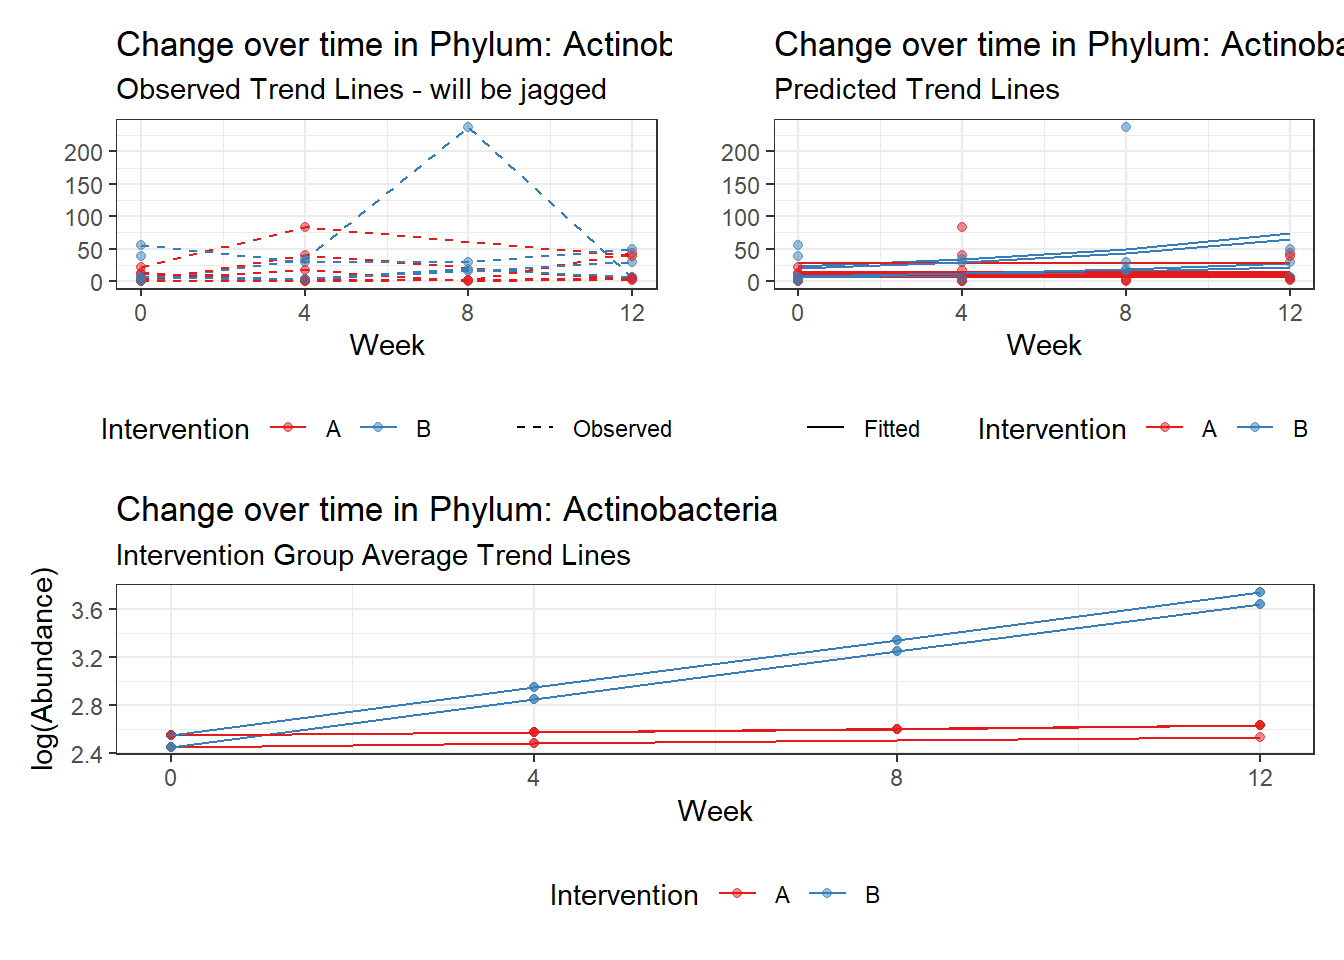
Covariate(s): Time and Ethnicity
\[\begin{align*} h\left(Y_{ij}\right)&=\beta_{0j} + \beta_{1j}(Week)_{ij} + r_{ij}\\ \beta_{0j}&= \gamma_{00} + \gamma_{01}(Ethnicity)_{j} + u_{0j}\\ \beta_{1j}&= \gamma_{10} + \gamma_{11}(Intervention)_{j}\\ \end{align*}\]
phylum.fit8 <- glmm_microbiome(mydata=microbiome_data, model.number=8,
                               taxa.level="Phylum", link="poisson",
                               model="1 + time + intB:time + hispanic + (1|SubjectID)")
#########################################
#########################################
Model:  Actinobacteria ~ 1 + time + intB:time + hispanic + (1 | SubjectID)
<environment: 0x000000004dc96ee0>

Link:    poisson


Intraclass Correlation (ICC):   0.4638933

Fixed Effects (change in log)

                   Outcome Estimate Std. Error z value Pr(>|z|)
(Intercept) Actinobacteria  2.21500    0.47943 4.62002  0.00000
time        Actinobacteria  0.09227    0.04834 1.90855  0.05632
hispanic    Actinobacteria  0.50204    0.59533 0.84330  0.39906
time:intB   Actinobacteria  0.14467    0.06212 2.32877  0.01987


Random Effects (SD on log scale)

 Groups    Name        Std.Dev.
 SubjectID (Intercept) 0.93022

Significance test not available for random effects

#########################################
#########################################
Model:  Bacteroidetes ~ 1 + time + intB:time + hispanic + (1 | SubjectID)
<environment: 0x000000004dc96ee0>

Link:    poisson


Intraclass Correlation (ICC):   0.1637301

Fixed Effects (change in log)

                  Outcome Estimate Std. Error  z value Pr(>|z|)
(Intercept) Bacteroidetes  8.22001    0.22132 37.14023  0.00000
time        Bacteroidetes -0.02184    0.00363 -6.01613  0.00000
hispanic    Bacteroidetes -0.33195    0.27745 -1.19644  0.23153
time:intB   Bacteroidetes -0.02242    0.00531 -4.22000  0.00002


Random Effects (SD on log scale)

 Groups    Name        Std.Dev.
 SubjectID (Intercept) 0.44248

Significance test not available for random effects

#########################################
#########################################
Model:  Cyanobacteria ~ 1 + time + intB:time + hispanic + (1 | SubjectID)
<environment: 0x000000004dc96ee0>

Link:    poisson


Intraclass Correlation (ICC):   0.9381629

Fixed Effects (change in log)

                  Outcome Estimate Std. Error  z value Pr(>|z|)
(Intercept) Cyanobacteria -2.48209    2.47550 -1.00266  0.31602
time        Cyanobacteria -0.07468    0.04113 -1.81560  0.06943
hispanic    Cyanobacteria  2.78475    2.80609  0.99239  0.32101
time:intB   Cyanobacteria -0.49553    0.06783 -7.30498  0.00000


Random Effects (SD on log scale)

 Groups    Name        Std.Dev.
 SubjectID (Intercept) 3.8951

Significance test not available for random effects

#########################################
#########################################
Model:  Euryarchaeota ~ 1 + time + intB:time + hispanic + (1 | SubjectID)
<environment: 0x000000004dc96ee0>

Link:    poisson


Intraclass Correlation (ICC):   0.5990631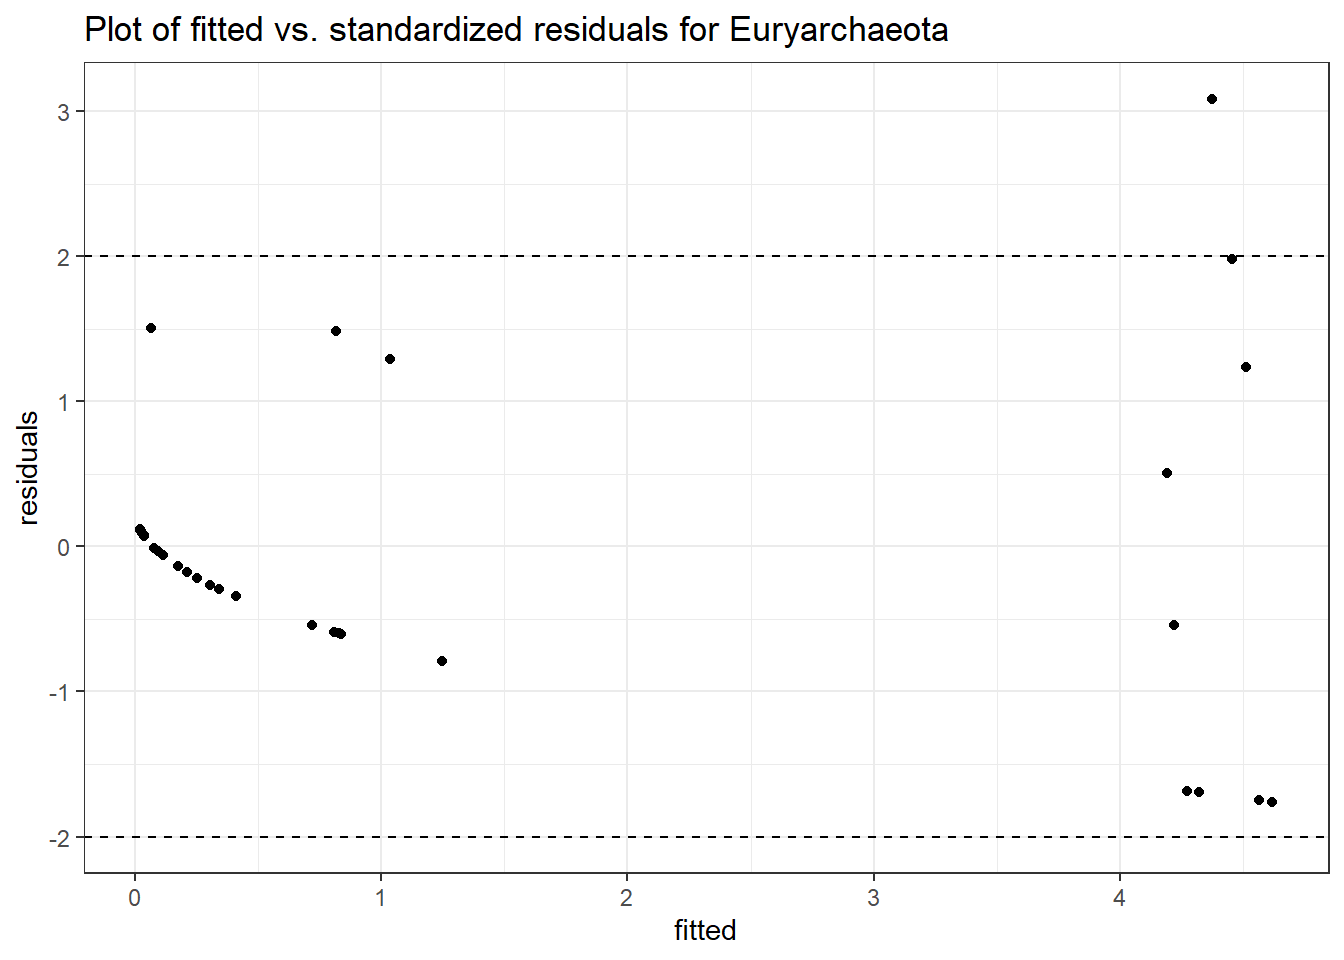
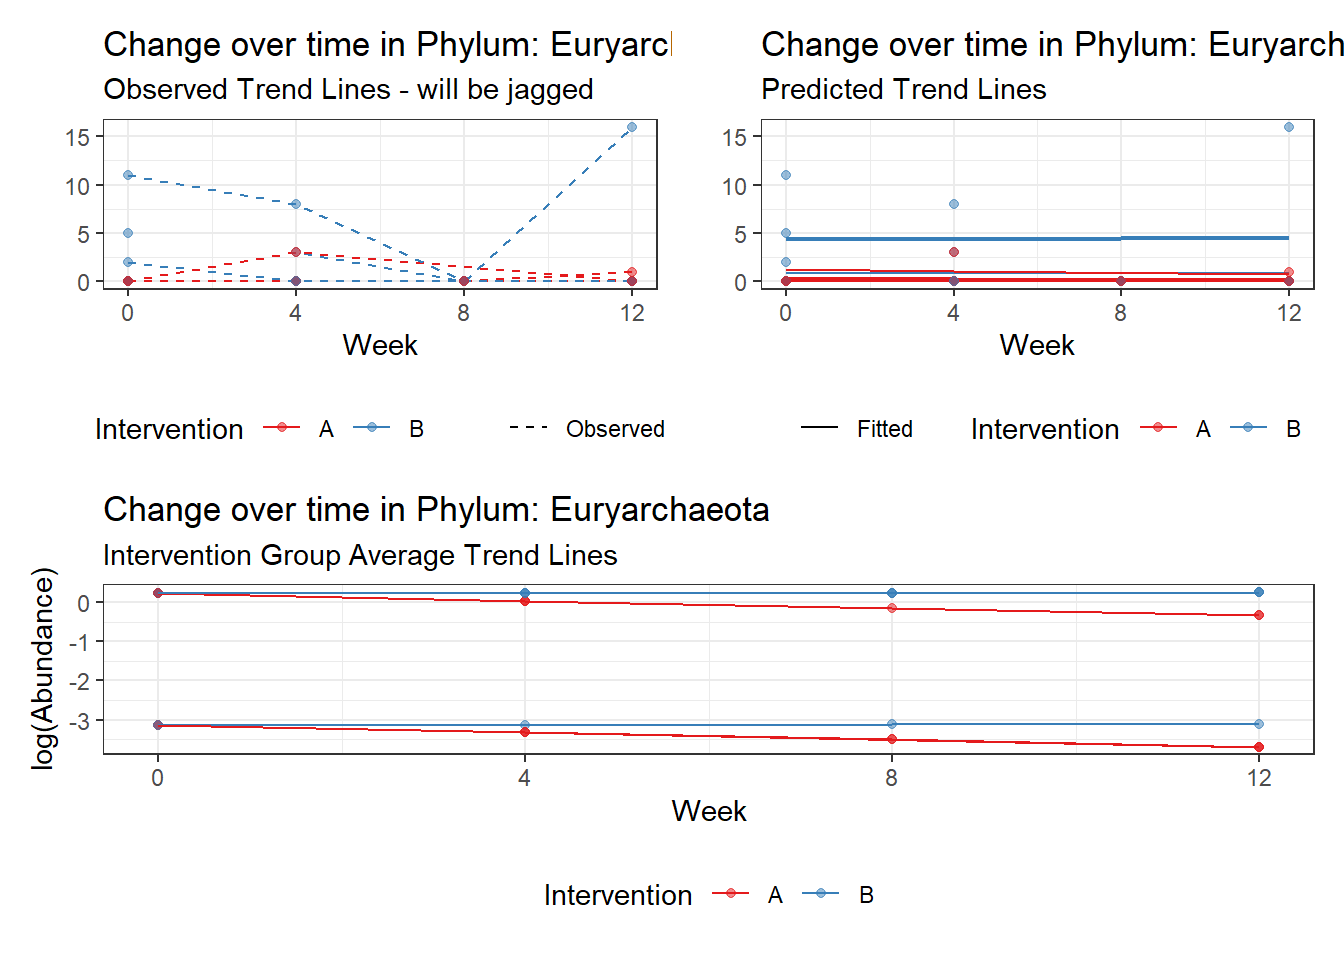
Fixed Effects (change in log)

                  Outcome Estimate Std. Error  z value Pr(>|z|)
(Intercept) Euryarchaeota -3.14003    1.39179 -2.25611  0.02406
time        Euryarchaeota -0.18300    0.38038 -0.48110  0.63045
hispanic    Euryarchaeota  3.36362    1.38916  2.42134  0.01546
time:intB   Euryarchaeota  0.19488    0.40370  0.48275  0.62928


Random Effects (SD on log scale)

 Groups    Name        Std.Dev.
 SubjectID (Intercept) 1.2224

Significance test not available for random effects

#########################################
#########################################
Model:  Firmicutes ~ 1 + time + intB:time + hispanic + (1 | SubjectID)
<environment: 0x000000004dc96ee0>

Link:    poisson


Intraclass Correlation (ICC):   0.1311736
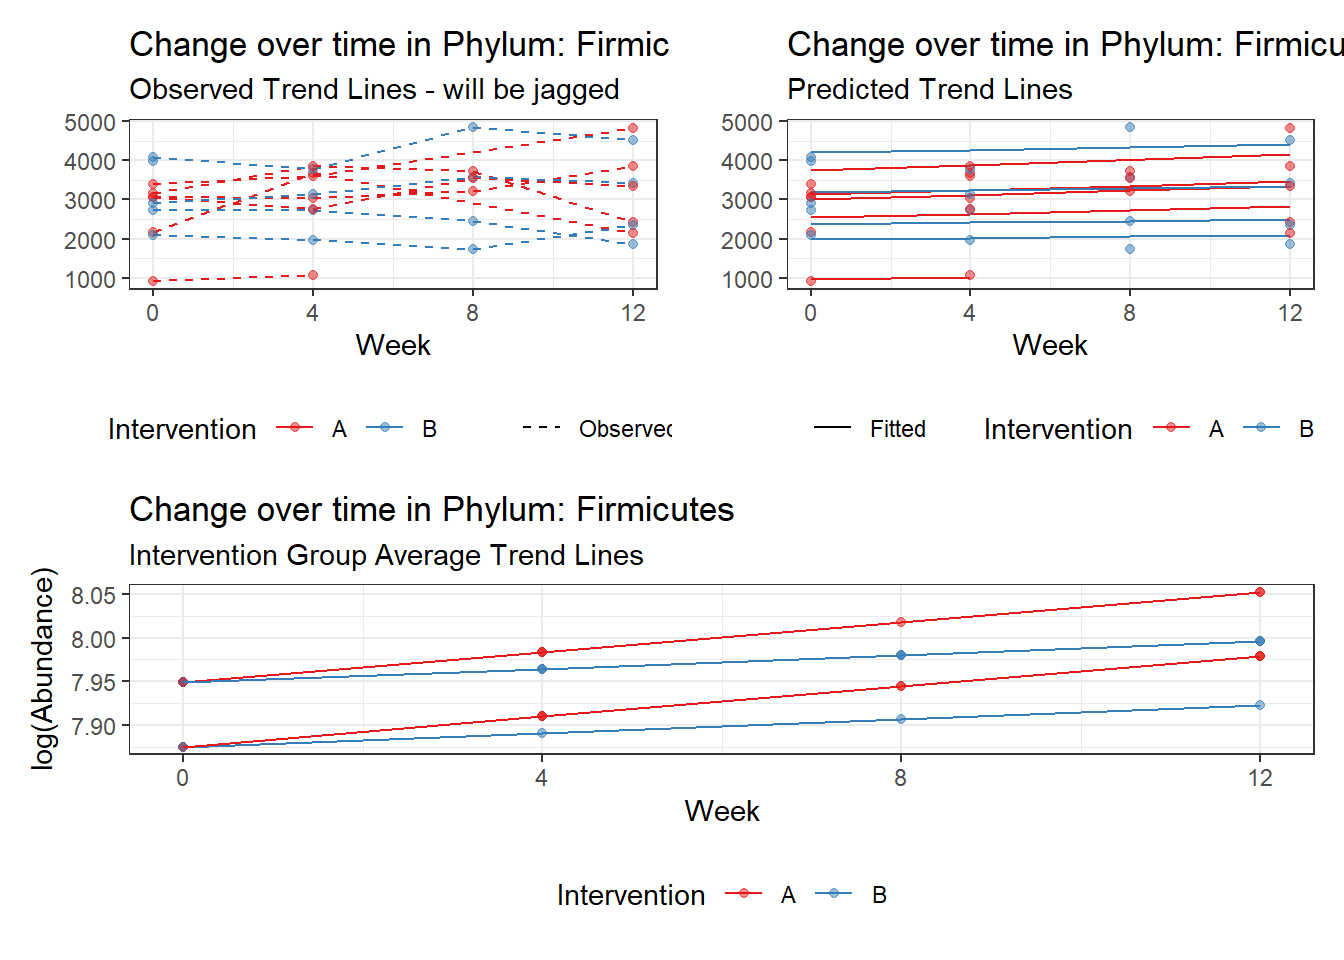
Fixed Effects (change in log)

               Outcome Estimate Std. Error  z value Pr(>|z|)
(Intercept) Firmicutes  7.87502    0.19439 40.51150  0.00000
time        Firmicutes  0.03458    0.00352  9.82039  0.00000
hispanic    Firmicutes  0.07358    0.24366  0.30197  0.76268
time:intB   Firmicutes -0.01873    0.00538 -3.47835  0.00050


Random Effects (SD on log scale)

 Groups    Name        Std.Dev.
 SubjectID (Intercept) 0.38856

Significance test not available for random effects

#########################################
#########################################
Model:  Lentisphaerae ~ 1 + time + intB:time + hispanic + (1 | SubjectID)
<environment: 0x000000004dc96ee0>

Link:    poisson


Intraclass Correlation (ICC):   0.8737105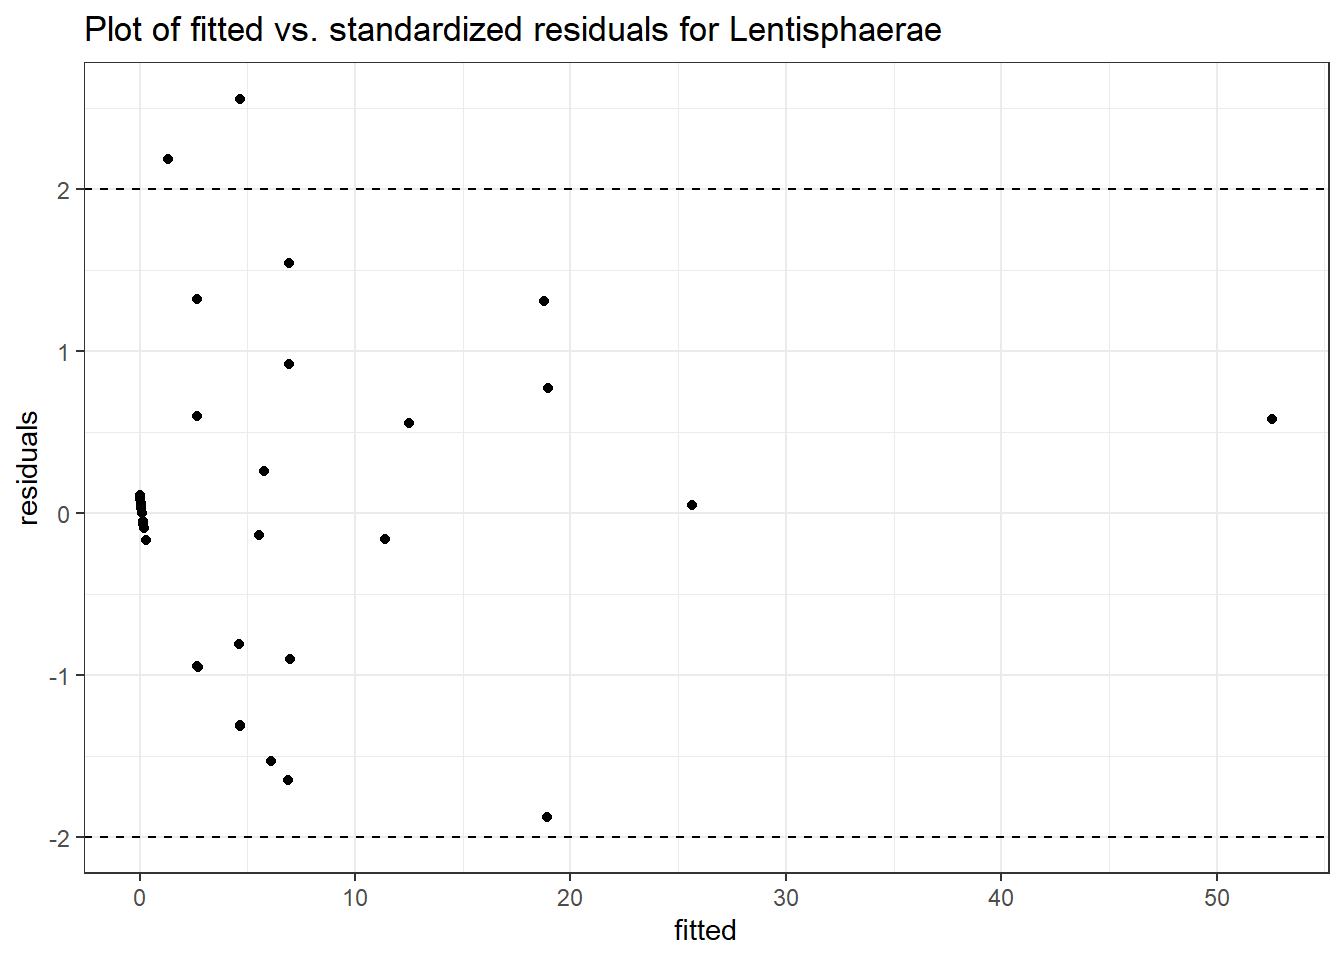
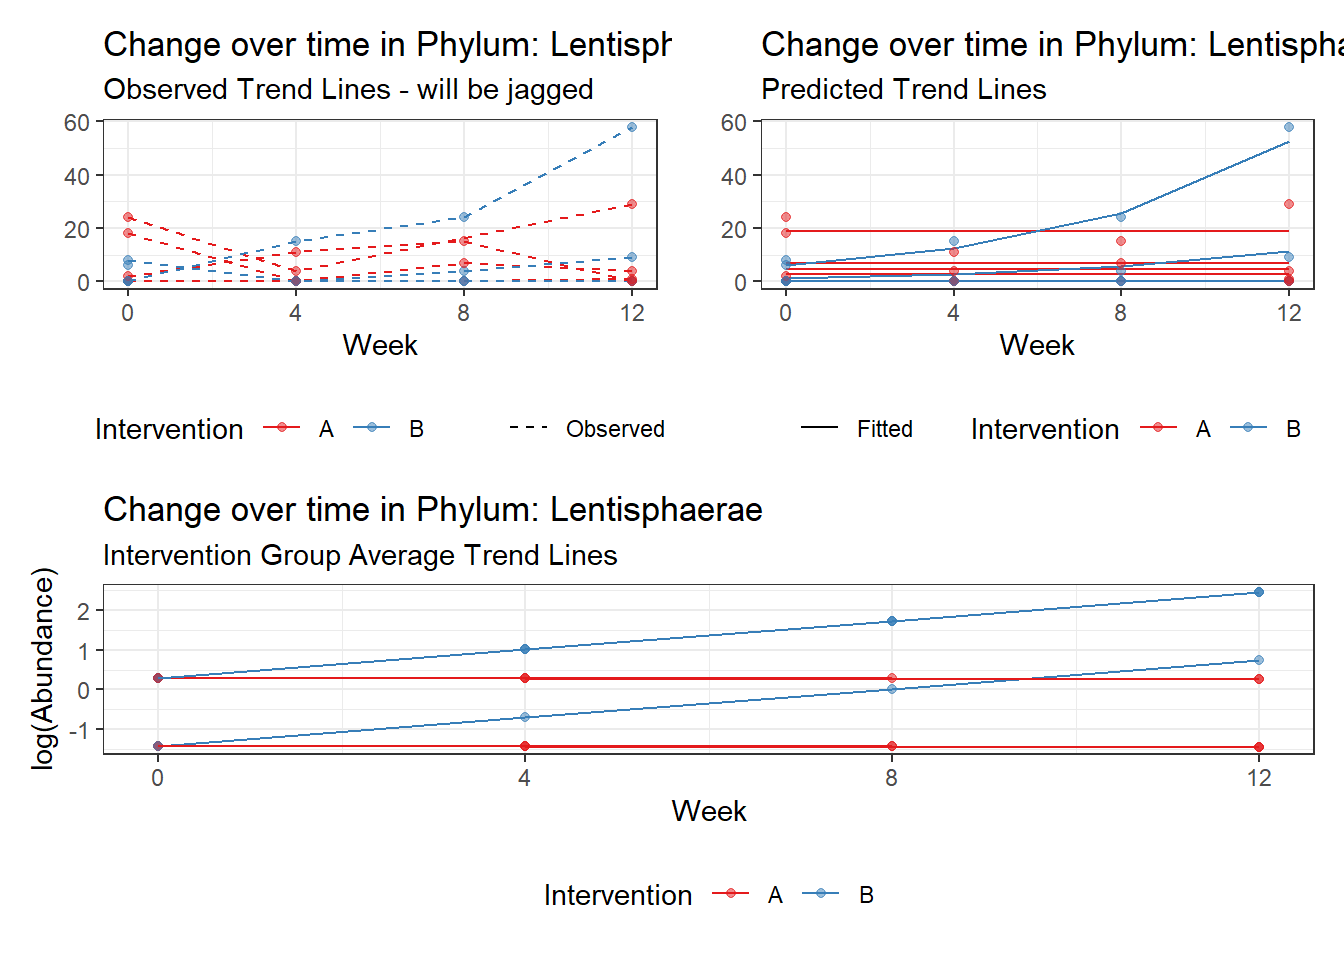
Fixed Effects (change in log)

                  Outcome Estimate Std. Error  z value Pr(>|z|)
(Intercept) Lentisphaerae -1.41986    1.58979 -0.89311  0.37180
time        Lentisphaerae -0.00384    0.07911 -0.04859  0.96125
hispanic    Lentisphaerae  1.70539    1.84349  0.92509  0.35492
time:intB   Lentisphaerae  0.72269    0.12740  5.67237  0.00000


Random Effects (SD on log scale)

 Groups    Name        Std.Dev.
 SubjectID (Intercept) 2.6303

Significance test not available for random effects

#########################################
#########################################
Model:  Proteobacteria ~ 1 + time + intB:time + hispanic + (1 | SubjectID)
<environment: 0x000000004dc96ee0>

Link:    poisson


Intraclass Correlation (ICC):   0.08999382
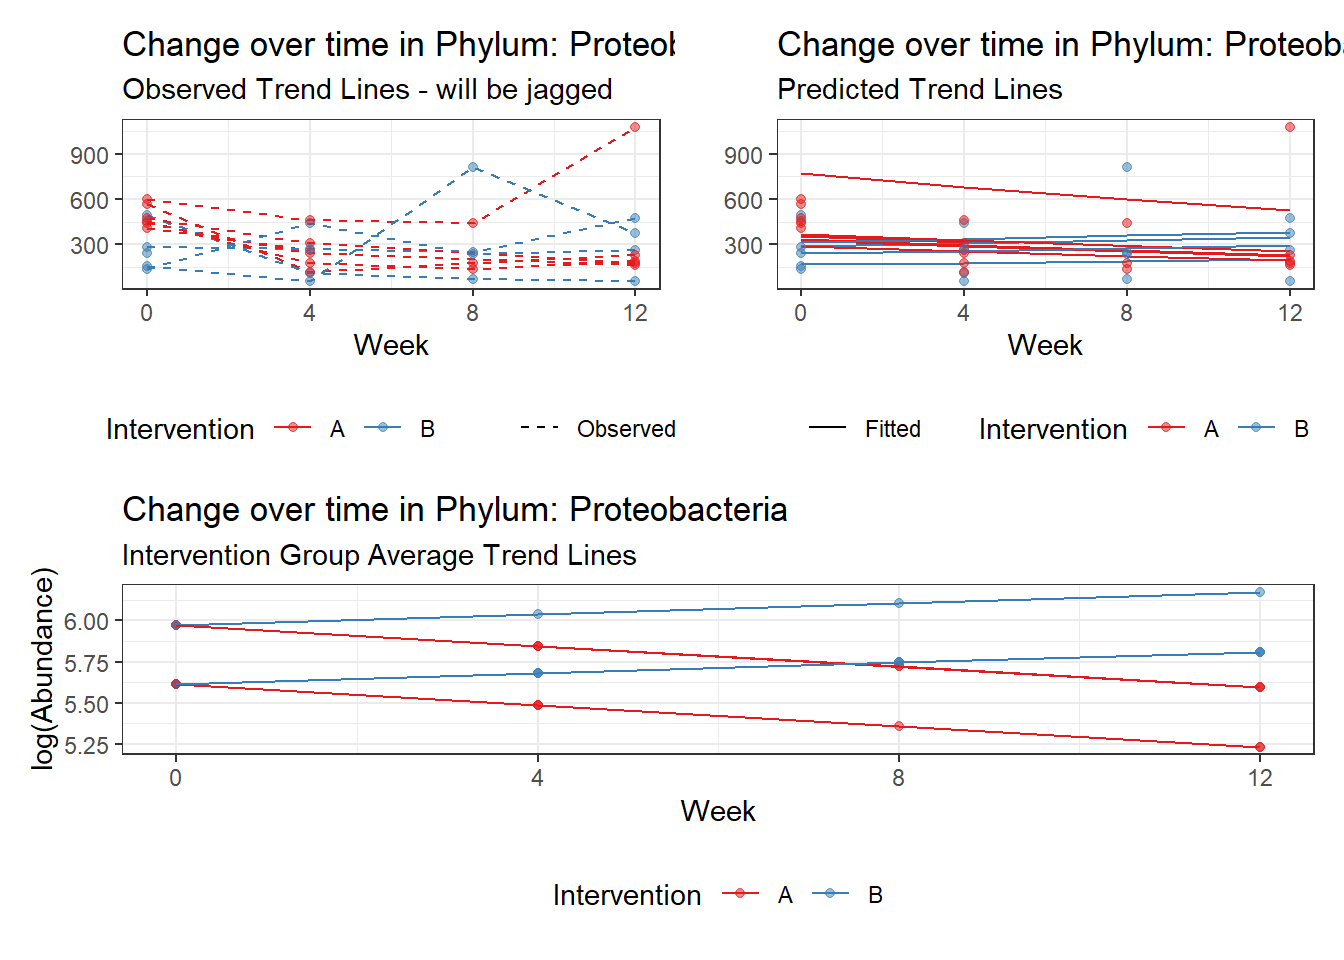
Fixed Effects (change in log)

                   Outcome Estimate Std. Error   z value Pr(>|z|)
(Intercept) Proteobacteria  5.97256    0.15832  37.72526  0.00000
time        Proteobacteria -0.12599    0.01087 -11.59167  0.00000
hispanic    Proteobacteria -0.36129    0.19829  -1.82199  0.06846
time:intB   Proteobacteria  0.19257    0.01721  11.18746  0.00000


Random Effects (SD on log scale)

 Groups    Name        Std.Dev.
 SubjectID (Intercept) 0.31447

Significance test not available for random effects

#########################################
#########################################
Model:  Tenericutes ~ 1 + time + intB:time + hispanic + (1 | SubjectID)
<environment: 0x000000004dc96ee0>

Link:    poisson


Intraclass Correlation (ICC):   0.9056279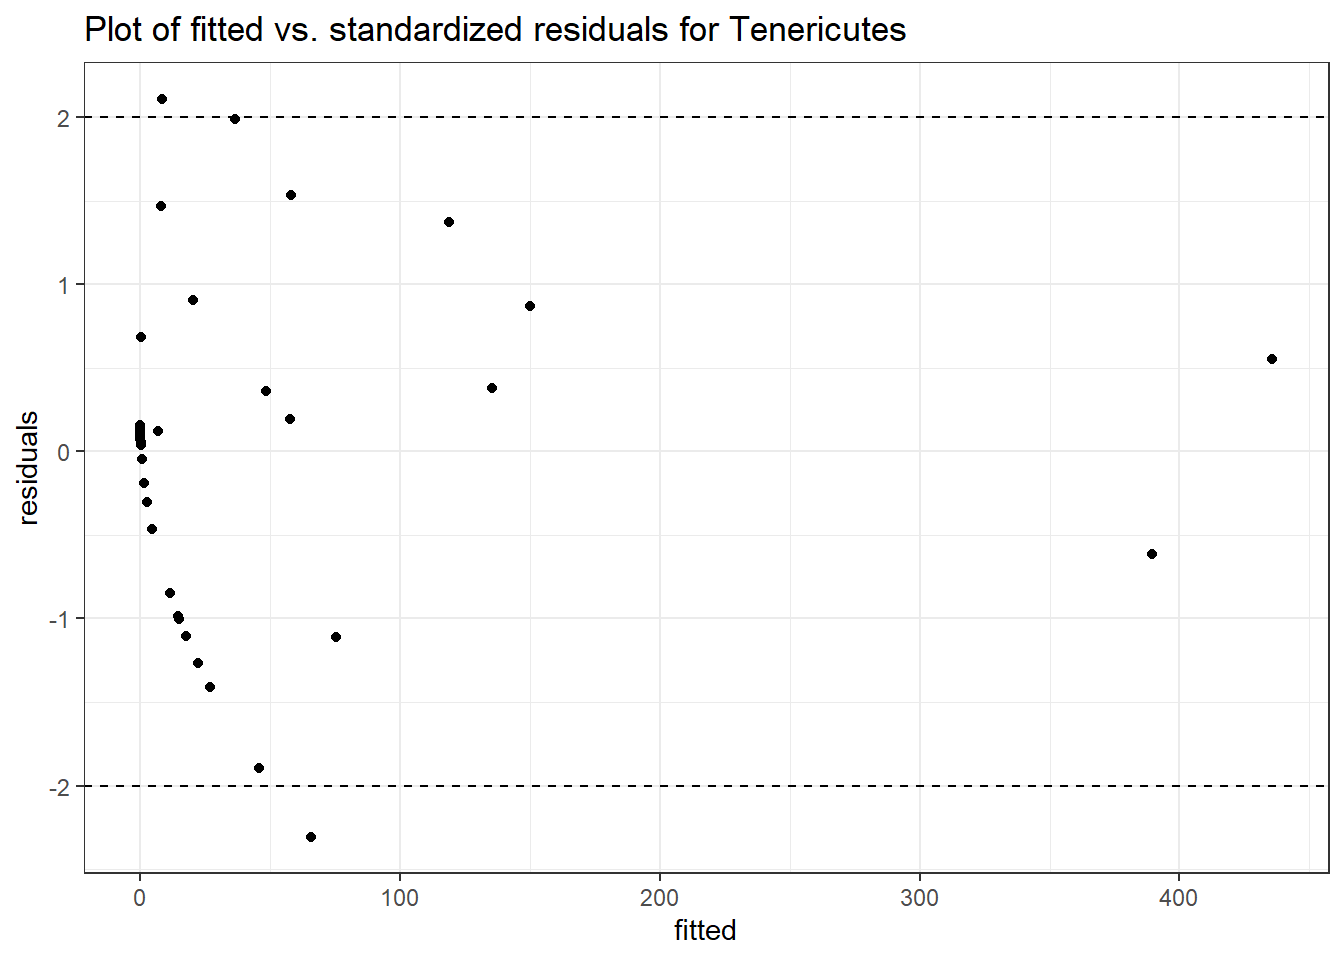

Fixed Effects (change in log)

                Outcome Estimate Std. Error  z value Pr(>|z|)
(Intercept) Tenericutes -1.82957    1.82980 -0.99987  0.31737
time        Tenericutes  0.58418    0.03029 19.28556  0.00000
hispanic    Tenericutes  3.30359    2.15739  1.53129  0.12570
time:intB   Tenericutes  0.36911    0.05297  6.96874  0.00000


Random Effects (SD on log scale)

 Groups    Name        Std.Dev.
 SubjectID (Intercept) 3.0978

Significance test not available for random effects

#########################################
#########################################
Model:  Verrucomicrobia ~ 1 + time + intB:time + hispanic + (1 | SubjectID)
<environment: 0x000000004dc96ee0>

Link:    poisson


Intraclass Correlation (ICC):   0.8527204
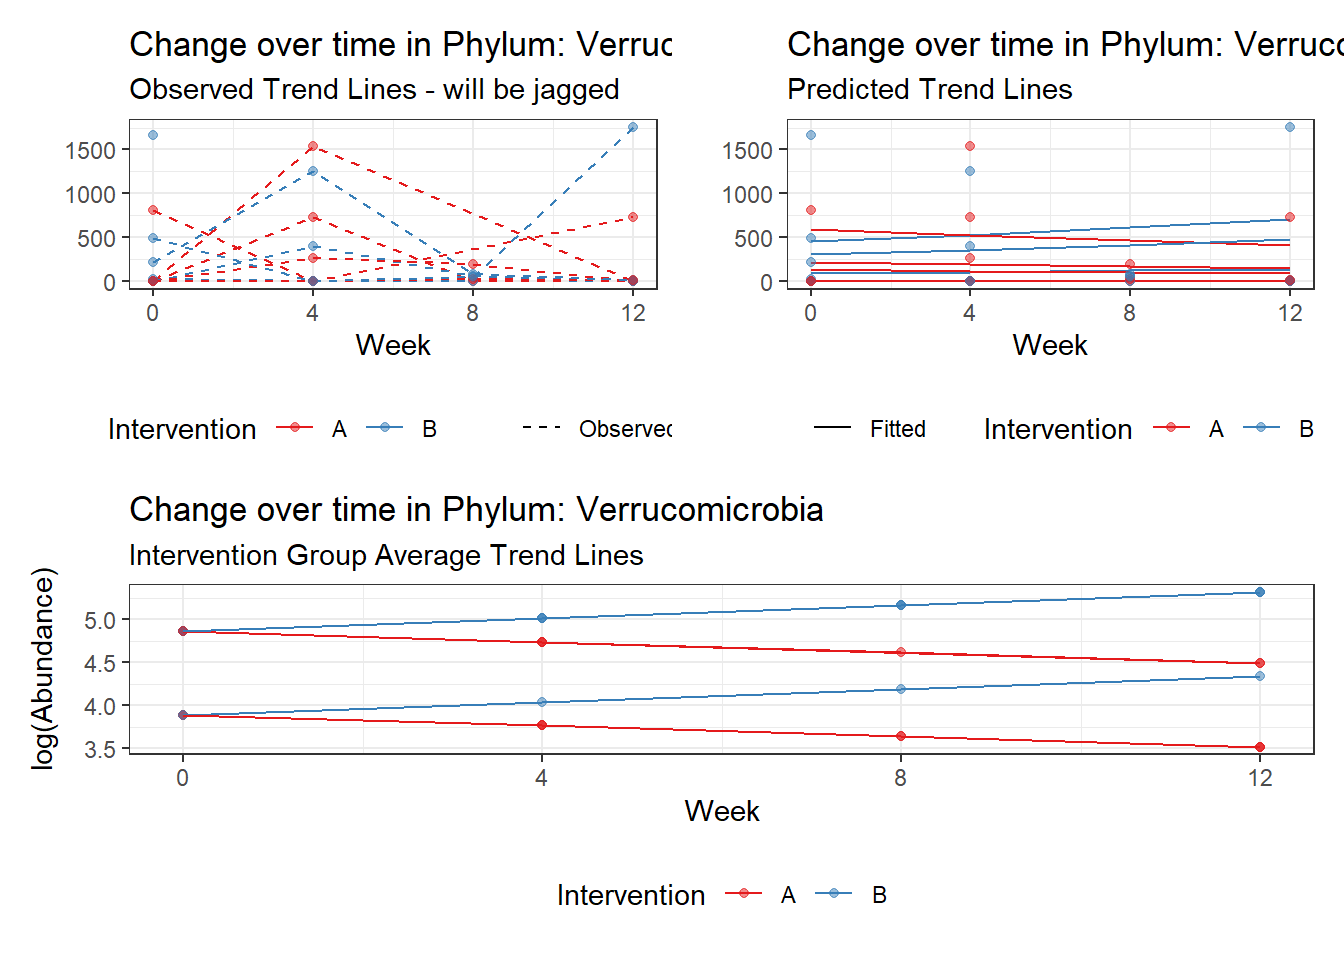
Fixed Effects (change in log)

                    Outcome Estimate Std. Error  z value Pr(>|z|)
(Intercept) Verrucomicrobia  3.89165    1.20479  3.23014  0.00124
time        Verrucomicrobia -0.12314    0.01296 -9.49942  0.00000
hispanic    Verrucomicrobia  0.97273    1.51647  0.64145  0.52123
time:intB   Verrucomicrobia  0.27345    0.01882 14.52637  0.00000


Random Effects (SD on log scale)

 Groups    Name        Std.Dev.
 SubjectID (Intercept) 2.4062

Significance test not available for random effects
phylum.fit8b <- glmm_microbiome(mydata=microbiome_data, model.number=8,
taxa.level="Phylum", link="negbinom",
model="1 + time + intB:time + hispanic + (1|SubjectID)")
#########################################
#########################################
Model:  Actinobacteria ~ 1 + time + intB:time + hispanic + (1 | SubjectID)
<environment: 0x000000000b990df8>

Link:    negbinom


Intraclass Correlation (ICC):   0.3139274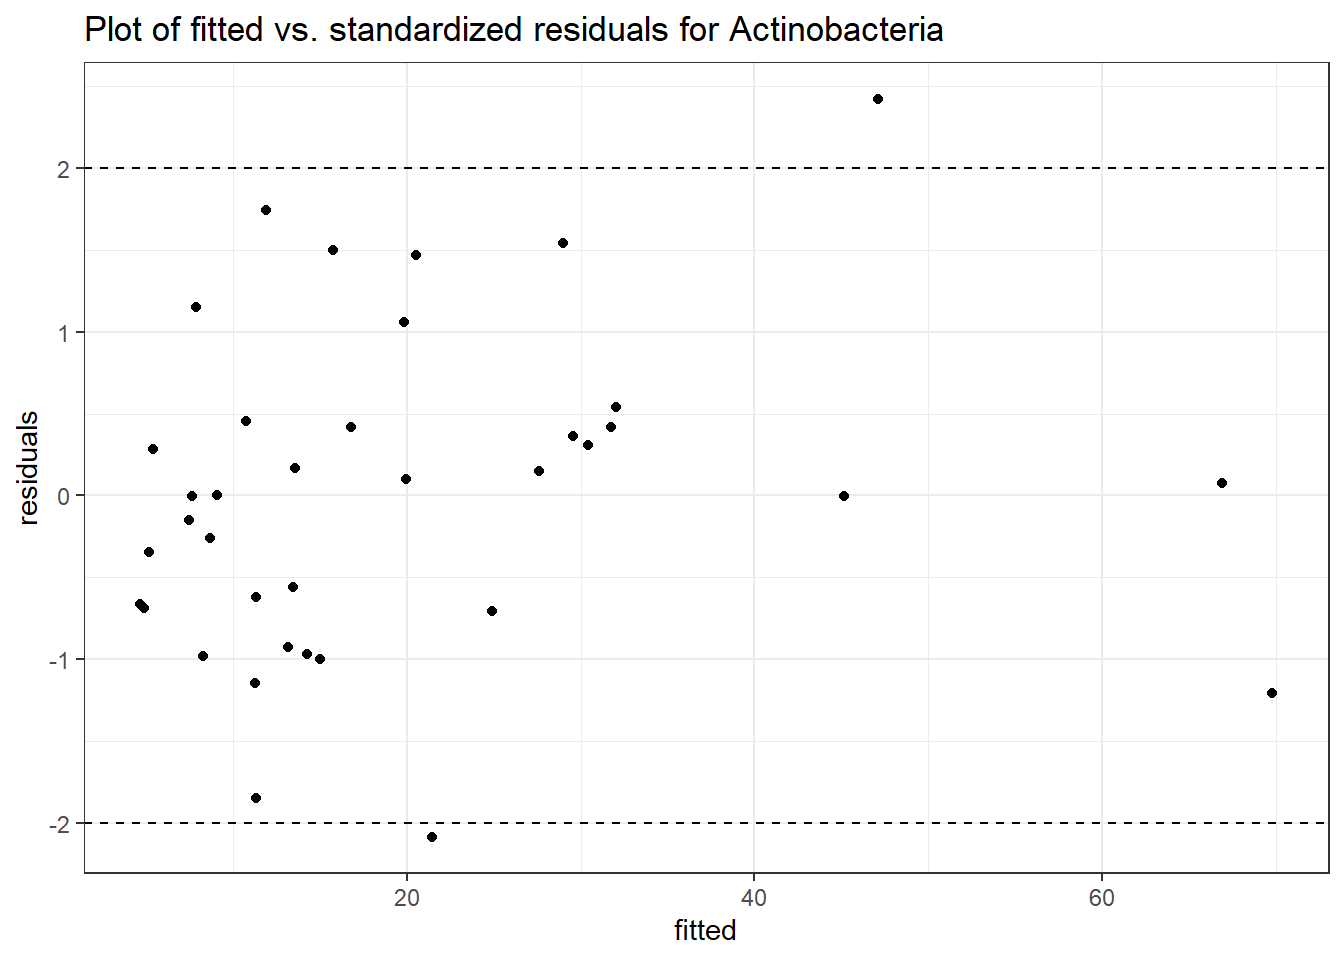
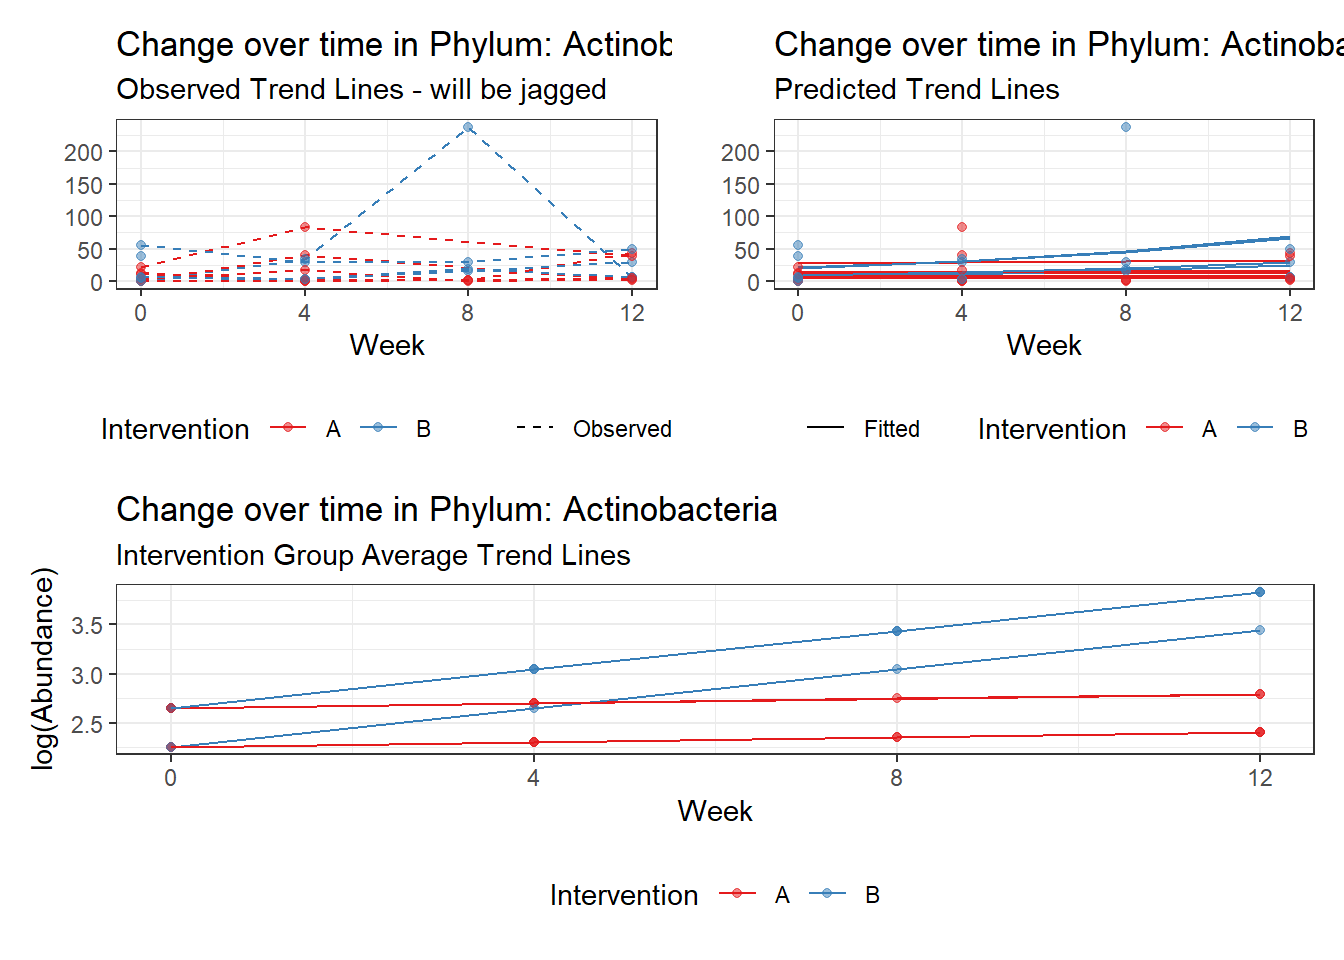
Fixed Effects (change in log)

                   Outcome Estimate Std. Error z value Pr(>|z|)
(Intercept) Actinobacteria  2.25734    0.55848 4.04197  0.00005
time        Actinobacteria  0.04951    0.22993 0.21534  0.82950
hispanic    Actinobacteria  0.39075    0.59336 0.65853  0.51020
time:intB   Actinobacteria  0.34387    0.28856 1.19165  0.23340


Random Effects (SD on log scale)

 Groups    Name        Std.Dev.
 SubjectID (Intercept) 0.67644

Significance test not available for random effects

#########################################
#########################################
Model:  Bacteroidetes ~ 1 + time + intB:time + hispanic + (1 | SubjectID)
<environment: 0x000000000b990df8>

Link:    negbinom


Intraclass Correlation (ICC):   0.125987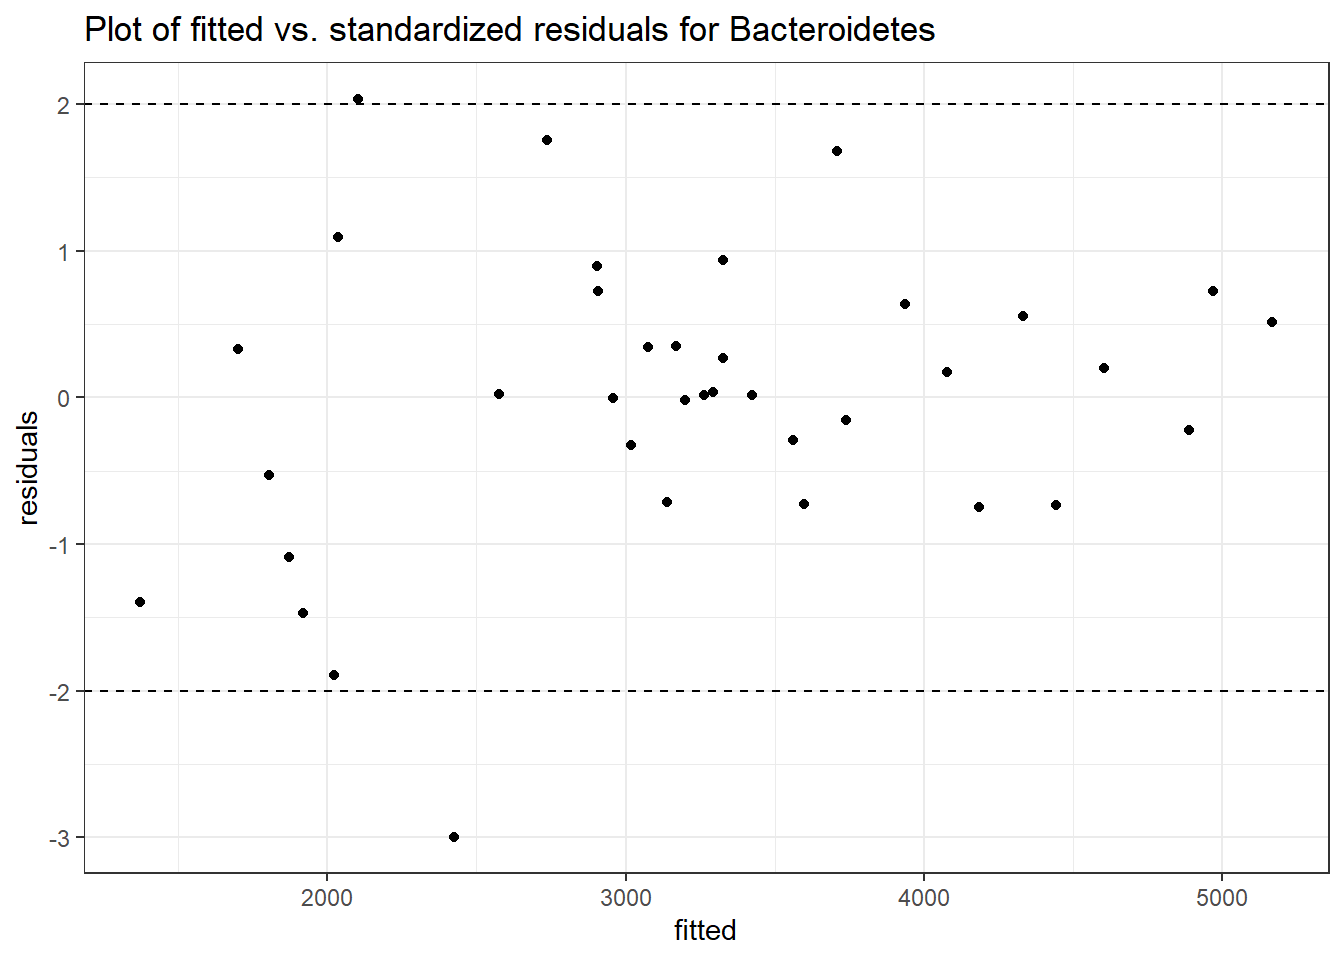
Fixed Effects (change in log)

                  Outcome Estimate Std. Error  z value Pr(>|z|)
(Intercept) Bacteroidetes  8.24721    0.20728 39.78687  0.00000
time        Bacteroidetes -0.03888    0.04534 -0.85753  0.39115
hispanic    Bacteroidetes -0.31467    0.25474 -1.23523  0.21674
time:intB   Bacteroidetes -0.02152    0.06644 -0.32388  0.74603


Random Effects (SD on log scale)

 Groups    Name        Std.Dev.
 SubjectID (Intercept) 0.37967

Significance test not available for random effects

#########################################
#########################################
Model:  Cyanobacteria ~ 1 + time + intB:time + hispanic + (1 | SubjectID)
<environment: 0x000000000b990df8>

Link:    negbinom
Warning in theta.ml(Y, mu, weights = object@resp$weights, limit = limit, :
iteration limit reachedWarning in sqrt(1/i): NaNs produced
Intraclass Correlation (ICC): 0.9386044
Fixed Effects (change in log)

                  Outcome Estimate Std. Error  z value Pr(>|z|)
(Intercept) Cyanobacteria -2.51414    2.49472 -1.00778  0.31356
time        Cyanobacteria -0.07242    0.04207 -1.72128  0.08520
hispanic    Cyanobacteria  2.80768    2.76933  1.01385  0.31066
time:intB   Cyanobacteria -0.50406    0.06895 -7.31046  0.00000


Random Effects (SD on log scale)

 Groups    Name        Std.Dev.
 SubjectID (Intercept) 3.91

Significance test not available for random effects

#########################################
#########################################
Model:  Euryarchaeota ~ 1 + time + intB:time + hispanic + (1 | SubjectID)
<environment: 0x000000000b990df8>

Link:    negbinom
boundary (singular) fit: see ?isSingular
Intraclass Correlation (ICC): 4.924077e-12
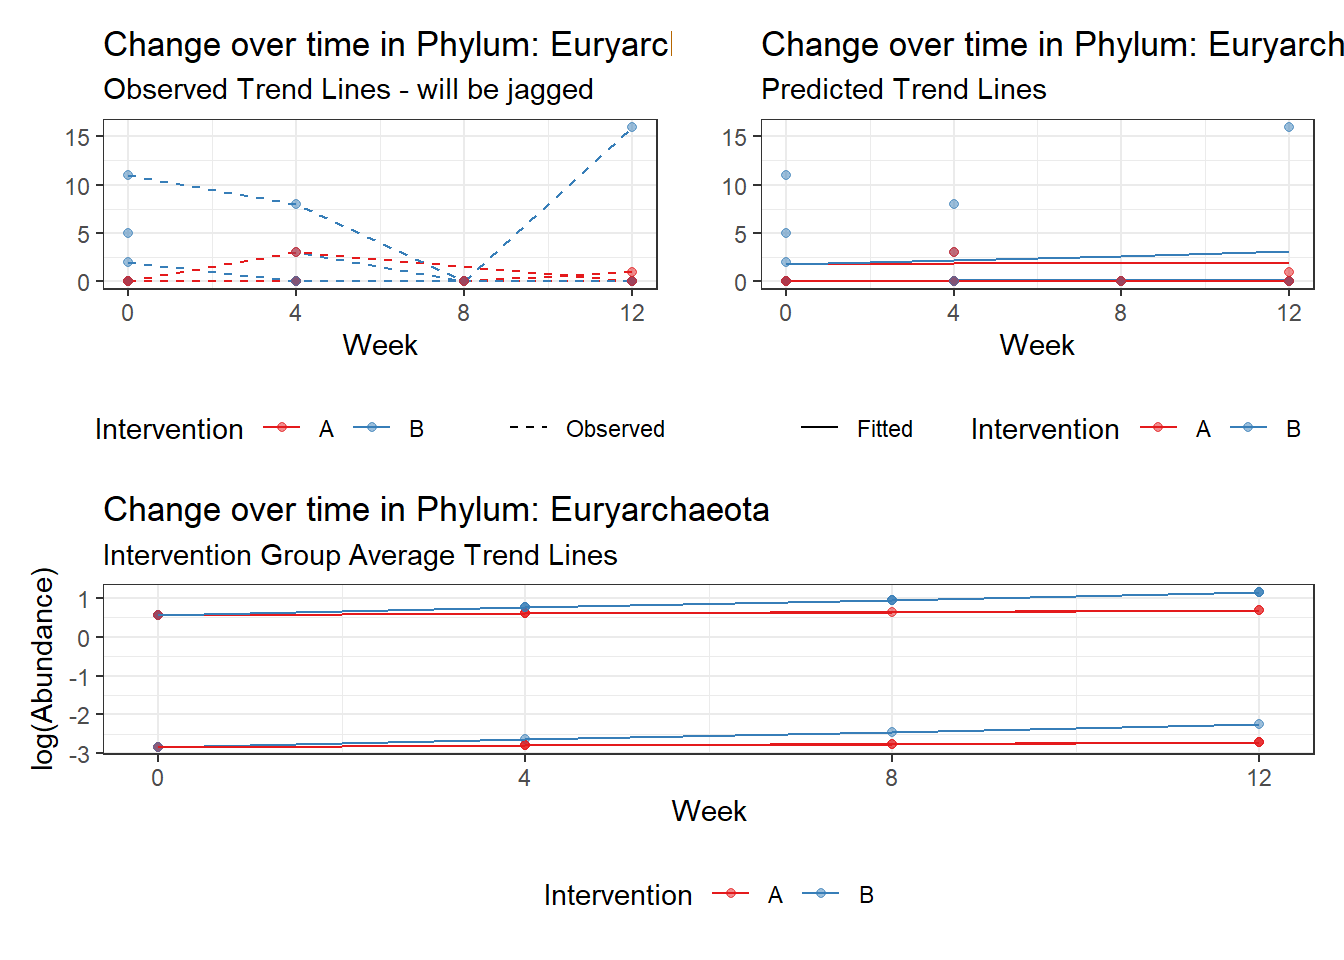
Fixed Effects (change in log)

                  Outcome Estimate Std. Error  z value Pr(>|z|)
(Intercept) Euryarchaeota -2.83063    1.78173 -1.58870  0.11213
time        Euryarchaeota  0.03947    0.78617  0.05020  0.95996
hispanic    Euryarchaeota  3.40024    1.75962  1.93237  0.05331
time:intB   Euryarchaeota  0.15439    0.81138  0.19028  0.84909


Random Effects (SD on log scale)

 Groups    Name        Std.Dev.
 SubjectID (Intercept) 2.219e-06

Significance test not available for random effects

#########################################
#########################################
Model:  Firmicutes ~ 1 + time + intB:time + hispanic + (1 | SubjectID)
<environment: 0x000000000b990df8>

Link:    negbinom


Intraclass Correlation (ICC):   0.1193617
Fixed Effects (change in log)

               Outcome Estimate Std. Error  z value Pr(>|z|)
(Intercept) Firmicutes  7.88045    0.19209 41.02414  0.00000
time        Firmicutes  0.03450    0.03213  1.07361  0.28300
hispanic    Firmicutes  0.07388    0.23822  0.31015  0.75644
time:intB   Firmicutes -0.02733    0.04668 -0.58553  0.55819


Random Effects (SD on log scale)

 Groups    Name        Std.Dev.
 SubjectID (Intercept) 0.36816

Significance test not available for random effects

#########################################
#########################################
Model:  Lentisphaerae ~ 1 + time + intB:time + hispanic + (1 | SubjectID)
<environment: 0x000000000b990df8>

Link:    negbinom
boundary (singular) fit: see ?isSingular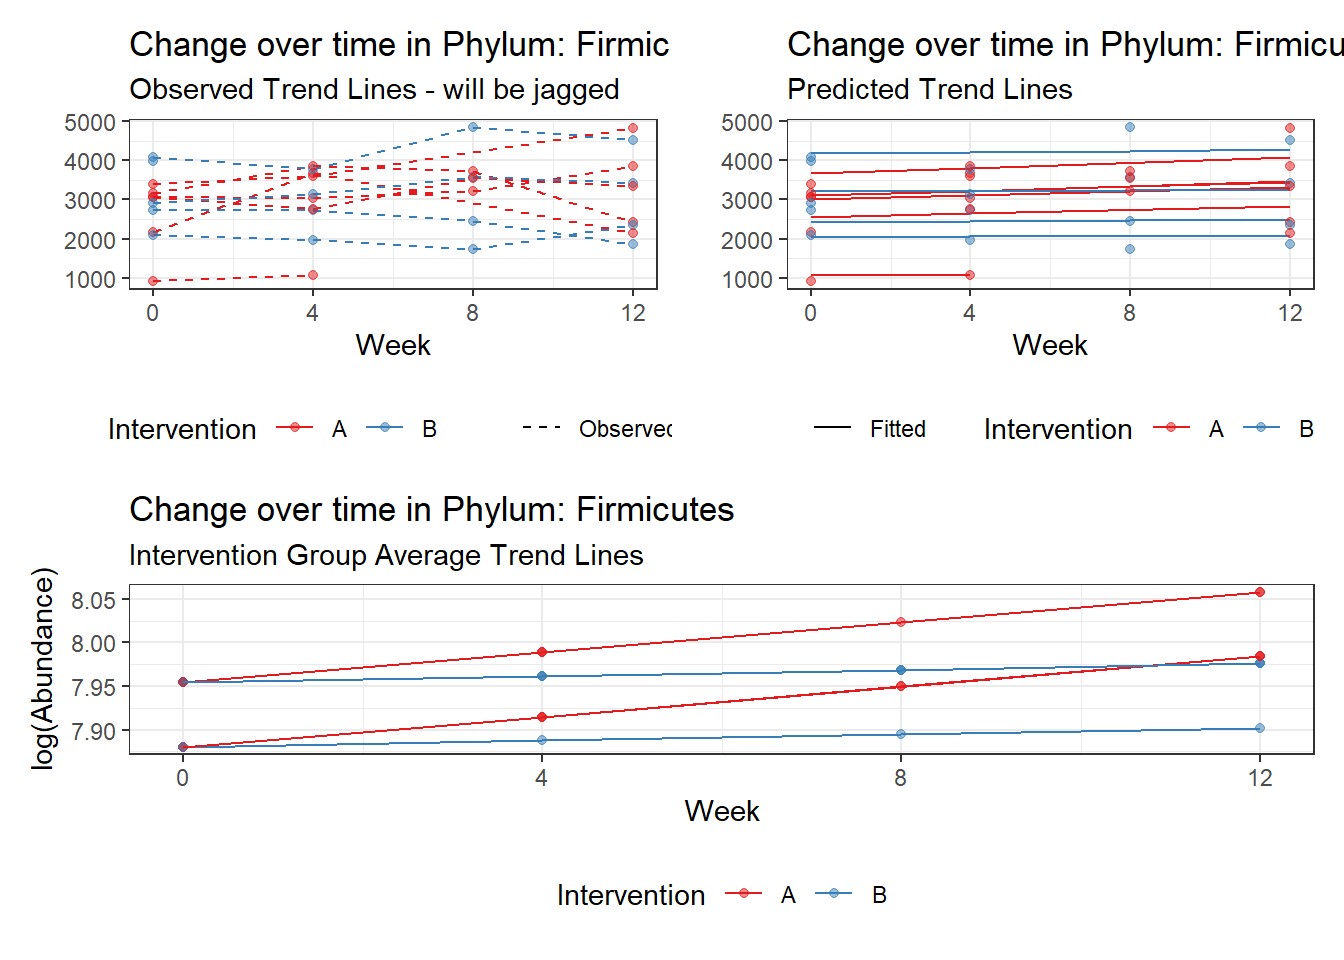
Intraclass Correlation (ICC): 1.405955e-11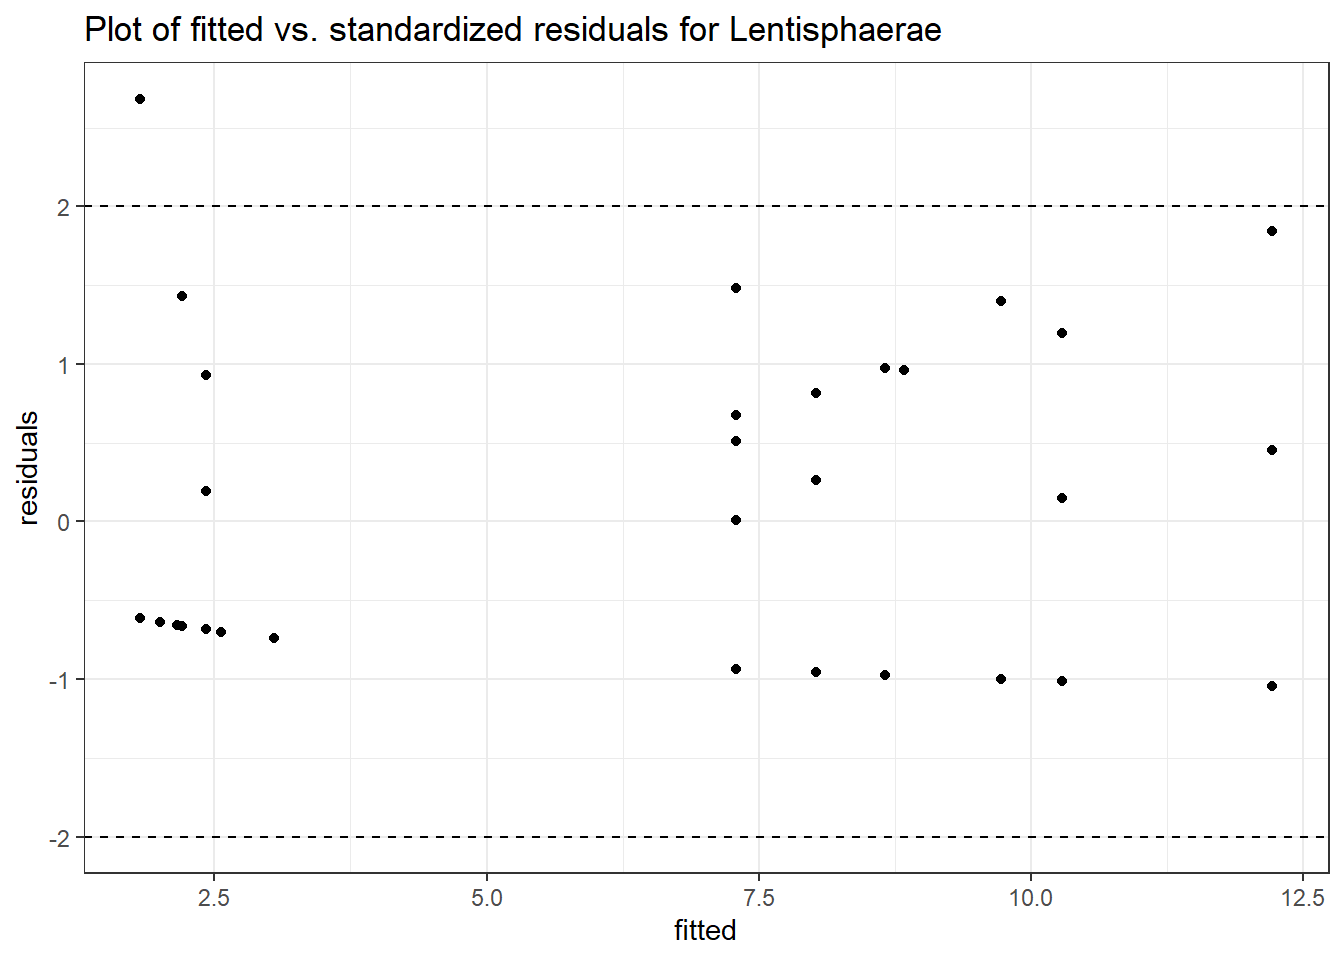
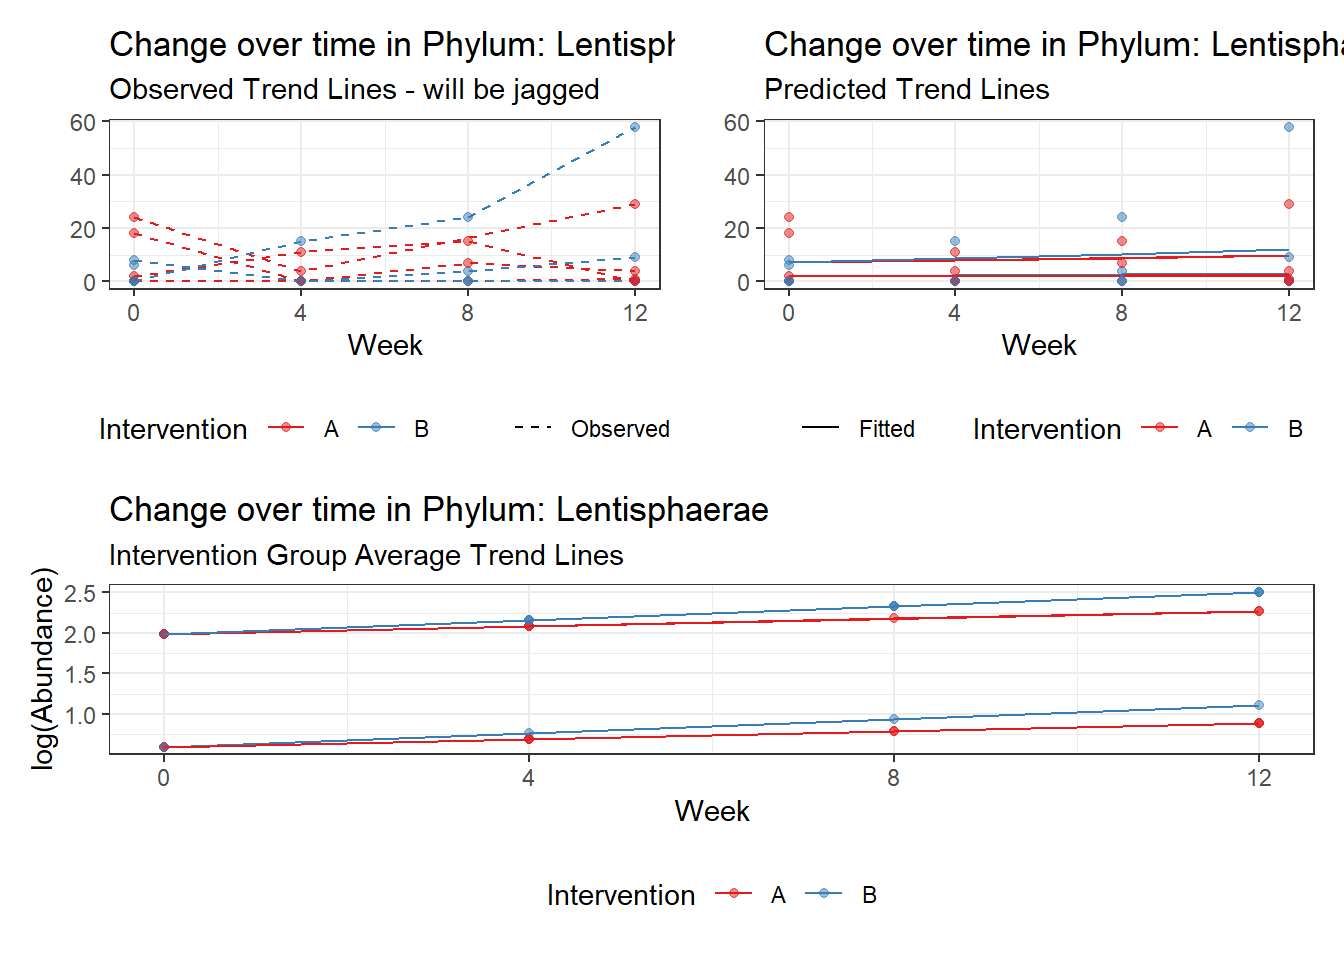
Fixed Effects (change in log)

                  Outcome Estimate Std. Error z value Pr(>|z|)
(Intercept) Lentisphaerae  0.59857    0.65048 0.92019  0.35747
time        Lentisphaerae  0.09582    0.34241 0.27983  0.77961
hispanic    Lentisphaerae  1.38859    0.82312 1.68699  0.09161
time:intB   Lentisphaerae  0.07602    0.40262 0.18882  0.85023


Random Effects (SD on log scale)

 Groups    Name        Std.Dev.
 SubjectID (Intercept) 3.7496e-06

Significance test not available for random effects

#########################################
#########################################
Model:  Proteobacteria ~ 1 + time + intB:time + hispanic + (1 | SubjectID)
<environment: 0x000000000b990df8>

Link:    negbinom


Intraclass Correlation (ICC):   0.01340966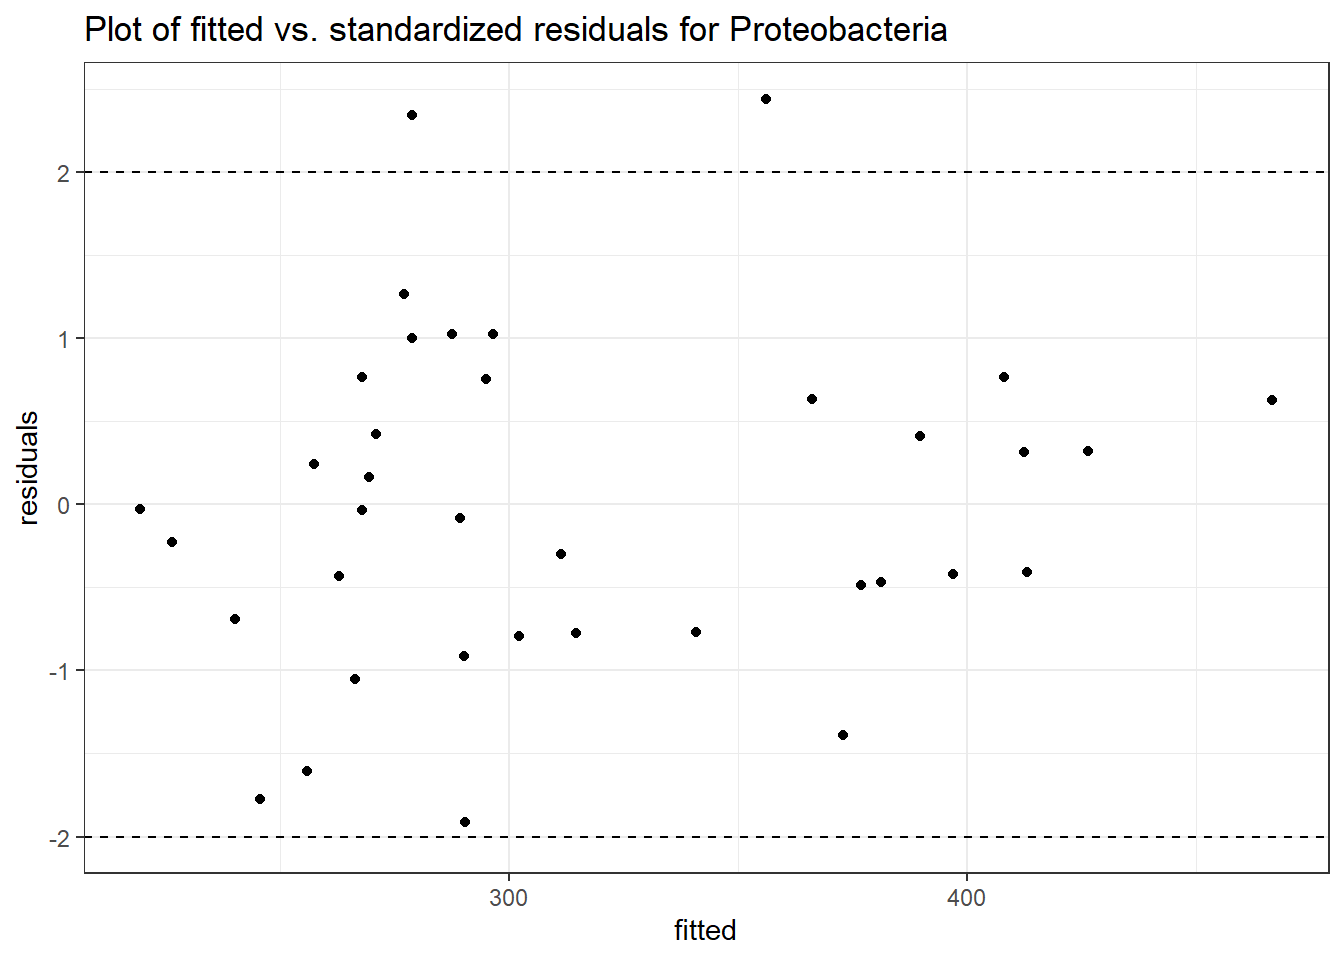
Fixed Effects (change in log)
Outcome Estimate Std. Error z value Pr(>|z|)
(Intercept) Proteobacteria 6.05066 0.21812 27.73948 0.00000
time Proteobacteria -0.09016 0.10934 -0.82461 0.40960
hispanic Proteobacteria -0.37745 0.23041 -1.63818 0.10138
time:intB Proteobacteria 0.04997 0.12449 0.40141 0.68811
Random Effects (SD on log scale)
Groups Name Std.Dev.
SubjectID (Intercept) 0.11658
Significance test not available for random effects
#########################################
#########################################
Model: Tenericutes ~ 1 + time + intB:time + hispanic + (1 | SubjectID)
<environment: 0x000000000b990df8>
Link: negbinomboundary (singular) fit: see ?isSingular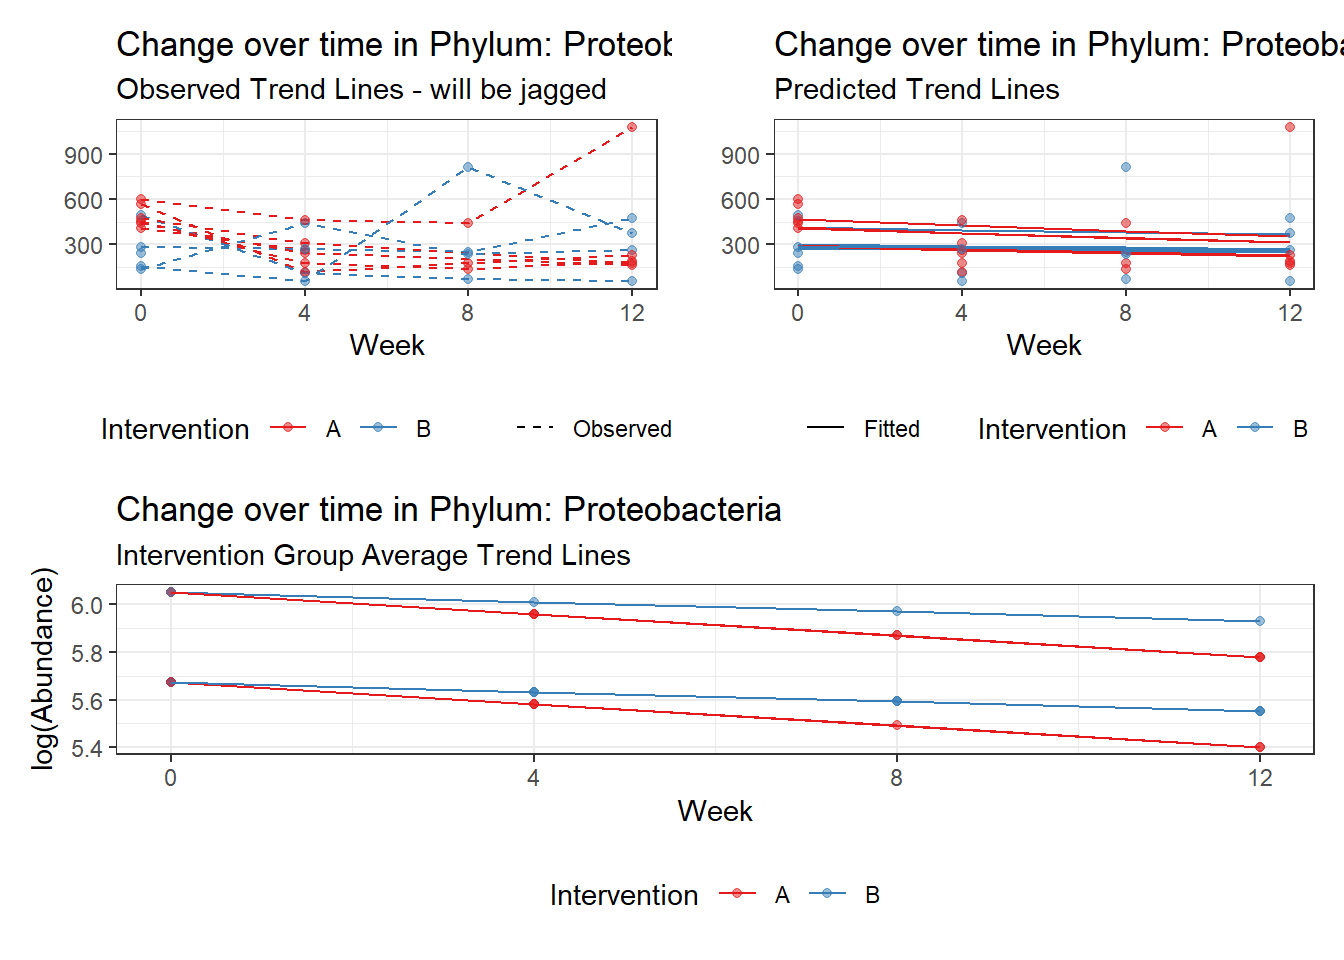
Intraclass Correlation (ICC): 1.936714e-11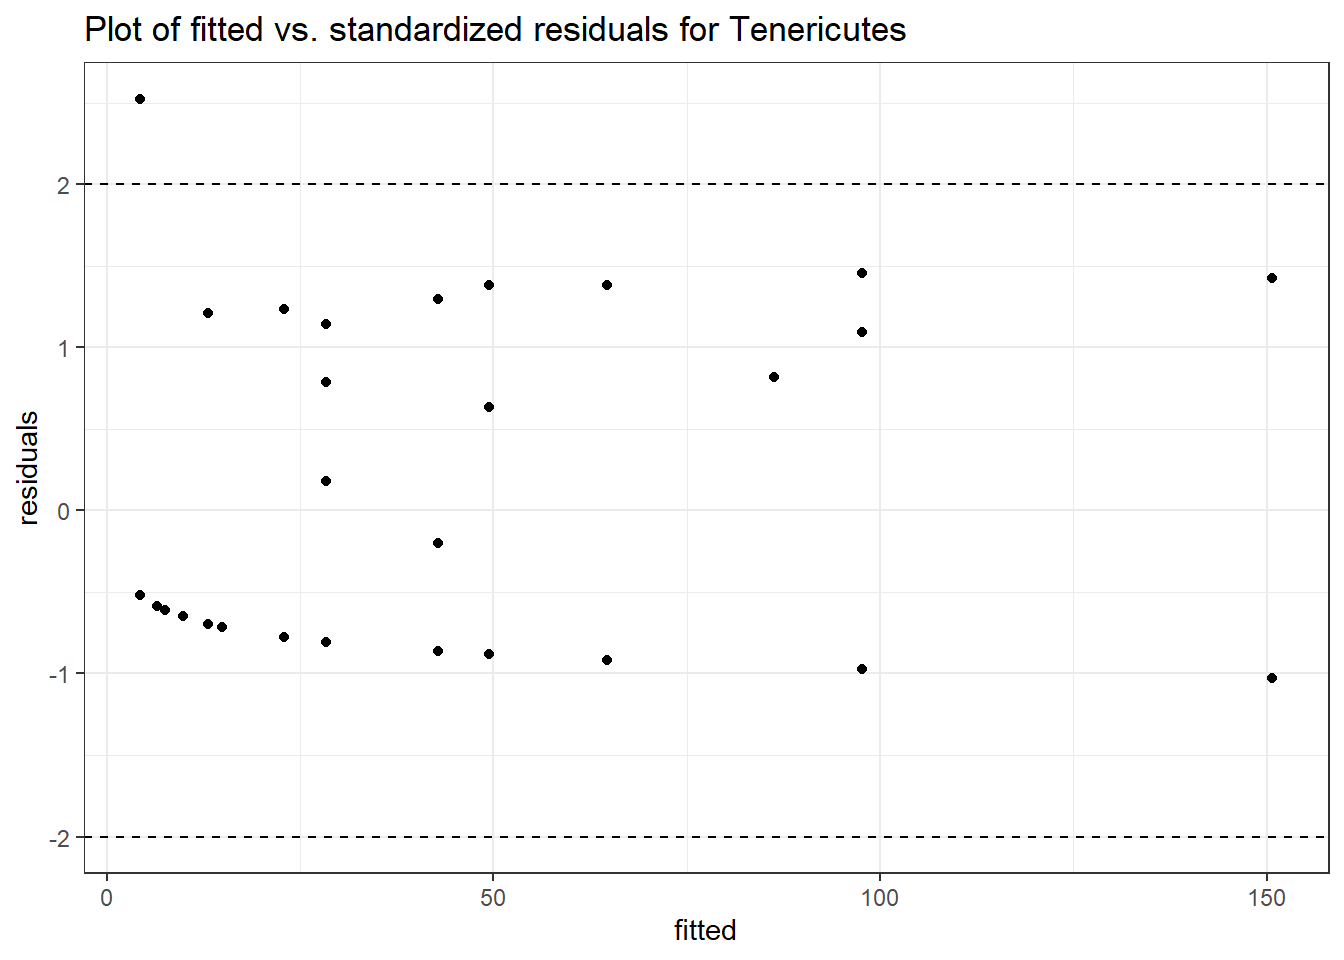
Fixed Effects (change in log)
Outcome Estimate Std. Error z value Pr(>|z|)
(Intercept) Tenericutes 1.46073 0.86963 1.67972 0.09301
time Tenericutes 0.55723 0.48228 1.15541 0.24792
hispanic Tenericutes 1.88305 1.16936 1.61033 0.10733
time:intB Tenericutes -0.14473 0.56702 -0.25526 0.79853
Random Effects (SD on log scale)
Groups Name Std.Dev.
SubjectID (Intercept) 4.4008e-06
Significance test not available for random effects
#########################################
#########################################
Model: Verrucomicrobia ~ 1 + time + intB:time + hispanic + (1 | SubjectID)
<environment: 0x000000000b990df8>
Link: negbinomboundary (singular) fit: see ?isSingular
Intraclass Correlation (ICC): 4.148378e-12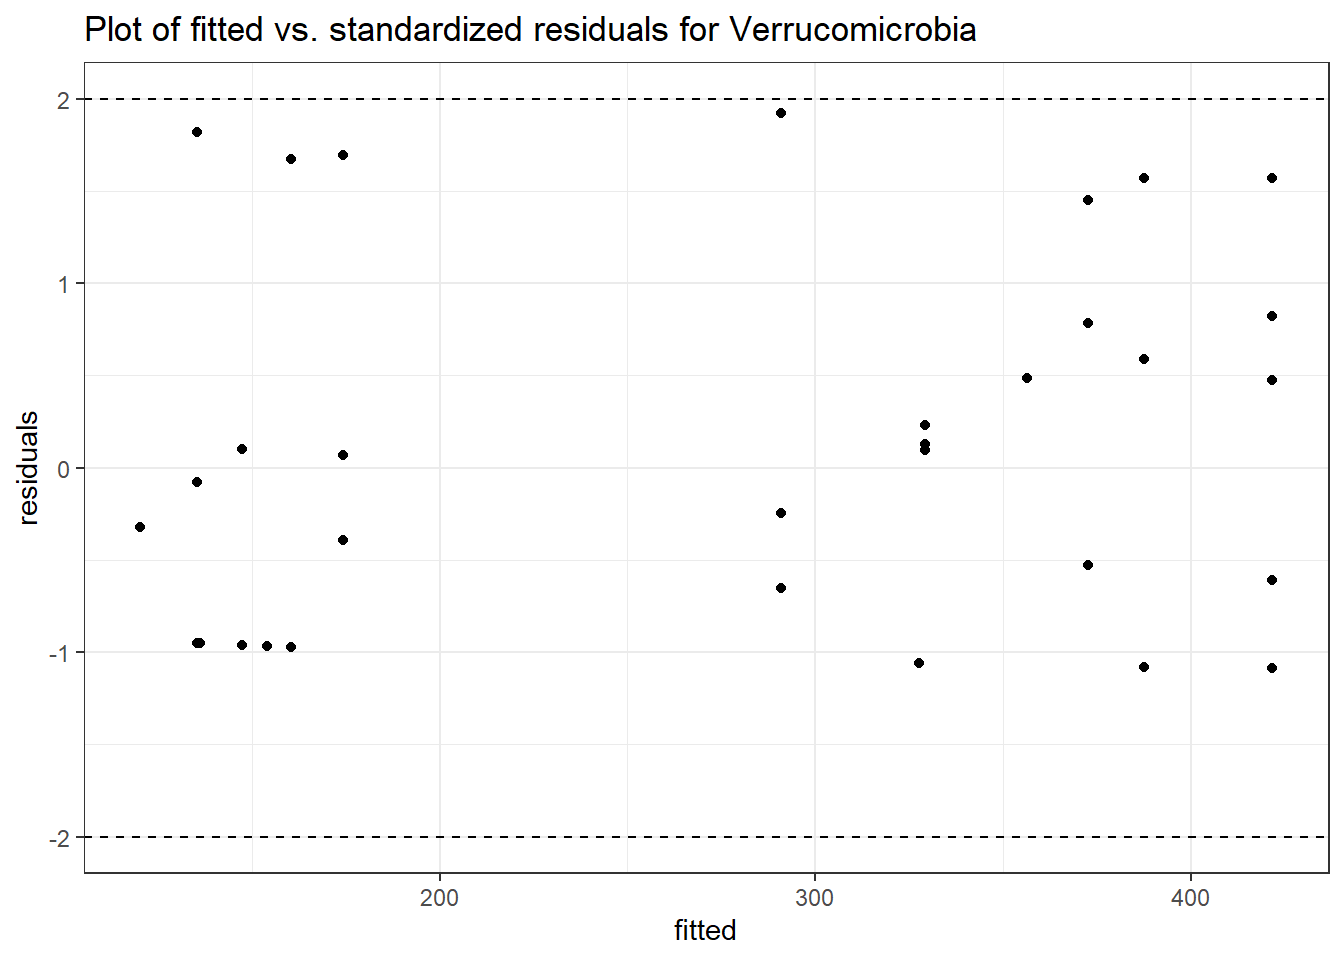
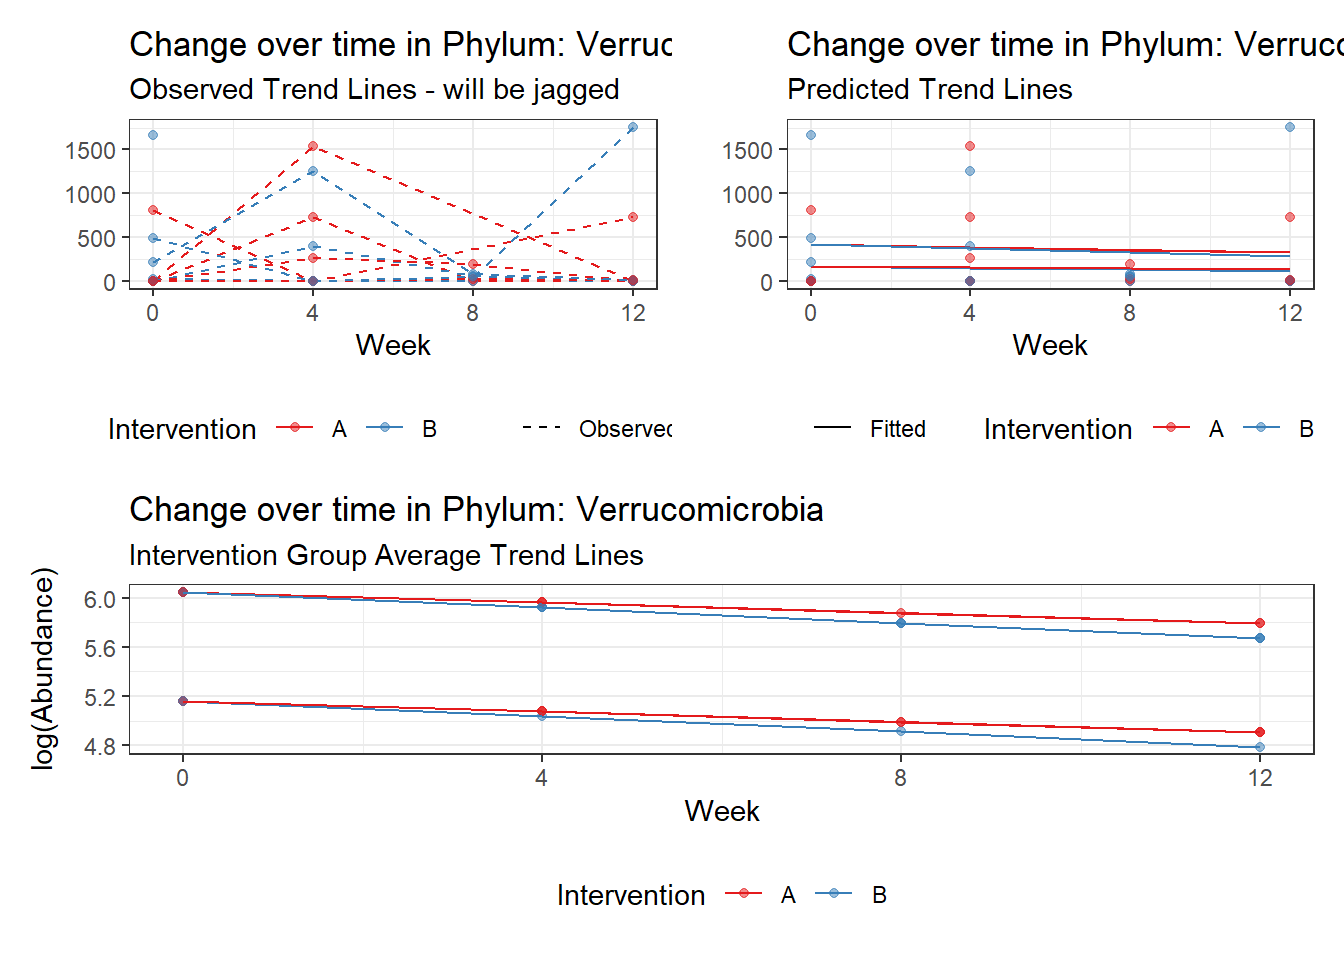
Fixed Effects (change in log)
Outcome Estimate Std. Error z value Pr(>|z|)
(Intercept) Verrucomicrobia 5.16109 0.93773 5.50382 0.00000
time Verrucomicrobia -0.08415 0.47434 -0.17739 0.85920
hispanic Verrucomicrobia 0.88331 1.06565 0.82889 0.40717
time:intB Verrucomicrobia -0.03976 0.57503 -0.06914 0.94488
Random Effects (SD on log scale)
Groups Name Std.Dev.
SubjectID (Intercept) 2.0368e-06
Significance test not available for random effectsSummary of Effect of Intervention on Abundance
To summarize these results, we are looking 1 main things: that the interaction between intervention and time (intB:time) is significant. If so, then we have evidence that that phylum was significantly affected by the intervention, meaning that as time progresses those in the intervention had their microbiome abundance differentially changed over time.
This is sumarized in two ways (i.e., two models). These models are detailed below.
Model 6: Intervention by Time Interaction Only
\[\begin{align*} h\left(Y_{ij}\right)&=\beta_{0j} + \beta_{1j}(Week)_{ij} + r_{ij}\\ \beta_{0j}&= \gamma_{00} + u_{0j}\\ \beta_{1j}&= \gamma_{10} + \gamma_{11}(Intervention)_{j}\\ \end{align*}\] where, the major aim was to assess the significance of two terms:
- the interaction between time and intervention (intB:time) (\(\gamma_{11}\)) - which assessing the magnitude of the change in alpha diversity as the intervention progresses.
model6.results <- unlist_results(phylum.fit6b$`Fixed Effects`)Joining, by = c("Phylum", "Term", "Estimate", "Std. Error", "z value", "Pr(>|z|)")
Joining, by = c("Phylum", "Term", "Estimate", "Std. Error", "z value", "Pr(>|z|)")
Joining, by = c("Phylum", "Term", "Estimate", "Std. Error", "z value", "Pr(>|z|)")
Joining, by = c("Phylum", "Term", "Estimate", "Std. Error", "z value", "Pr(>|z|)")
Joining, by = c("Phylum", "Term", "Estimate", "Std. Error", "z value", "Pr(>|z|)")
Joining, by = c("Phylum", "Term", "Estimate", "Std. Error", "z value", "Pr(>|z|)")
Joining, by = c("Phylum", "Term", "Estimate", "Std. Error", "z value", "Pr(>|z|)")
Joining, by = c("Phylum", "Term", "Estimate", "Std. Error", "z value", "Pr(>|z|)")kable(model6.results, format="html", digits=3)%>%
kable_styling(full_width = T) %>%
scroll_box(width="100%",height="5in")| Phylum | Term | Estimate | Std. Error | z value | Pr(>|z|) | p.adjust |
|---|---|---|---|---|---|---|
| Actinobacteria | time | 0.033 | 0.227 | 0.144 | 0.885 | 0.952 |
| Actinobacteria | time:intB | 0.356 | 0.285 | 1.250 | 0.211 | 0.475 |
| Bacteroidetes | time | -0.033 | 0.045 | -0.724 | 0.469 | 0.777 |
| Bacteroidetes | time:intB | -0.032 | 0.066 | -0.486 | 0.627 | 0.777 |
| Cyanobacteria | time | -0.073 | 0.042 | -1.725 | 0.085 | 0.275 |
| Cyanobacteria | time:intB | -0.504 | 0.069 | -7.302 | 0.000 | 0.000 |
| Euryarchaeota | time | -0.836 | 0.574 | -1.456 | 0.145 | 0.392 |
| Euryarchaeota | time:intB | 1.043 | 0.618 | 1.687 | 0.092 | 0.275 |
| Firmicutes | time | 0.034 | 0.032 | 1.054 | 0.292 | 0.606 |
| Firmicutes | time:intB | -0.026 | 0.047 | -0.564 | 0.573 | 0.777 |
| Lentisphaerae | time | 0.033 | 0.363 | 0.091 | 0.928 | 0.952 |
| Lentisphaerae | time:intB | 0.243 | 0.509 | 0.477 | 0.633 | 0.777 |
| Proteobacteria | time | -0.072 | 0.110 | -0.657 | 0.511 | 0.777 |
| Proteobacteria | time:intB | 0.018 | 0.131 | 0.134 | 0.893 | 0.952 |
| Tenericutes | time | 0.691 | 0.533 | 1.295 | 0.195 | 0.475 |
| Tenericutes | time:intB | 0.035 | 0.579 | 0.060 | 0.952 | 0.952 |
| Verrucomicrobia | time | -0.276 | 0.447 | -0.619 | 0.536 | 0.777 |
| Verrucomicrobia | time:intB | 0.236 | 0.468 | 0.504 | 0.614 | 0.777 |
Dual results for double check
model6.pois.nb.results <- unlist_dual_results(phylum.fit6$`Fixed Effects`, phylum.fit6b$`Fixed Effects`)Joining, by = c("Phylum", "Term", "Estimate", "Std. Error", "z value", "Pr(>|z|)")
Joining, by = c("Phylum", "Term", "Estimate", "Std. Error", "z value", "Pr(>|z|)")
Joining, by = c("Phylum", "Term", "Estimate", "Std. Error", "z value", "Pr(>|z|)")
Joining, by = c("Phylum", "Term", "Estimate", "Std. Error", "z value", "Pr(>|z|)")
Joining, by = c("Phylum", "Term", "Estimate", "Std. Error", "z value", "Pr(>|z|)")
Joining, by = c("Phylum", "Term", "Estimate", "Std. Error", "z value", "Pr(>|z|)")
Joining, by = c("Phylum", "Term", "Estimate", "Std. Error", "z value", "Pr(>|z|)")
Joining, by = c("Phylum", "Term", "Estimate", "Std. Error", "z value", "Pr(>|z|)")
Joining, by = c("Phylum", "Term", "Estimate", "Std. Error", "z value", "Pr(>|z|)")
Joining, by = c("Phylum", "Term", "Estimate", "Std. Error", "z value", "Pr(>|z|)")
Joining, by = c("Phylum", "Term", "Estimate", "Std. Error", "z value", "Pr(>|z|)")
Joining, by = c("Phylum", "Term", "Estimate", "Std. Error", "z value", "Pr(>|z|)")
Joining, by = c("Phylum", "Term", "Estimate", "Std. Error", "z value", "Pr(>|z|)")
Joining, by = c("Phylum", "Term", "Estimate", "Std. Error", "z value", "Pr(>|z|)")
Joining, by = c("Phylum", "Term", "Estimate", "Std. Error", "z value", "Pr(>|z|)")
Joining, by = c("Phylum", "Term", "Estimate", "Std. Error", "z value", "Pr(>|z|)")kable(model6.pois.nb.results, format="html", digits=3)%>%
kable_styling(full_width = T) %>%
add_header_above(c('Poisson Model'=7, 'Negative Binomial Model'=7)) %>%
scroll_box(width="100%",height="5in")| pois.Phylum | pois.Term | pois.Estimate | pois.Std. Error | pois.z value | pois.Pr(>|z|) | pois.p.adjust | nb.Phylum | nb.Term | nb.Estimate | nb.Std. Error | nb.z value | nb.Pr(>|z|) | nb.p.adjust |
|---|---|---|---|---|---|---|---|---|---|---|---|---|---|
| Actinobacteria | time | 0.091 | 0.048 | 1.874 | 0.061 | 0.087 | Actinobacteria | time | 0.033 | 0.227 | 0.144 | 0.885 | 0.952 |
| Actinobacteria | time:intB | 0.147 | 0.062 | 2.365 | 0.018 | 0.027 | Actinobacteria | time:intB | 0.356 | 0.285 | 1.250 | 0.211 | 0.475 |
| Bacteroidetes | time | -0.022 | 0.004 | -6.008 | 0.000 | 0.000 | Bacteroidetes | time | -0.033 | 0.045 | -0.724 | 0.469 | 0.777 |
| Bacteroidetes | time:intB | -0.022 | 0.005 | -4.230 | 0.000 | 0.000 | Bacteroidetes | time:intB | -0.032 | 0.066 | -0.486 | 0.627 | 0.777 |
| Cyanobacteria | time | -0.075 | 0.041 | -1.826 | 0.068 | 0.092 | Cyanobacteria | time | -0.073 | 0.042 | -1.725 | 0.085 | 0.275 |
| Cyanobacteria | time:intB | -0.495 | 0.068 | -7.297 | 0.000 | 0.000 | Cyanobacteria | time:intB | -0.504 | 0.069 | -7.302 | 0.000 | 0.000 |
| Euryarchaeota | time | -0.194 | 0.385 | -0.503 | 0.615 | 0.701 | Euryarchaeota | time | -0.836 | 0.574 | -1.456 | 0.145 | 0.392 |
| Euryarchaeota | time:intB | 0.201 | 0.410 | 0.491 | 0.623 | 0.701 | Euryarchaeota | time:intB | 1.043 | 0.618 | 1.687 | 0.092 | 0.275 |
| Firmicutes | time | 0.035 | 0.004 | 9.818 | 0.000 | 0.000 | Firmicutes | time | 0.034 | 0.032 | 1.054 | 0.292 | 0.606 |
| Firmicutes | time:intB | -0.019 | 0.005 | -3.476 | 0.001 | 0.001 | Firmicutes | time:intB | -0.026 | 0.047 | -0.564 | 0.573 | 0.777 |
| Lentisphaerae | time | -0.006 | 0.079 | -0.082 | 0.935 | 0.935 | Lentisphaerae | time | 0.033 | 0.363 | 0.091 | 0.928 | 0.952 |
| Lentisphaerae | time:intB | 0.729 | 0.127 | 5.732 | 0.000 | 0.000 | Lentisphaerae | time:intB | 0.243 | 0.509 | 0.477 | 0.633 | 0.777 |
| Proteobacteria | time | -0.126 | 0.011 | -11.569 | 0.000 | 0.000 | Proteobacteria | time | -0.072 | 0.110 | -0.657 | 0.511 | 0.777 |
| Proteobacteria | time:intB | 0.193 | 0.017 | 11.174 | 0.000 | 0.000 | Proteobacteria | time:intB | 0.018 | 0.131 | 0.134 | 0.893 | 0.952 |
| Tenericutes | time | 0.583 | 0.030 | 19.297 | 0.000 | 0.000 | Tenericutes | time | 0.691 | 0.533 | 1.295 | 0.195 | 0.475 |
| Tenericutes | time:intB | 0.371 | 0.053 | 7.015 | 0.000 | 0.000 | Tenericutes | time:intB | 0.035 | 0.579 | 0.060 | 0.952 | 0.952 |
| Verrucomicrobia | time | -0.123 | 0.013 | -9.503 | 0.000 | 0.000 | Verrucomicrobia | time | -0.276 | 0.447 | -0.619 | 0.536 | 0.777 |
| Verrucomicrobia | time:intB | 0.274 | 0.019 | 14.530 | 0.000 | 0.000 | Verrucomicrobia | time:intB | 0.236 | 0.468 | 0.504 | 0.614 | 0.777 |
write.csv(model6.pois.nb.results, "tab/results_glmm_microbiome_phylum.csv")Nice Plot
N <- nrow(microbiome_data$meta.dat)
ids <- microbiome_data$meta.dat$ID
dat <- data.frame(microbiome_data$abund.list[["Phylum"]])
# NOTE: Special coding for stripping weird characters from bacteria names
j <- length(rownames(dat))
i <- 1
for(i in 1:j){
while( substring(rownames(dat[i,]), 1, 1) == "_"){
if(i == 1){
row.names(dat) <- c(substring(rownames(dat[i,]), 2),rownames(dat)[2:j])
}
if(i > 1 & i < j){
row.names(dat) <- c(rownames(dat[1:(i-1),]),
substring(rownames(dat[i,]), 2),
rownames(dat)[(i+1):j])
}
if(i == j){
row.names(dat) <- c(rownames(dat[1:(j-1),]),substring(rownames(dat[j,]), 2))
}
} # End while loop
} # End for loop
# ====================== #
num.bact <- nrow(dat)
dat <- t(dat[1:num.bact,1:N])
dat <- apply(dat, 2, function(x){log(x+1)})
k <- ncol(microbiome_data$meta.dat) # number of original variables
dat <- data.frame(cbind(microbiome_data$meta.dat, dat[ids,]))
# first phylum
PH <- names(phylum.fit6b$`Fitted Models`)
pL <- list()
i <- 1
for(i in 1:length(PH)){
fit <- phylum.fit6b$`Fitted Models`[[PH[i]]]
idat <- cbind(dat, fit=exp(predict(fit)))
idat <- idat %>% mutate(Week = (as.numeric(Week)-1)*4)
idat$PRED <- predict(fit, re.form=NA)
idat$Outcome <- idat[, PH[i]]
# extract p-value
pv <- filter(model6.results, Phylum == PH[i], Term == "time:intB")
pv <- ifelse(pv[7] >= .001, sprintf("= %.3f", pv[7]), "< 0.001")
pL[[PH[i]]] <- ggplot(idat, aes(Week, PRED, color=Intervention, group=SubjectID))+
geom_line() +
#geom_jitter(aes(x=Week, y=Outcome),
# width=0.25, height = 0)+
scale_x_continuous(breaks=c(0,4,8,12))+
scale_y_continuous(limits=c(-5,10), breaks=seq(-5,10,2.5))+
labs(y="log(Abundance)", title=paste0(PH[i])) +
annotate("text", x=6, y=10, label=paste0("p ", pv))+
theme_classic() +
theme(legend.position = c(0.5,0.5))
}
# extract legend
leg <- get_legend(pL[[1]])
# some specializing for more space
pL[[1]] <- pL[[1]] + theme(legend.position = "none",
axis.title.x = element_blank(),
axis.text.x = element_blank(),
axis.ticks.x = element_blank())
pL[[2]] <- pL[[2]] + theme(legend.position = "none",
axis.title = element_blank(),
axis.text = element_blank(),
axis.ticks = element_blank())
pL[[3]] <- pL[[3]] + theme(legend.position = "none",
axis.title = element_blank(),
axis.text = element_blank(),
axis.ticks = element_blank())
pL[[4]] <- pL[[4]] + theme(legend.position = "none",
axis.title = element_blank(),
axis.text = element_blank(),
axis.ticks = element_blank())
pL[[5]] <- pL[[5]] + theme(legend.position = "none",
axis.title = element_blank(),
axis.text = element_blank(),
axis.ticks = element_blank())
pL[[6]] <- pL[[6]] + theme(legend.position = "none")
pL[[7]] <- pL[[7]] + theme(legend.position = "none",
axis.title.y = element_blank(),
axis.text.y = element_blank(),
axis.ticks.y = element_blank())
pL[[8]] <- pL[[8]] + theme(legend.position = "none",
axis.title.y = element_blank(),
axis.text.y = element_blank(),
axis.ticks.y = element_blank())
pL[[9]] <- pL[[9]] + theme(legend.position = "none",
axis.title.y = element_blank(),
axis.text.y = element_blank(),
axis.ticks.y = element_blank())
# merge plot
p <- (pL[[1]] + pL[[2]] + pL[[3]] + pL[[4]] + pL[[5]] + pL[[6]] + pL[[7]] + pL[[8]] + pL[[9]] + leg) + plot_layout(ncol=5, nrow=2)
p
#ggsave("fig/figure5_glmm_phylum.pdf", p, units="in", width=10, height=4)
sessionInfo()R version 3.6.3 (2020-02-29)
Platform: x86_64-w64-mingw32/x64 (64-bit)
Running under: Windows 10 x64 (build 18362)
Matrix products: default
locale:
[1] LC_COLLATE=English_United States.1252
[2] LC_CTYPE=English_United States.1252
[3] LC_MONETARY=English_United States.1252
[4] LC_NUMERIC=C
[5] LC_TIME=English_United States.1252
attached base packages:
[1] stats graphics grDevices utils datasets methods base
other attached packages:
[1] cowplot_1.0.0 microbiome_1.8.0 car_3.0-8 carData_3.0-4
[5] gvlma_1.0.0.3 patchwork_1.0.0 viridis_0.5.1 viridisLite_0.3.0
[9] gridExtra_2.3 xtable_1.8-4 kableExtra_1.1.0 plyr_1.8.6
[13] data.table_1.12.8 readxl_1.3.1 forcats_0.5.0 stringr_1.4.0
[17] dplyr_0.8.5 purrr_0.3.4 readr_1.3.1 tidyr_1.1.0
[21] tibble_3.0.1 ggplot2_3.3.0 tidyverse_1.3.0 lmerTest_3.1-2
[25] lme4_1.1-23 Matrix_1.2-18 vegan_2.5-6 lattice_0.20-38
[29] permute_0.9-5 phyloseq_1.30.0
loaded via a namespace (and not attached):
[1] Rtsne_0.15 minqa_1.2.4 colorspace_1.4-1
[4] rio_0.5.16 ellipsis_0.3.1 rprojroot_1.3-2
[7] XVector_0.26.0 fs_1.4.1 rstudioapi_0.11
[10] farver_2.0.3 fansi_0.4.1 lubridate_1.7.8
[13] xml2_1.3.2 codetools_0.2-16 splines_3.6.3
[16] knitr_1.28 ade4_1.7-15 jsonlite_1.6.1
[19] workflowr_1.6.2 nloptr_1.2.2.1 broom_0.5.6
[22] cluster_2.1.0 dbplyr_1.4.4 BiocManager_1.30.10
[25] compiler_3.6.3 httr_1.4.1 backports_1.1.7
[28] assertthat_0.2.1 cli_2.0.2 later_1.0.0
[31] htmltools_0.4.0 tools_3.6.3 igraph_1.2.5
[34] gtable_0.3.0 glue_1.4.1 reshape2_1.4.4
[37] Rcpp_1.0.4.6 Biobase_2.46.0 cellranger_1.1.0
[40] vctrs_0.3.0 Biostrings_2.54.0 multtest_2.42.0
[43] ape_5.3 nlme_3.1-144 iterators_1.0.12
[46] xfun_0.14 openxlsx_4.1.5 rvest_0.3.5
[49] lifecycle_0.2.0 statmod_1.4.34 zlibbioc_1.32.0
[52] MASS_7.3-51.5 scales_1.1.1 hms_0.5.3
[55] promises_1.1.0 parallel_3.6.3 biomformat_1.14.0
[58] rhdf5_2.30.1 RColorBrewer_1.1-2 curl_4.3
[61] yaml_2.2.1 stringi_1.4.6 highr_0.8
[64] S4Vectors_0.24.4 foreach_1.5.0 BiocGenerics_0.32.0
[67] zip_2.0.4 boot_1.3-24 rlang_0.4.6
[70] pkgconfig_2.0.3 evaluate_0.14 Rhdf5lib_1.8.0
[73] labeling_0.3 tidyselect_1.1.0 magrittr_1.5
[76] R6_2.4.1 IRanges_2.20.2 generics_0.0.2
[79] DBI_1.1.0 foreign_0.8-75 pillar_1.4.4
[82] haven_2.3.0 withr_2.2.0 mgcv_1.8-31
[85] abind_1.4-5 survival_3.1-8 modelr_0.1.8
[88] crayon_1.3.4 rmarkdown_2.1 grid_3.6.3
[91] blob_1.2.1 git2r_0.27.1 reprex_0.3.0
[94] digest_0.6.25 webshot_0.5.2 httpuv_1.5.2
[97] numDeriv_2016.8-1.1 stats4_3.6.3 munsell_0.5.0