Species Barretts Relationships
Last updated: 2022-08-19
Checks: 6 1
Knit directory:
esoph-micro-cancer-workflow/
This reproducible R Markdown analysis was created with workflowr (version 1.7.0). The Checks tab describes the reproducibility checks that were applied when the results were created. The Past versions tab lists the development history.
The R Markdown file has unstaged changes. To know which version of
the R Markdown file created these results, you’ll want to first commit
it to the Git repo. If you’re still working on the analysis, you can
ignore this warning. When you’re finished, you can run
wflow_publish to commit the R Markdown file and build the
HTML.
Great job! The global environment was empty. Objects defined in the global environment can affect the analysis in your R Markdown file in unknown ways. For reproduciblity it’s best to always run the code in an empty environment.
The command set.seed(20200916) was run prior to running
the code in the R Markdown file. Setting a seed ensures that any results
that rely on randomness, e.g. subsampling or permutations, are
reproducible.
Great job! Recording the operating system, R version, and package versions is critical for reproducibility.
Nice! There were no cached chunks for this analysis, so you can be confident that you successfully produced the results during this run.
Great job! Using relative paths to the files within your workflowr project makes it easier to run your code on other machines.
Great! You are using Git for version control. Tracking code development and connecting the code version to the results is critical for reproducibility.
The results in this page were generated with repository version ff2197f. See the Past versions tab to see a history of the changes made to the R Markdown and HTML files.
Note that you need to be careful to ensure that all relevant files for
the analysis have been committed to Git prior to generating the results
(you can use wflow_publish or
wflow_git_commit). workflowr only checks the R Markdown
file, but you know if there are other scripts or data files that it
depends on. Below is the status of the Git repository when the results
were generated:
Ignored files:
    Ignored:    .Rhistory
    Ignored:    .Rproj.user/
    Ignored:    data.zip
    Ignored:    data/
    Ignored:    output/Supplement Figure 2.zip

Unstaged changes:
    Modified:   analysis/supplemental_figure2.Rmd
    Modified:   output/supplemental_figure2C_NCI_campy.pdf
    Modified:   output/supplemental_figure2C_NCI_campy.png
    Modified:   output/supplemental_figure2C_NCI_combined.pdf
    Modified:   output/supplemental_figure2C_NCI_combined.png
    Modified:   output/supplemental_figure2C_NCI_fuso.pdf
    Modified:   output/supplemental_figure2C_NCI_fuso.png
    Modified:   output/supplemental_figure2C_NCI_prevo.pdf
    Modified:   output/supplemental_figure2C_NCI_prevo.png
    Modified:   output/supplemental_figure2C_NCI_strepto.pdf
    Modified:   output/supplemental_figure2C_NCI_strepto.png
    Modified:   output/supplemental_figure2C_tcga_rna_campy.pdf
    Modified:   output/supplemental_figure2C_tcga_rna_campy.png
    Modified:   output/supplemental_figure2C_tcga_rna_combined.pdf
    Modified:   output/supplemental_figure2C_tcga_rna_combined.png
    Modified:   output/supplemental_figure2C_tcga_rna_fuso.pdf
    Modified:   output/supplemental_figure2C_tcga_rna_fuso.png
    Modified:   output/supplemental_figure2C_tcga_rna_prevo.pdf
    Modified:   output/supplemental_figure2C_tcga_rna_prevo.png
    Modified:   output/supplemental_figure2C_tcga_rna_strepto.pdf
    Modified:   output/supplemental_figure2C_tcga_rna_strepto.png
    Modified:   output/supplemental_figure2C_tcga_wgs_campy.pdf
    Modified:   output/supplemental_figure2C_tcga_wgs_campy.png
    Modified:   output/supplemental_figure2C_tcga_wgs_combined.pdf
    Modified:   output/supplemental_figure2C_tcga_wgs_combined.png
    Modified:   output/supplemental_figure2C_tcga_wgs_fuso.pdf
    Modified:   output/supplemental_figure2C_tcga_wgs_fuso.png
    Modified:   output/supplemental_figure2C_tcga_wgs_prevo.pdf
    Modified:   output/supplemental_figure2C_tcga_wgs_prevo.png
    Modified:   output/supplemental_figure2C_tcga_wgs_strepto.pdf
    Modified:   output/supplemental_figure2C_tcga_wgs_strepto.png
    Modified:   output/supplemental_figure2D_NCI_campy.pdf
    Modified:   output/supplemental_figure2D_NCI_campy.png
    Modified:   output/supplemental_figure2D_NCI_combined.pdf
    Modified:   output/supplemental_figure2D_NCI_combined.png
    Modified:   output/supplemental_figure2D_NCI_fuso.pdf
    Modified:   output/supplemental_figure2D_NCI_fuso.png
    Modified:   output/supplemental_figure2D_NCI_prevo.pdf
    Modified:   output/supplemental_figure2D_NCI_prevo.png
    Modified:   output/supplemental_figure2D_NCI_strepto.pdf
    Modified:   output/supplemental_figure2D_NCI_strepto.png
    Modified:   output/supplemental_figure2D_tcga_rna_campy.pdf
    Modified:   output/supplemental_figure2D_tcga_rna_campy.png
    Modified:   output/supplemental_figure2D_tcga_rna_combined.pdf
    Modified:   output/supplemental_figure2D_tcga_rna_combined.png
    Modified:   output/supplemental_figure2D_tcga_rna_fuso.pdf
    Modified:   output/supplemental_figure2D_tcga_rna_fuso.png
    Modified:   output/supplemental_figure2D_tcga_rna_prevo.pdf
    Modified:   output/supplemental_figure2D_tcga_rna_prevo.png
    Modified:   output/supplemental_figure2D_tcga_rna_strepto.pdf
    Modified:   output/supplemental_figure2D_tcga_rna_strepto.png
    Modified:   output/supplemental_figure2D_tcga_wgs_campy.pdf
    Modified:   output/supplemental_figure2D_tcga_wgs_campy.png
    Modified:   output/supplemental_figure2D_tcga_wgs_combined.pdf
    Modified:   output/supplemental_figure2D_tcga_wgs_combined.png
    Modified:   output/supplemental_figure2D_tcga_wgs_fuso.pdf
    Modified:   output/supplemental_figure2D_tcga_wgs_fuso.png
    Modified:   output/supplemental_figure2D_tcga_wgs_prevo.pdf
    Modified:   output/supplemental_figure2D_tcga_wgs_prevo.png
    Modified:   output/supplemental_figure2D_tcga_wgs_strepto.pdf
    Modified:   output/supplemental_figure2D_tcga_wgs_strepto.png
    Modified:   output/supplemental_figure2E_NCI_campy.pdf
    Modified:   output/supplemental_figure2E_NCI_campy.png
    Modified:   output/supplemental_figure2E_NCI_combined.pdf
    Modified:   output/supplemental_figure2E_NCI_combined.png
    Modified:   output/supplemental_figure2E_NCI_fuso.pdf
    Modified:   output/supplemental_figure2E_NCI_fuso.png
    Modified:   output/supplemental_figure2E_NCI_prevo.pdf
    Modified:   output/supplemental_figure2E_NCI_prevo.png
    Modified:   output/supplemental_figure2E_NCI_strepto.pdf
    Modified:   output/supplemental_figure2E_NCI_strepto.png
    Modified:   output/supplemental_figure2E_tcga_rna_campy.pdf
    Modified:   output/supplemental_figure2E_tcga_rna_campy.png
    Modified:   output/supplemental_figure2E_tcga_rna_combined.pdf
    Modified:   output/supplemental_figure2E_tcga_rna_combined.png
    Modified:   output/supplemental_figure2E_tcga_rna_fuso.pdf
    Modified:   output/supplemental_figure2E_tcga_rna_fuso.png
    Modified:   output/supplemental_figure2E_tcga_rna_prevo.pdf
    Modified:   output/supplemental_figure2E_tcga_rna_prevo.png
    Modified:   output/supplemental_figure2E_tcga_rna_strepto.pdf
    Modified:   output/supplemental_figure2E_tcga_rna_strepto.png
    Modified:   output/supplemental_figure2E_tcga_wgs_campy.pdf
    Modified:   output/supplemental_figure2E_tcga_wgs_campy.png
    Modified:   output/supplemental_figure2E_tcga_wgs_combined.pdf
    Modified:   output/supplemental_figure2E_tcga_wgs_combined.png
    Modified:   output/supplemental_figure2E_tcga_wgs_fuso.pdf
    Modified:   output/supplemental_figure2E_tcga_wgs_fuso.png
    Modified:   output/supplemental_figure2E_tcga_wgs_prevo.pdf
    Modified:   output/supplemental_figure2E_tcga_wgs_prevo.png
    Modified:   output/supplemental_figure2E_tcga_wgs_strepto.pdf
    Modified:   output/supplemental_figure2E_tcga_wgs_strepto.png
    Modified:   output/supplemental_figure2F_NCI_campy.pdf
    Modified:   output/supplemental_figure2F_NCI_campy.png
    Modified:   output/supplemental_figure2F_NCI_combined.pdf
    Modified:   output/supplemental_figure2F_NCI_combined.png
    Modified:   output/supplemental_figure2F_NCI_fuso.pdf
    Modified:   output/supplemental_figure2F_NCI_fuso.png
    Modified:   output/supplemental_figure2F_NCI_prevo.pdf
    Modified:   output/supplemental_figure2F_NCI_prevo.png
    Modified:   output/supplemental_figure2F_NCI_strepto.pdf
    Modified:   output/supplemental_figure2F_NCI_strepto.png
    Modified:   output/supplemental_figure2F_tcga_rna_campy.pdf
    Modified:   output/supplemental_figure2F_tcga_rna_campy.png
    Modified:   output/supplemental_figure2F_tcga_rna_combined.pdf
    Modified:   output/supplemental_figure2F_tcga_rna_combined.png
    Modified:   output/supplemental_figure2F_tcga_rna_fuso.pdf
    Modified:   output/supplemental_figure2F_tcga_rna_fuso.png
    Modified:   output/supplemental_figure2F_tcga_rna_prevo.pdf
    Modified:   output/supplemental_figure2F_tcga_rna_prevo.png
    Modified:   output/supplemental_figure2F_tcga_rna_strepto.pdf
    Modified:   output/supplemental_figure2F_tcga_rna_strepto.png
    Modified:   output/supplemental_figure2F_tcga_wgs_campy.pdf
    Modified:   output/supplemental_figure2F_tcga_wgs_campy.png
    Modified:   output/supplemental_figure2F_tcga_wgs_combined.pdf
    Modified:   output/supplemental_figure2F_tcga_wgs_combined.png
    Modified:   output/supplemental_figure2F_tcga_wgs_fuso.pdf
    Modified:   output/supplemental_figure2F_tcga_wgs_fuso.png
    Modified:   output/supplemental_figure2F_tcga_wgs_prevo.pdf
    Modified:   output/supplemental_figure2F_tcga_wgs_prevo.png
    Modified:   output/supplemental_figure2F_tcga_wgs_strepto.pdf
    Modified:   output/supplemental_figure2F_tcga_wgs_strepto.png
Note that any generated files, e.g. HTML, png, CSS, etc., are not included in this status report because it is ok for generated content to have uncommitted changes.
These are the previous versions of the repository in which changes were
made to the R Markdown (analysis/supplemental_figure2.Rmd)
and HTML (docs/supplemental_figure2.html) files. If you’ve
configured a remote Git repository (see ?wflow_git_remote),
click on the hyperlinks in the table below to view the files as they
were in that past version.
| File | Version | Author | Date | Message |
|---|---|---|---|---|
| Rmd | ff2197f | noah-padgett | 2022-08-15 | updated figure dim for workflow |
| html | ff2197f | noah-padgett | 2022-08-15 | updated figure dim for workflow |
| html | 72212e0 | noah-padgett | 2022-08-15 | Update website to include supp fig 2 |
| Rmd | cb1cd82 | noah-padgett | 2022-08-15 | Updated sup figure 2 parts |
Histology (+/- Barretts)
#root function
root<-function(x){
  x <- ifelse(x < 0, 0, x)
  x**(0.25)
}
#inverse root function
invroot<-function(x){
  x**(4)
}
DIM <- c(6, 4)

# merge datasets by subsetting to specific variables then merging
analysis.dat <- dat.16s.s %>%
  dplyr::mutate(ID = as.factor(accession.number),
                Barretts = ifelse(`Barretts.`=="Y",1,0)) %>%
  dplyr::select(OTU, sample_type, tumor, Abundance, ID, source, Barretts)

dat <- dat.rna.s %>%
  dplyr::mutate(Barretts = ifelse(Barrett.s.Esophagus.Reported=="Yes",1,0)) %>%
  dplyr::select(OTU, sample_type, tumor, Abundance, ID, source, Barretts)
analysis.dat <- full_join(analysis.dat, dat)
Joining, by = c("OTU", "sample_type", "tumor", "Abundance", "ID", "source",
"Barretts")dat <- dat.wgs.s %>%
dplyr::mutate(Barretts = ifelse(Barrett.s.Esophagus.Reported=="Yes",1,0)) %>%
dplyr::select(OTU, sample_type, tumor, Abundance, ID, source, Barretts)
analysis.dat <- full_join(analysis.dat, dat) %>%
mutate(
pres = ifelse(Abundance > 0, 1, 0),
Abund = Abundance*100,
Tumor = ifelse(tumor==1, "Tumor", "No Tumor"),
Barretts = ifelse(Barretts == 1, "Yes", "No")
)Joining, by = c("OTU", "sample_type", "tumor", "Abundance", "ID", "source",
"Barretts")TITLE_P1 <- c("NCI 16s Data", "TCGA RNAseq Data", "TCGA WGS Data")
TITLE_P2 <- c("Between Barretts Status", "Between Gender", "Across Races", "Across Stages")
SUBTITLE <-c("Combined across bacteria", "Fusobacterium nucleatum", "Prevotella melaninogenica", "Campylobacter concisus", 'Streptococcus sanguinis')
test_results <- expand.grid(TITLE_P1, SUBTITLE, TITLE_P2)
colnames(test_results) <- c("Data", "Bacteria", "Outcome")
test_results$est <- NA
test_results$pvalue <- NA
i <- 1
d <- analysis.dat %>%
filter(!is.na(Barretts), source=="16s")
m1<-wilcox.test(Abund ~ Barretts, data=d, na.rm=TRUE, paired=FALSE, exact=FALSE, conf.int=TRUE)
m1
    Wilcoxon rank sum test with continuity correction

data:  Abund by Barretts
W = 49993, p-value = 0.7934
alternative hypothesis: true location shift is not equal to 0
95 percent confidence interval:
 -8.872113e-05  8.362287e-05
sample estimates:
difference in location
          9.397832e-06
test_results[i,4] <- m1$estimate
test_results[i,5] <- m1$p.value
p <- analysis.dat %>%
filter(!is.na(Barretts), source=="16s")%>%
ggplot(aes(x=Barretts, y=Abund))+
geom_violin(scale="width", adjust=1)+
geom_jitter(alpha=0.5, width = 0.25)+
scale_y_continuous(
trans=scales::trans_new("root", root, invroot),
breaks=c(0, 0.001,0.01, 0.1, 1,10,50, 100),
labels = c(0, 0.001,0.01, 0.1, 1,10,50, 100),
limits = c(0, 110)
) +
labs(x="Barretts", y="Relative Abundance (%)",
title=paste0(TITLE_P1[1]," Bacteria Relative Abundance ",TITLE_P2[1]),
subtitle=SUBTITLE[1])+
annotate("text", x=1.5, y=90, label=paste0("p=",round(test_results$pvalue[i],4)))+
geom_segment(aes(x=1, xend=2,y=105,yend=105))+
geom_segment(aes(x=1, xend=1,y=109,yend=100))+
geom_segment(aes(x=2, xend=2,y=109,yend=100))+
theme_classic()
pWarning: Removed 120 rows containing missing values (geom_point).
ggsave("output/supplemental_figure2C_NCI_combined.pdf", p, units = "in", width = DIM[1], height = DIM[2])Warning: Removed 137 rows containing missing values (geom_point).ggsave("output/supplemental_figure2C_NCI_combined.png", p, units = "in", width = DIM[1], height = DIM[2])Warning: Removed 127 rows containing missing values (geom_point).i <- i+1
d <- analysis.dat %>%
filter(!is.na(Barretts), source=="rna")
m1<-wilcox.test(Abund ~ Barretts, data=d, na.rm=TRUE, paired=FALSE, exact=FALSE, conf.int=TRUE)
m1
    Wilcoxon rank sum test with continuity correction

data:  Abund by Barretts
W = 14528, p-value = 0.04244
alternative hypothesis: true location shift is not equal to 0
95 percent confidence interval:
 3.138475e-05 6.413702e-04
sample estimates:
difference in location
          4.994654e-05
test_results[i,4] <- m1$estimate
test_results[i,5] <- m1$p.value
p <- analysis.dat %>%
filter(source=="rna", !is.na(Barretts))%>%
ggplot(aes(x=Barretts, y=Abund))+
geom_violin(scale="width", adjust=1)+
geom_jitter(alpha=0.5, width = 0.25)+
scale_y_continuous(
trans=scales::trans_new("root", root, invroot),
breaks=c(0, 0.001,0.01, 0.1, 1,10,50, 100),
labels = c(0, 0.001,0.01, 0.1, 1,10,50, 100),
limits = c(0, 110)
) +
labs(x="Barretts", y="Relative Abundance (%)",
title=paste0(TITLE_P1[2]," Bacteria Relative Abundance ",TITLE_P2[1]),
subtitle=SUBTITLE[1])+
annotate("text", x=1.5, y=90, label=paste0("p=",round(test_results$pvalue[i],4)))+
geom_segment(aes(x=1, xend=2,y=105,yend=105))+
geom_segment(aes(x=1, xend=1,y=109,yend=100))+
geom_segment(aes(x=2, xend=2,y=109,yend=100))+
theme_classic()
pWarning: Removed 749 rows containing non-finite values (stat_ydensity).Warning: Removed 828 rows containing missing values (geom_point).
ggsave("output/supplemental_figure2C_tcga_rna_combined.pdf", p, units = "in", width = DIM[1], height = DIM[2])Warning: Removed 749 rows containing non-finite values (stat_ydensity).Warning: Removed 822 rows containing missing values (geom_point).ggsave("output/supplemental_figure2C_tcga_rna_combined.png", p, units = "in", width = DIM[1], height = DIM[2])Warning: Removed 749 rows containing non-finite values (stat_ydensity).Warning: Removed 818 rows containing missing values (geom_point).i <- i+1
d <- analysis.dat %>%
filter(!is.na(Barretts), source=="wgs")
m1<-wilcox.test(Abund ~ Barretts, data=d, na.rm=TRUE, paired=FALSE, exact=FALSE, conf.int=TRUE)
m1
    Wilcoxon rank sum test with continuity correction

data:  Abund by Barretts
W = 21643, p-value = 0.03722
alternative hypothesis: true location shift is not equal to 0
95 percent confidence interval:
 7.669214e-05 6.163255e-06
sample estimates:
difference in location
          1.499786e-05
test_results[i,4] <- m1$estimate
test_results[i,5] <- m1$p.value
p <- analysis.dat %>%
filter(source=="wgs", !is.na(Barretts))%>%
ggplot(aes(x=Barretts, y=Abund))+
geom_violin(scale="width", adjust=1)+
geom_jitter(alpha=0.5, width = 0.25)+
scale_y_continuous(
trans=scales::trans_new("root", root, invroot),
breaks=c(0, 0.001,0.01, 0.1, 1,10,50, 100),
labels = c(0, 0.001,0.01, 0.1, 1,10,50, 100),
limits = c(0, 110)
) +
labs(x="Barretts", y="Relative Abundance (%)",
title=paste0(TITLE_P1[3]," Bacteria Relative Abundance ",TITLE_P2[1]),
subtitle=SUBTITLE[1])+
annotate("text", x=1.5, y=90, label=paste0("p=",round(test_results$pvalue[i],4)))+
geom_segment(aes(x=1, xend=2,y=105,yend=105))+
geom_segment(aes(x=1, xend=1,y=109,yend=100))+
geom_segment(aes(x=2, xend=2,y=109,yend=100))+
theme_classic()
pWarning: Removed 112 rows containing non-finite values (stat_ydensity).Warning: Removed 321 rows containing missing values (geom_point).
ggsave("output/supplemental_figure2C_tcga_wgs_combined.pdf", p, units = "in", width = DIM[1], height = DIM[2])Warning: Removed 112 rows containing non-finite values (stat_ydensity).Warning: Removed 304 rows containing missing values (geom_point).ggsave("output/supplemental_figure2C_tcga_wgs_combined.png", p, units = "in", width = DIM[1], height = DIM[2])Warning: Removed 112 rows containing non-finite values (stat_ydensity).Warning: Removed 337 rows containing missing values (geom_point).Subset by Bacterium
# merge datasets by subsetting to specific variables then merging
analysis.dat <- dat.16s.s %>%
  dplyr::mutate(ID = as.factor(accession.number),
                Barretts = ifelse(`Barretts.`=="Y",1,0)) %>%
  dplyr::select(OTU, sample_type, tumor, Abundance, ID, source, Barretts)

dat <- dat.rna.s %>%
  dplyr::mutate(Barretts = ifelse(Barrett.s.Esophagus.Reported=="Yes",1,0)) %>%
  dplyr::select(OTU, sample_type, tumor, Abundance, ID, source, Barretts)
analysis.dat <- full_join(analysis.dat, dat)
Joining, by = c("OTU", "sample_type", "tumor", "Abundance", "ID", "source",
"Barretts")dat <- dat.wgs.s %>%
dplyr::mutate(Barretts = ifelse(Barrett.s.Esophagus.Reported=="Yes",1,0)) %>%
dplyr::select(OTU, sample_type, tumor, Abundance, ID, source, Barretts)
analysis.dat <- full_join(analysis.dat, dat) %>%
mutate(
pres = ifelse(Abundance > 0, 1, 0),
Abund = Abundance*100,
Tumor = ifelse(tumor==1, "Tumor", "No Tumor"),
Barretts = ifelse(Barretts == 1, "Yes", "No")
)Joining, by = c("OTU", "sample_type", "tumor", "Abundance", "ID", "source",
"Barretts")i <- i+1
d <- analysis.dat %>%
filter(!is.na(Barretts), source=="16s", OTU == "Fusobacterium nucleatum")
m1<-wilcox.test(Abund ~ Barretts, data=d, na.rm=TRUE, paired=FALSE, exact=FALSE, conf.int=TRUE)
m1
    Wilcoxon rank sum test with continuity correction

data:  Abund by Barretts
W = 3070.5, p-value = 0.9471
alternative hypothesis: true location shift is not equal to 0
95 percent confidence interval:
 -8.959180e-06  6.090329e-05
sample estimates:
difference in location
         -2.198988e-05
test_results[i,4] <- m1$estimate
test_results[i,5] <- m1$p.value
p <- analysis.dat %>%
filter(!is.na(Barretts), source=="16s", OTU == "Fusobacterium nucleatum")%>%
ggplot(aes(x=Barretts, y=Abund))+
geom_violin(scale="width", adjust=1)+
geom_jitter(alpha=0.5, width = 0.25)+
scale_y_continuous(
trans=scales::trans_new("root", root, invroot),
breaks=c(0, 0.001,0.01, 0.1, 1,10,50, 100),
labels = c(0, 0.001,0.01, 0.1, 1,10,50, 100),
limits = c(0, 110)
) +
labs(x="Barretts", y="Relative Abundance (%)",
title=paste0(TITLE_P1[1]," Bacteria Relative Abundance ",TITLE_P2[1]),
subtitle=SUBTITLE[2])+
annotate("text", x=1.5, y=90, label=paste0("p=",round(test_results$pvalue[i],4)))+
geom_segment(aes(x=1, xend=2,y=105,yend=105))+
geom_segment(aes(x=1, xend=1,y=109,yend=100))+
geom_segment(aes(x=2, xend=2,y=109,yend=100))+
theme_classic()
pWarning: Removed 44 rows containing missing values (geom_point).
ggsave("output/supplemental_figure2C_NCI_fuso.pdf", p, units = "in", width = DIM[1], height = DIM[2])Warning: Removed 40 rows containing missing values (geom_point).ggsave("output/supplemental_figure2C_NCI_fuso.png", p, units = "in", width = DIM[1], height = DIM[2])Warning: Removed 45 rows containing missing values (geom_point).i <- i+1
d <- analysis.dat %>%
filter(!is.na(Barretts), source=="rna", OTU == "Fusobacterium nucleatum")
m1<-wilcox.test(Abund ~ Barretts, data=d, na.rm=TRUE, paired=FALSE, exact=FALSE, conf.int=TRUE)
m1
    Wilcoxon rank sum test with continuity correction

data:  Abund by Barretts
W = 305, p-value = 0.3695
alternative hypothesis: true location shift is not equal to 0
95 percent confidence interval:
 -0.004713574  0.010418841
sample estimates:
difference in location
           0.001023278
test_results[i,4] <- m1$estimate
test_results[i,5] <- m1$p.value
p <- analysis.dat %>%
filter(!is.na(Barretts), source=="rna", OTU == "Fusobacterium nucleatum")%>%
ggplot(aes(x=Barretts, y=Abund))+
geom_violin(scale="width", adjust=1)+
geom_jitter(alpha=0.5, width = 0.25)+
scale_y_continuous(
trans=scales::trans_new("root", root, invroot),
breaks=c(0, 0.001,0.01, 0.1, 1,10,50, 100),
labels = c(0, 0.001,0.01, 0.1, 1,10,50, 100),
limits = c(0, 110)
) +
labs(x="Barretts", y="Relative Abundance (%)",
title=paste0(TITLE_P1[2]," Bacteria Relative Abundance ",TITLE_P2[1]),
subtitle=SUBTITLE[2])+
annotate("text", x=1.5, y=90, label=paste0("p=",round(test_results$pvalue[i],4)))+
geom_segment(aes(x=1, xend=2,y=105,yend=105))+
geom_segment(aes(x=1, xend=1,y=109,yend=100))+
geom_segment(aes(x=2, xend=2,y=109,yend=100))+
theme_classic()
pWarning: Removed 107 rows containing non-finite values (stat_ydensity).Warning: Removed 112 rows containing missing values (geom_point).
ggsave("output/supplemental_figure2C_tcga_rna_fuso.pdf", p, units = "in", width = DIM[1], height = DIM[2])Warning: Removed 107 rows containing non-finite values (stat_ydensity).Warning: Removed 109 rows containing missing values (geom_point).ggsave("output/supplemental_figure2C_tcga_rna_fuso.png", p, units = "in", width = DIM[1], height = DIM[2])Warning: Removed 107 rows containing non-finite values (stat_ydensity).
Removed 109 rows containing missing values (geom_point).i <- i+1
d <- analysis.dat %>%
filter(!is.na(Barretts), source=="wgs", OTU == "Fusobacterium nucleatum")
m1<-wilcox.test(Abund ~ Barretts, data=d, na.rm=TRUE, paired=FALSE, exact=FALSE, conf.int=TRUE)
m1
    Wilcoxon rank sum test with continuity correction

data:  Abund by Barretts
W = 436, p-value = 0.5109
alternative hypothesis: true location shift is not equal to 0
95 percent confidence interval:
 -7.669283e-05  1.113313e-01
sample estimates:
difference in location
          4.479859e-05
test_results[i,4] <- m1$estimate
test_results[i,5] <- m1$p.value
p <- analysis.dat %>%
filter(!is.na(Barretts), source=="wgs", OTU == "Fusobacterium nucleatum")%>%
ggplot(aes(x=Barretts, y=Abund))+
geom_violin(scale="width", adjust=1)+
geom_jitter(alpha=0.5, width = 0.25)+
scale_y_continuous(
trans=scales::trans_new("root", root, invroot),
breaks=c(0, 0.001,0.01, 0.1, 1,10,50, 100),
labels = c(0, 0.001,0.01, 0.1, 1,10,50, 100),
limits = c(0, 110)
) +
labs(x="Barretts", y="Relative Abundance (%)",
title=paste0(TITLE_P1[3]," Bacteria Relative Abundance ",TITLE_P2[1]),
subtitle=SUBTITLE[2])+
annotate("text", x=1.5, y=90, label=paste0("p=",round(test_results$pvalue[i],4)))+
geom_segment(aes(x=1, xend=2,y=105,yend=105))+
geom_segment(aes(x=1, xend=1,y=109,yend=100))+
geom_segment(aes(x=2, xend=2,y=109,yend=100))+
theme_classic()
pWarning: Removed 16 rows containing non-finite values (stat_ydensity).Warning: Removed 42 rows containing missing values (geom_point).
ggsave("output/supplemental_figure2C_tcga_wgs_fuso.pdf", p, units = "in", width = DIM[1], height = DIM[2])Warning: Removed 16 rows containing non-finite values (stat_ydensity).Warning: Removed 30 rows containing missing values (geom_point).ggsave("output/supplemental_figure2C_tcga_wgs_fuso.png", p, units = "in", width = DIM[1], height = DIM[2])Warning: Removed 16 rows containing non-finite values (stat_ydensity).Warning: Removed 36 rows containing missing values (geom_point).i <- i+1
d <- analysis.dat %>%
filter(!is.na(Barretts), source=="16s", OTU == "Prevotella melaninogenica" | OTU =="Prevotella spp.")
m1<-wilcox.test(Abund ~ Barretts, data=d, na.rm=TRUE, paired=FALSE, exact=FALSE, conf.int=TRUE)
m1
    Wilcoxon rank sum test with continuity correction

data:  Abund by Barretts
W = 3094, p-value = 0.9859
alternative hypothesis: true location shift is not equal to 0
95 percent confidence interval:
 -0.4039867  0.3999948
sample estimates:
difference in location
          9.583038e-05
test_results[i,4] <- m1$estimate
test_results[i,5] <- m1$p.value
p <- analysis.dat %>%
filter(!is.na(Barretts), source=="16s", OTU == "Prevotella melaninogenica" | OTU =="Prevotella spp.")%>%
ggplot(aes(x=Barretts, y=Abund))+
geom_violin(scale="width", adjust=1)+
geom_jitter(alpha=0.5, width = 0.25)+
scale_y_continuous(
trans=scales::trans_new("root", root, invroot),
breaks=c(0, 0.001,0.01, 0.1, 1,10,50, 100),
labels = c(0, 0.001,0.01, 0.1, 1,10,50, 100),
limits = c(0, 110)
) +
labs(x="Barretts", y="Relative Abundance (%)",
title=paste0(TITLE_P1[1]," Bacteria Relative Abundance ",TITLE_P2[1]),
subtitle=SUBTITLE[3])+
annotate("text", x=1.5, y=90, label=paste0("p=",round(test_results$pvalue[i],4)))+
geom_segment(aes(x=1, xend=2,y=105,yend=105))+
geom_segment(aes(x=1, xend=1,y=109,yend=100))+
geom_segment(aes(x=2, xend=2,y=109,yend=100))+
theme_classic()
pWarning: Removed 22 rows containing missing values (geom_point).
ggsave("output/supplemental_figure2C_NCI_prevo.pdf", p, units = "in", width = DIM[1], height = DIM[2])Warning: Removed 16 rows containing missing values (geom_point).ggsave("output/supplemental_figure2C_NCI_prevo.png", p, units = "in", width = DIM[1], height = DIM[2])Warning: Removed 25 rows containing missing values (geom_point).i <- i+1
d <- analysis.dat %>%
filter(!is.na(Barretts), source=="rna", OTU == "Prevotella melaninogenica")
m1<-wilcox.test(Abund ~ Barretts, data=d, na.rm=TRUE, paired=FALSE, exact=FALSE, conf.int=TRUE)
m1
    Wilcoxon rank sum test with continuity correction

data:  Abund by Barretts
W = 334, p-value = 0.15
alternative hypothesis: true location shift is not equal to 0
95 percent confidence interval:
 -0.0006693769  0.0297048288
sample estimates:
difference in location
           0.003703834
test_results[i,4] <- m1$estimate
test_results[i,5] <- m1$p.value
p <- analysis.dat %>%
filter(!is.na(Barretts), source=="rna", OTU == "Prevotella melaninogenica")%>%
ggplot(aes(x=Barretts, y=Abund))+
geom_violin(scale="width", adjust=1)+
geom_jitter(alpha=0.5, width = 0.25)+
scale_y_continuous(
trans=scales::trans_new("root", root, invroot),
breaks=c(0, 0.001,0.01, 0.1, 1,10,50, 100),
labels = c(0, 0.001,0.01, 0.1, 1,10,50, 100),
limits = c(0, 110)
) +
labs(x="Barretts", y="Relative Abundance (%)",
title=paste0(TITLE_P1[2]," Bacteria Relative Abundance ",TITLE_P2[1]),
subtitle=SUBTITLE[3])+
annotate("text", x=1.5, y=90, label=paste0("p=",round(test_results$pvalue[i],4)))+
geom_segment(aes(x=1, xend=2,y=105,yend=105))+
geom_segment(aes(x=1, xend=1,y=109,yend=100))+
geom_segment(aes(x=2, xend=2,y=109,yend=100))+
theme_classic()
pWarning: Removed 107 rows containing non-finite values (stat_ydensity).Warning: Removed 109 rows containing missing values (geom_point).
ggsave("output/supplemental_figure2C_tcga_rna_prevo.pdf", p, units = "in", width = DIM[1], height = DIM[2])Warning: Removed 107 rows containing non-finite values (stat_ydensity).Warning: Removed 111 rows containing missing values (geom_point).ggsave("output/supplemental_figure2C_tcga_rna_prevo.png", p, units = "in", width = DIM[1], height = DIM[2])Warning: Removed 107 rows containing non-finite values (stat_ydensity).Warning: Removed 109 rows containing missing values (geom_point).i <- i+1
d <- analysis.dat %>%
filter(!is.na(Barretts), source=="wgs", OTU == "Prevotella melaninogenica")
m1<-wilcox.test(Abund ~ Barretts, data=d, na.rm=TRUE, paired=FALSE, exact=FALSE, conf.int=TRUE)
m1
    Wilcoxon rank sum test with continuity correction

data:  Abund by Barretts
W = 511, p-value = 0.1088
alternative hypothesis: true location shift is not equal to 0
95 percent confidence interval:
 -4.578309e-05  5.374254e-01
sample estimates:
difference in location
            0.03632853
test_results[i,4] <- m1$estimate
test_results[i,5] <- m1$p.value
p <- analysis.dat %>%
filter(!is.na(Barretts), source=="wgs", OTU == "Prevotella melaninogenica")%>%
ggplot(aes(x=Barretts, y=Abund))+
geom_violin(scale="width", adjust=1)+
geom_jitter(alpha=0.5, width = 0.25)+
scale_y_continuous(
trans=scales::trans_new("root", root, invroot),
breaks=c(0, 0.001,0.01, 0.1, 1,10,50, 100),
labels = c(0, 0.001,0.01, 0.1, 1,10,50, 100),
limits = c(0, 110)
) +
labs(x="Barretts", y="Relative Abundance (%)",
title=paste0(TITLE_P1[3]," Bacteria Relative Abundance ",TITLE_P2[1]),
subtitle=SUBTITLE[3])+
annotate("text", x=1.5, y=90, label=paste0("p=",round(test_results$pvalue[i],4)))+
geom_segment(aes(x=1, xend=2,y=105,yend=105))+
geom_segment(aes(x=1, xend=1,y=109,yend=100))+
geom_segment(aes(x=2, xend=2,y=109,yend=100))+
theme_classic()
pWarning: Removed 16 rows containing non-finite values (stat_ydensity).Warning: Removed 31 rows containing missing values (geom_point).
ggsave("output/supplemental_figure2C_tcga_wgs_prevo.pdf", p, units = "in", width = DIM[1], height = DIM[2])Warning: Removed 16 rows containing non-finite values (stat_ydensity).Warning: Removed 33 rows containing missing values (geom_point).ggsave("output/supplemental_figure2C_tcga_wgs_prevo.png", p, units = "in", width = DIM[1], height = DIM[2])Warning: Removed 16 rows containing non-finite values (stat_ydensity).
Removed 33 rows containing missing values (geom_point).i <- i+1
d <- analysis.dat %>%
filter(!is.na(Barretts), source=="16s", OTU == "Campylobacter concisus")
m1<-wilcox.test(Abund ~ Barretts, data=d, na.rm=TRUE, paired=FALSE, exact=FALSE, conf.int=TRUE)
m1
    Wilcoxon rank sum test with continuity correction

data:  Abund by Barretts
W = 3002, p-value = 0.6722
alternative hypothesis: true location shift is not equal to 0
95 percent confidence interval:
 -3.984863e-05  3.951250e-06
sample estimates:
difference in location
         -1.818304e-05
test_results[i,4] <- m1$estimate
test_results[i,5] <- m1$p.value
p <- analysis.dat %>%
filter(!is.na(Barretts), source=="16s", OTU == "Campylobacter concisus")%>%
ggplot(aes(x=Barretts, y=Abund))+
geom_violin(scale="width", adjust=1)+
geom_jitter(alpha=0.5, width = 0.25)+
scale_y_continuous(
trans=scales::trans_new("root", root, invroot),
breaks=c(0, 0.001,0.01, 0.1, 1,10,50, 100),
labels = c(0, 0.001,0.01, 0.1, 1,10,50, 100),
limits = c(0, 110)
) +
labs(x="Barretts", y="Relative Abundance (%)",
title=paste0(TITLE_P1[1]," Bacteria Relative Abundance ",TITLE_P2[1]),
subtitle=SUBTITLE[4])+
annotate("text", x=1.5, y=90, label=paste0("p=",round(test_results$pvalue[i],4)))+
geom_segment(aes(x=1, xend=2,y=105,yend=105))+
geom_segment(aes(x=1, xend=1,y=109,yend=100))+
geom_segment(aes(x=2, xend=2,y=109,yend=100))+
theme_classic()
pWarning: Removed 70 rows containing missing values (geom_point).
ggsave("output/supplemental_figure2C_NCI_campy.pdf", p, units = "in", width = DIM[1], height = DIM[2])Warning: Removed 67 rows containing missing values (geom_point).ggsave("output/supplemental_figure2C_NCI_campy.png", p, units = "in", width = DIM[1], height = DIM[2])Warning: Removed 65 rows containing missing values (geom_point).i <- i+1
d <- analysis.dat %>%
filter(!is.na(Barretts), source=="rna", OTU == "Campylobacter concisus")
m1<-wilcox.test(Abund ~ Barretts, data=d, na.rm=TRUE, paired=FALSE, exact=FALSE, conf.int=TRUE)
m1
    Wilcoxon rank sum test with continuity correction

data:  Abund by Barretts
W = 324, p-value = 0.1411
alternative hypothesis: true location shift is not equal to 0
95 percent confidence interval:
 -1.492392e-05  4.003460e-04
sample estimates:
difference in location
          2.641329e-06
test_results[i,4] <- m1$estimate
test_results[i,5] <- m1$p.value
p <- analysis.dat %>%
filter(!is.na(Barretts), source=="rna", OTU == "Campylobacter concisus")%>%
ggplot(aes(x=Barretts, y=Abund))+
geom_violin(scale="width", adjust=1)+
geom_jitter(alpha=0.5, width = 0.25)+
scale_y_continuous(
trans=scales::trans_new("root", root, invroot),
breaks=c(0, 0.001,0.01, 0.1, 1,10,50, 100),
labels = c(0, 0.001,0.01, 0.1, 1,10,50, 100),
limits = c(0, 110)
) +
labs(x="Barretts", y="Relative Abundance (%)",
title=paste0(TITLE_P1[2]," Bacteria Relative Abundance ",TITLE_P2[1]),
subtitle=SUBTITLE[4])+
annotate("text", x=1.5, y=90, label=paste0("p=",round(test_results$pvalue[i],4)))+
geom_segment(aes(x=1, xend=2,y=105,yend=105))+
geom_segment(aes(x=1, xend=1,y=109,yend=100))+
geom_segment(aes(x=2, xend=2,y=109,yend=100))+
theme_classic()
pWarning: Removed 107 rows containing non-finite values (stat_ydensity).Warning: Removed 134 rows containing missing values (geom_point).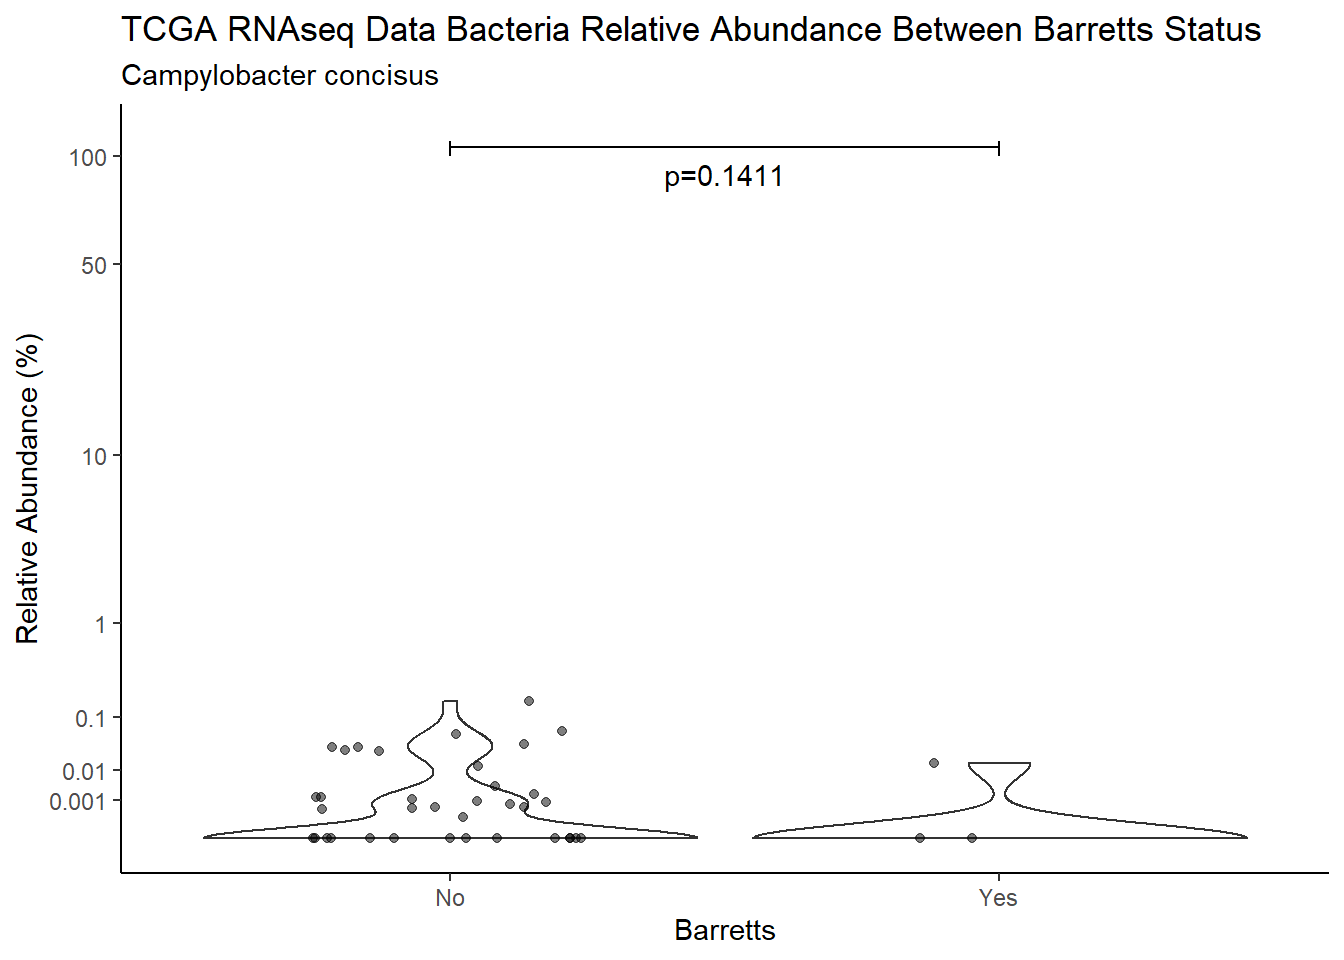
ggsave("output/supplemental_figure2C_tcga_rna_campy.pdf", p, units = "in", width = DIM[1], height = DIM[2])Warning: Removed 107 rows containing non-finite values (stat_ydensity).Warning: Removed 132 rows containing missing values (geom_point).ggsave("output/supplemental_figure2C_tcga_rna_campy.png", p, units = "in", width = DIM[1], height = DIM[2])Warning: Removed 107 rows containing non-finite values (stat_ydensity).Warning: Removed 125 rows containing missing values (geom_point).i <- i+1
d <- analysis.dat %>%
filter(!is.na(Barretts), source=="wgs", OTU == "Campylobacter concisus")
m1<-wilcox.test(Abund ~ Barretts, data=d, na.rm=TRUE, paired=FALSE, exact=FALSE, conf.int=TRUE)
m1
    Wilcoxon rank sum test with continuity correction

data:  Abund by Barretts
W = 426, p-value = 0.5648
alternative hypothesis: true location shift is not equal to 0
95 percent confidence interval:
 -1.673192e-05  3.794818e-03
sample estimates:
difference in location
          2.825405e-05
test_results[i,4] <- m1$estimate
test_results[i,5] <- m1$p.value
p <- analysis.dat %>%
filter(!is.na(Barretts), source=="wgs", OTU == "Campylobacter concisus")%>%
ggplot(aes(x=Barretts, y=Abund))+
geom_violin(scale="width", adjust=1)+
geom_jitter(alpha=0.5, width = 0.25)+
scale_y_continuous(
trans=scales::trans_new("root", root, invroot),
breaks=c(0, 0.001,0.01, 0.1, 1,10,50, 100),
labels = c(0, 0.001,0.01, 0.1, 1,10,50, 100),
limits = c(0, 110)
) +
labs(x="Barretts", y="Relative Abundance (%)",
title=paste0(TITLE_P1[3]," Bacteria Relative Abundance ",TITLE_P2[1]),
subtitle=SUBTITLE[4])+
annotate("text", x=1.5, y=90, label=paste0("p=",round(test_results$pvalue[i],4)))+
geom_segment(aes(x=1, xend=2,y=105,yend=105))+
geom_segment(aes(x=1, xend=1,y=109,yend=100))+
geom_segment(aes(x=2, xend=2,y=109,yend=100))+
theme_classic()
pWarning: Removed 16 rows containing non-finite values (stat_ydensity).Warning: Removed 52 rows containing missing values (geom_point).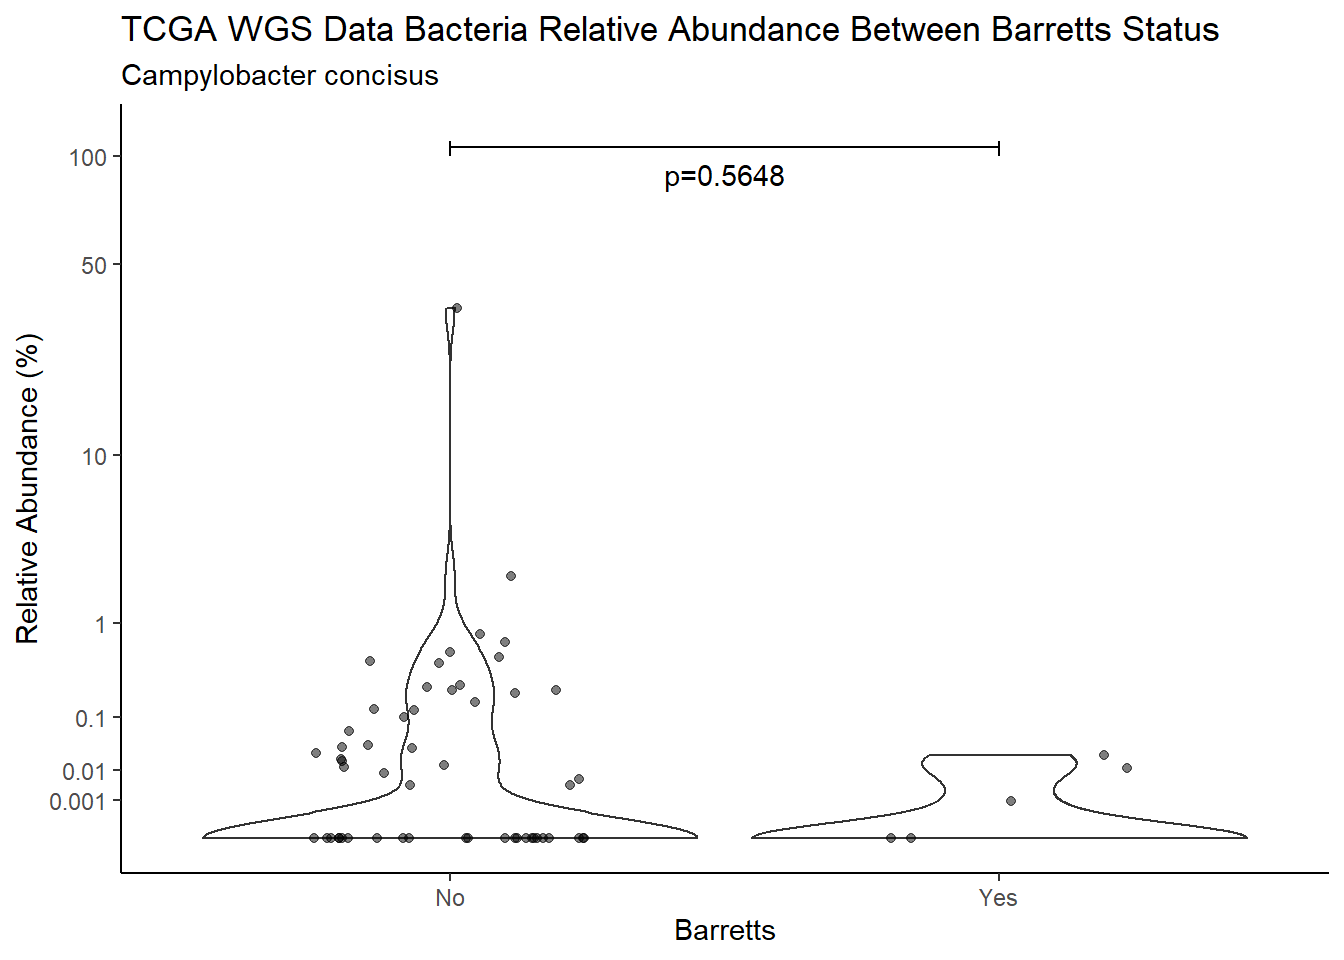
ggsave("output/supplemental_figure2C_tcga_wgs_campy.pdf", p, units = "in", width = DIM[1], height = DIM[2])Warning: Removed 16 rows containing non-finite values (stat_ydensity).Warning: Removed 42 rows containing missing values (geom_point).ggsave("output/supplemental_figure2C_tcga_wgs_campy.png", p, units = "in", width = DIM[1], height = DIM[2])Warning: Removed 16 rows containing non-finite values (stat_ydensity).Warning: Removed 49 rows containing missing values (geom_point).i <- i+1
d <- analysis.dat %>%
filter(!is.na(Barretts), source=="16s", OTU == "Streptococcus sanguinis")
m1<-wilcox.test(Abund ~ Barretts, data=d, na.rm=TRUE, paired=FALSE, exact=FALSE, conf.int=TRUE)
m1
    Wilcoxon rank sum test with continuity correction

data:  Abund by Barretts
W = 3433.5, p-value = 0.2285
alternative hypothesis: true location shift is not equal to 0
95 percent confidence interval:
 -2.000018 12.347244
sample estimates:
difference in location
              3.399997
test_results[i,4] <- m1$estimate
test_results[i,5] <- m1$p.value
p <- analysis.dat %>%
filter(!is.na(Barretts), source=="16s", OTU == "Streptococcus sanguinis")%>%
ggplot(aes(x=Barretts, y=Abund))+
geom_violin(scale="width", adjust=1)+
geom_jitter(alpha=0.5, width = 0.25)+
scale_y_continuous(
trans=scales::trans_new("root", root, invroot),
breaks=c(0, 0.001,0.01, 0.1, 1,10,50, 100),
labels = c(0, 0.001,0.01, 0.1, 1,10,50, 100),
limits = c(0, 110)
) +
labs(x="Barretts", y="Relative Abundance (%)",
title=paste0(TITLE_P1[1]," Bacteria Relative Abundance ",TITLE_P2[1]),
subtitle=SUBTITLE[5])+
annotate("text", x=1.5, y=90, label=paste0("p=",round(test_results$pvalue[i],4)))+
geom_segment(aes(x=1, xend=2,y=105,yend=105))+
geom_segment(aes(x=1, xend=1,y=109,yend=100))+
geom_segment(aes(x=2, xend=2,y=109,yend=100))+
theme_classic()
pWarning: Removed 3 rows containing missing values (geom_point).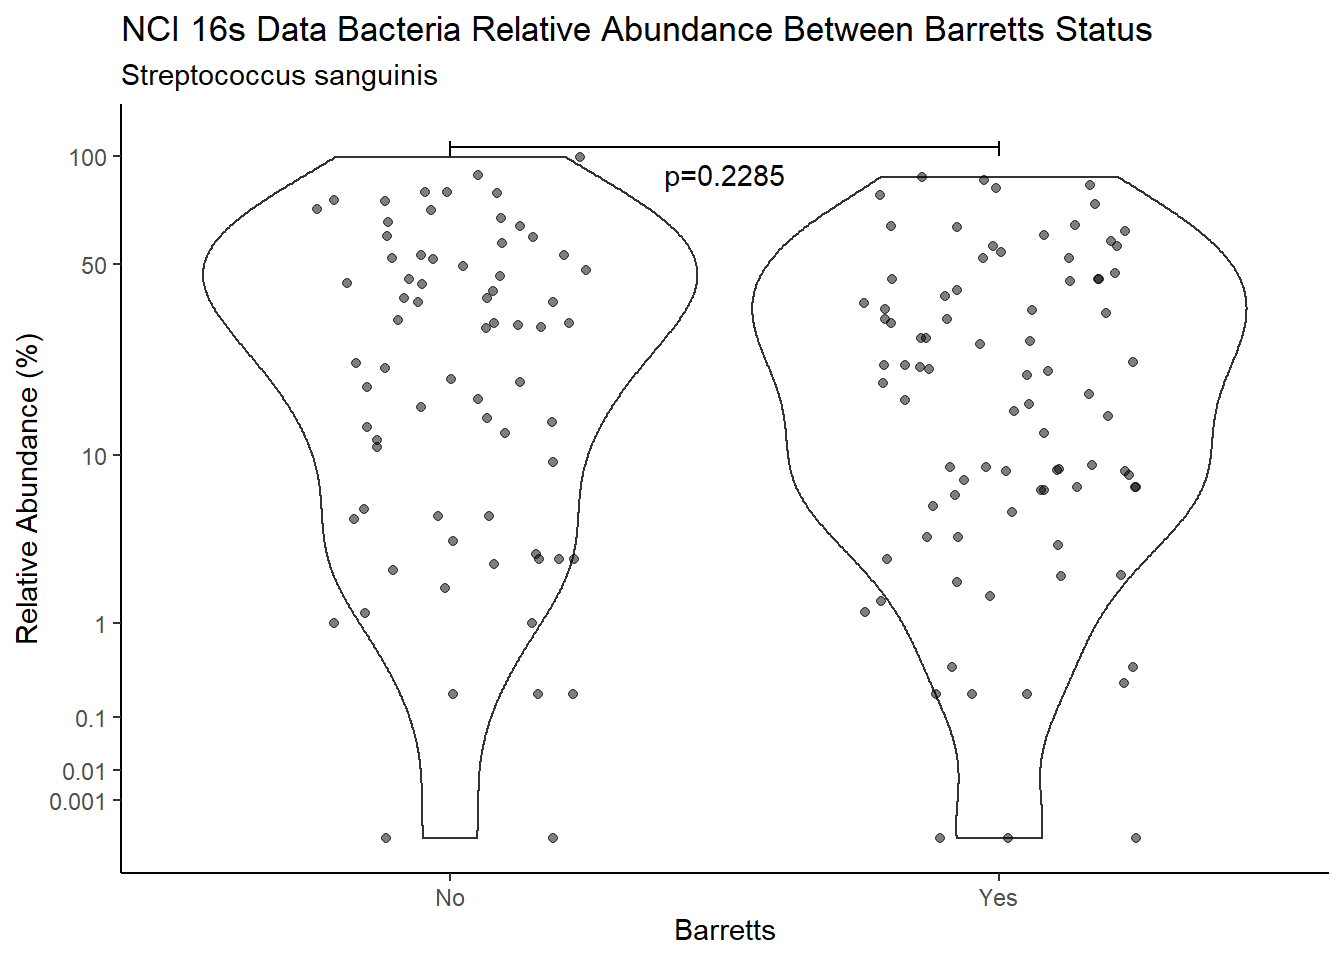
ggsave("output/supplemental_figure2C_NCI_strepto.pdf", p, units = "in", width = DIM[1], height = DIM[2])Warning: Removed 4 rows containing missing values (geom_point).ggsave("output/supplemental_figure2C_NCI_strepto.png", p, units = "in", width = DIM[1], height = DIM[2])Warning: Removed 6 rows containing missing values (geom_point).i <- i+1
d <- analysis.dat %>%
filter(!is.na(Barretts), source=="rna", OTU == "Streptococcus sanguinis")
m1<-wilcox.test(Abund ~ Barretts, data=d, na.rm=TRUE, paired=FALSE, exact=FALSE, conf.int=TRUE)
m1
    Wilcoxon rank sum test with continuity correction

data:  Abund by Barretts
W = 283, p-value = 0.6267
alternative hypothesis: true location shift is not equal to 0
95 percent confidence interval:
 -0.003153229  0.005443557
sample estimates:
difference in location
           0.001077408
test_results[i,4] <- m1$estimate
test_results[i,5] <- m1$p.value
p <- analysis.dat %>%
filter(!is.na(Barretts), source=="rna", OTU == "Streptococcus sanguinis")%>%
ggplot(aes(x=Barretts, y=Abund))+
geom_violin(scale="width", adjust=1)+
geom_jitter(alpha=0.5, width = 0.25)+
scale_y_continuous(
trans=scales::trans_new("root", root, invroot),
breaks=c(0, 0.001,0.01, 0.1, 1,10,50, 100),
labels = c(0, 0.001,0.01, 0.1, 1,10,50, 100),
limits = c(0, 110)
) +
labs(x="Barretts", y="Relative Abundance (%)",
title=paste0(TITLE_P1[2]," Bacteria Relative Abundance ",TITLE_P2[1]),
subtitle=SUBTITLE[5])+
annotate("text", x=1.5, y=90, label=paste0("p=",round(test_results$pvalue[i],4)))+
geom_segment(aes(x=1, xend=2,y=105,yend=105))+
geom_segment(aes(x=1, xend=1,y=109,yend=100))+
geom_segment(aes(x=2, xend=2,y=109,yend=100))+
theme_classic()
pWarning: Removed 107 rows containing non-finite values (stat_ydensity).Warning: Removed 111 rows containing missing values (geom_point).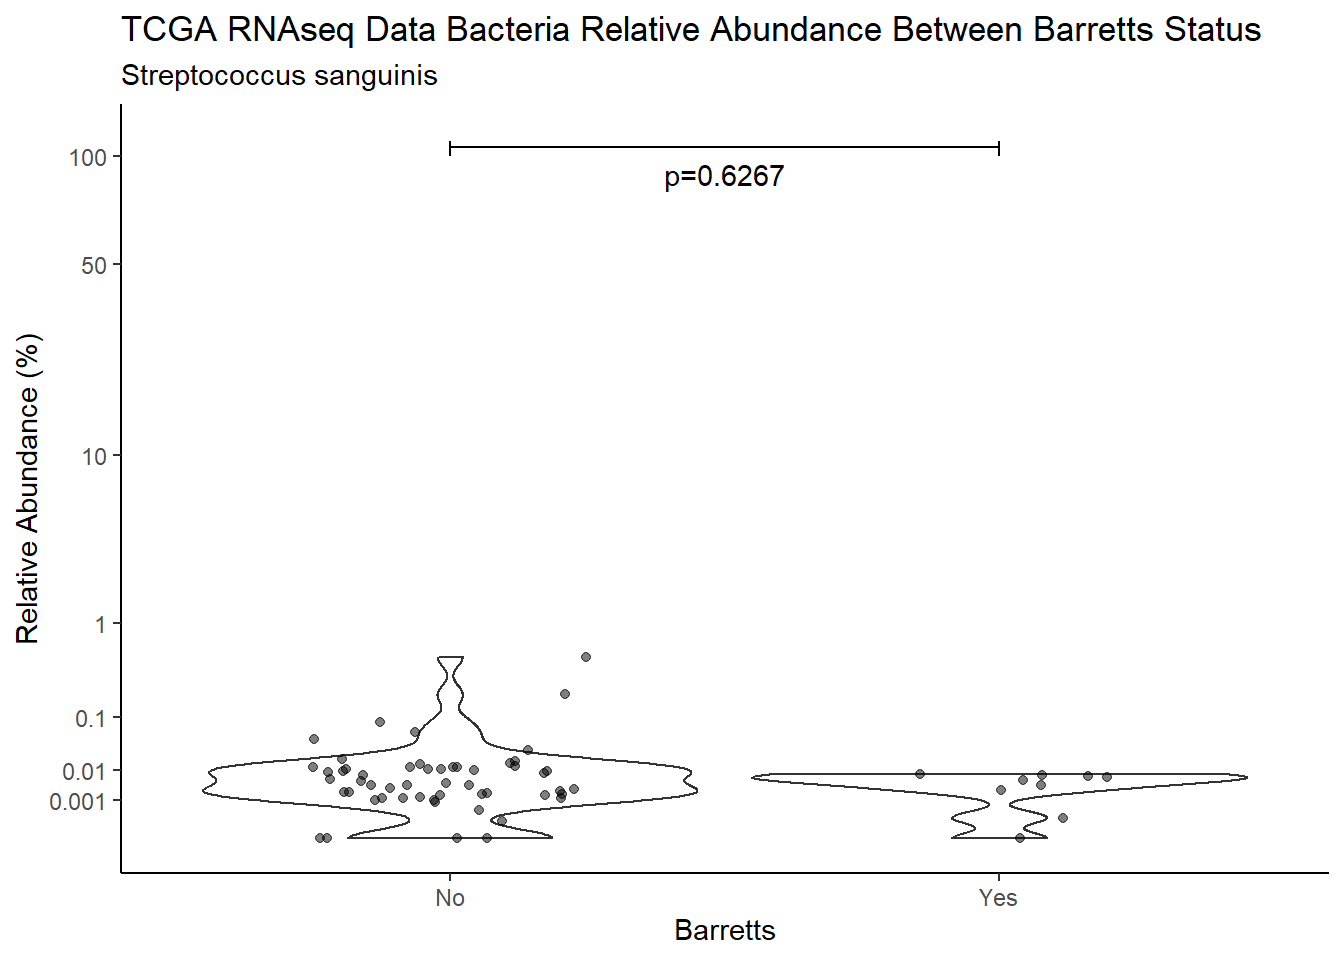
ggsave("output/supplemental_figure2C_tcga_rna_strepto.pdf", p, units = "in", width = DIM[1], height = DIM[2])Warning: Removed 107 rows containing non-finite values (stat_ydensity).Warning: Removed 110 rows containing missing values (geom_point).ggsave("output/supplemental_figure2C_tcga_rna_strepto.png", p, units = "in", width = DIM[1], height = DIM[2])Warning: Removed 107 rows containing non-finite values (stat_ydensity).Warning: Removed 111 rows containing missing values (geom_point).i <- i+1
d <- analysis.dat %>%
filter(!is.na(Barretts), source=="wgs", OTU == "Streptococcus sanguinis")
m1<-wilcox.test(Abund ~ Barretts, data=d, na.rm=TRUE, paired=FALSE, exact=FALSE, conf.int=TRUE)
m1
    Wilcoxon rank sum test with continuity correction

data:  Abund by Barretts
W = 378.5, p-value = 0.9064
alternative hypothesis: true location shift is not equal to 0
95 percent confidence interval:
 -8.037787e-04  6.937269e-06
sample estimates:
difference in location
         -1.328278e-05
test_results[i,4] <- m1$estimate
test_results[i,5] <- m1$p.value
p <- analysis.dat %>%
filter(!is.na(Barretts), source=="wgs", OTU == "Streptococcus sanguinis")%>%
ggplot(aes(x=Barretts, y=Abund))+
geom_violin(scale="width", adjust=1)+
geom_jitter(alpha=0.5, width = 0.25)+
scale_y_continuous(
trans=scales::trans_new("root", root, invroot),
breaks=c(0, 0.001,0.01, 0.1, 1,10,50, 100),
labels = c(0, 0.001,0.01, 0.1, 1,10,50, 100),
limits = c(0, 110)
) +
labs(x="Barretts", y="Relative Abundance (%)",
title=paste0(TITLE_P1[3]," Bacteria Relative Abundance ",TITLE_P2[1]),
subtitle=SUBTITLE[5])+
annotate("text", x=1.5, y=90, label=paste0("p=",round(test_results$pvalue[i],4)))+
geom_segment(aes(x=1, xend=2,y=105,yend=105))+
geom_segment(aes(x=1, xend=1,y=109,yend=100))+
geom_segment(aes(x=2, xend=2,y=109,yend=100))+
theme_classic()
pWarning: Removed 16 rows containing non-finite values (stat_ydensity).Warning: Removed 45 rows containing missing values (geom_point).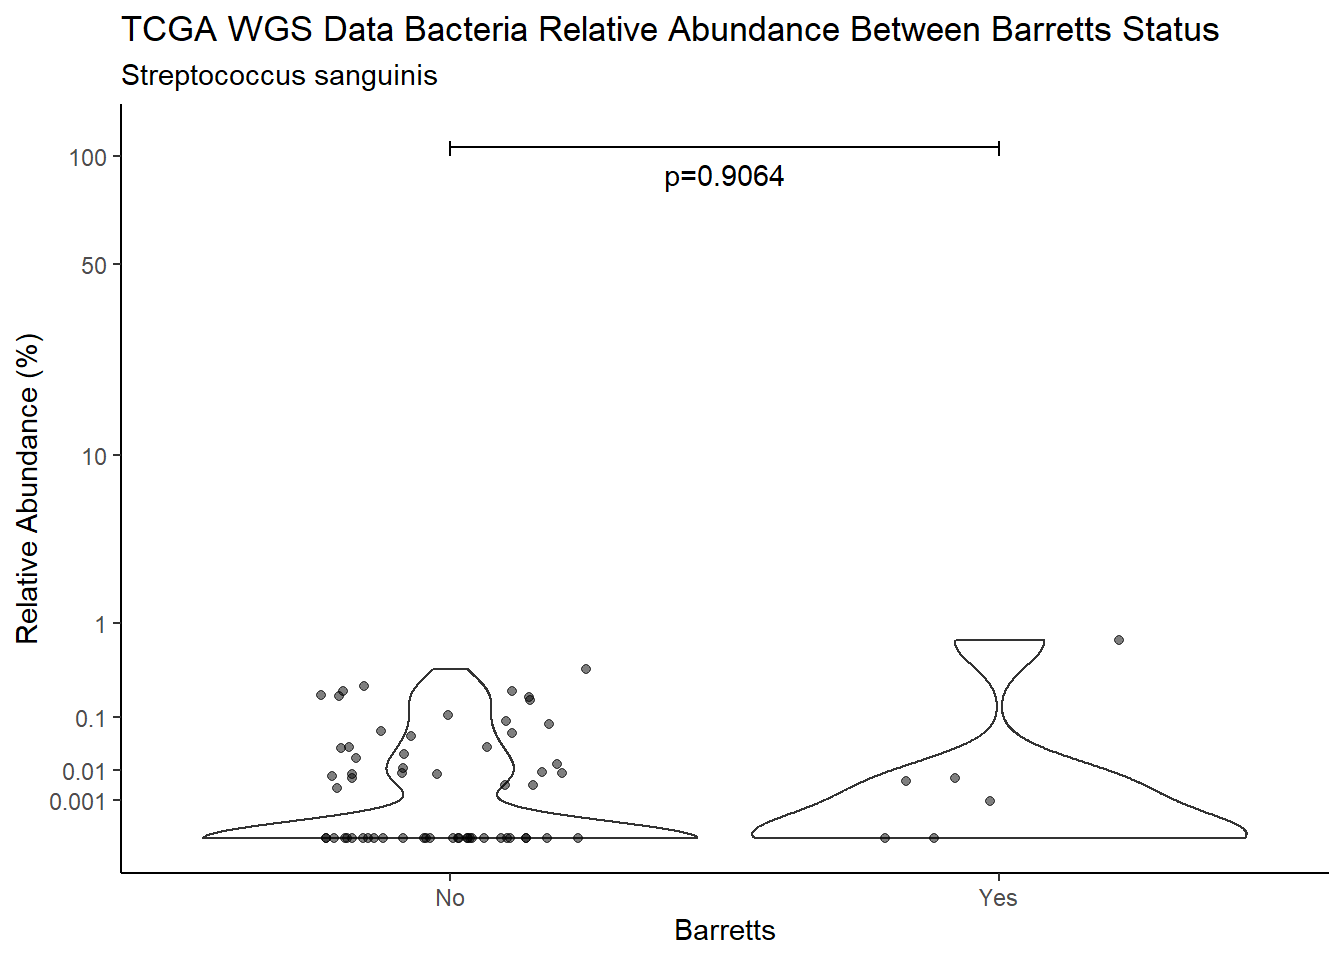
ggsave("output/supplemental_figure2C_tcga_wgs_strepto.pdf", p, units = "in", width = DIM[1], height = DIM[2])Warning: Removed 16 rows containing non-finite values (stat_ydensity).Warning: Removed 41 rows containing missing values (geom_point).ggsave("output/supplemental_figure2C_tcga_wgs_strepto.png", p, units = "in", width = DIM[1], height = DIM[2])Warning: Removed 16 rows containing non-finite values (stat_ydensity).Warning: Removed 45 rows containing missing values (geom_point).Sex
#root function
root<-function(x){
  x <- ifelse(x < 0, 0, x)
  x**(0.25)
}
#inverse root function
invroot<-function(x){
  x**(4)
}
DIM <- c(6, 4)

# merge datasets by subsetting to specific variables then merging
analysis.dat <- dat.16s.s %>%
  dplyr::mutate(ID = as.factor(accession.number),
                Gender = ifelse(gender=="M","Male","Female")) %>%
  dplyr::select(OTU, sample_type, tumor, Abundance, ID, source, Gender)

dat <- dat.rna.s %>%
  dplyr::mutate(Gender = ifelse(Gender=="male","Male","Female")) %>%
  dplyr::select(OTU, sample_type, tumor, Abundance, ID, source, Gender)
analysis.dat <- full_join(analysis.dat, dat)
Joining, by = c("OTU", "sample_type", "tumor", "Abundance", "ID", "source",
"Gender")dat <- dat.wgs.s %>%
dplyr::mutate(Gender = ifelse(Gender=="male","Male","Female")) %>%
dplyr::select(OTU, sample_type, tumor, Abundance, ID, source, Gender)
analysis.dat <- full_join(analysis.dat, dat) %>%
mutate(
pres = ifelse(Abundance > 0, 1, 0),
Abund = Abundance*100,
Tumor = ifelse(tumor==1, "Tumor", "No Tumor")
)Joining, by = c("OTU", "sample_type", "tumor", "Abundance", "ID", "source",
"Gender")i <- i+1
d <- analysis.dat %>%
filter(!is.na(Gender), source=="16s")
m1<-wilcox.test(Abund ~ Gender, data=d, na.rm=TRUE, paired=FALSE, exact=FALSE, conf.int=TRUE)
m1
    Wilcoxon rank sum test with continuity correction

data:  Abund by Gender
W = 31491, p-value = 0.6573
alternative hypothesis: true location shift is not equal to 0
95 percent confidence interval:
 -3.648190e-05  1.075892e-05
sample estimates:
difference in location
          4.919689e-05
test_results[i,4] <- m1$estimate
test_results[i,5] <- m1$p.value
p <- analysis.dat %>%
filter(!is.na(Gender), source=="16s")%>%
ggplot(aes(x=Gender, y=Abund))+
geom_violin(scale="width", adjust=1)+
geom_jitter(alpha=0.5, width = 0.25)+
scale_y_continuous(
trans=scales::trans_new("root", root, invroot),
breaks=c(0, 0.001,0.01, 0.1, 1,10,50, 100),
labels = c(0, 0.001,0.01, 0.1, 1,10,50, 100),
limits = c(0, 110)
) +
labs(x="Gender", y="Relative Abundance (%)",
title=paste0(TITLE_P1[1]," Bacteria Relative Abundance ",TITLE_P2[2]),
subtitle=SUBTITLE[1])+
annotate("text", x=1.5, y=90, label=paste0("p=",round(test_results$pvalue[i],4)))+
geom_segment(aes(x=1, xend=2,y=105,yend=105))+
geom_segment(aes(x=1, xend=1,y=109,yend=100))+
geom_segment(aes(x=2, xend=2,y=109,yend=100))+
theme_classic()
pWarning: Removed 122 rows containing missing values (geom_point).
ggsave("output/supplemental_figure2D_NCI_combined.pdf", p, units = "in", width = DIM[1], height = DIM[2])Warning: Removed 137 rows containing missing values (geom_point).ggsave("output/supplemental_figure2D_NCI_combined.png", p, units = "in", width = DIM[1], height = DIM[2])Warning: Removed 129 rows containing missing values (geom_point).i <- i+1
d <- analysis.dat %>%
filter(!is.na(Gender), source=="rna")
m1<-wilcox.test(Abund ~ Gender, data=d, na.rm=TRUE, paired=FALSE, exact=FALSE, conf.int=TRUE)
m1
    Wilcoxon rank sum test with continuity correction

data:  Abund by Gender
W = 16184, p-value = 0.1944
alternative hypothesis: true location shift is not equal to 0
95 percent confidence interval:
 -8.866505e-06  6.907441e-04
sample estimates:
difference in location
          4.812845e-05
test_results[i,4] <- m1$estimate
test_results[i,5] <- m1$p.value
p <- analysis.dat %>%
filter(source=="rna", !is.na(Gender))%>%
ggplot(aes(x=Gender, y=Abund))+
geom_violin(scale="width", adjust=1)+
geom_jitter(alpha=0.5, width = 0.25)+
scale_y_continuous(
trans=scales::trans_new("root", root, invroot),
breaks=c(0, 0.001,0.01, 0.1, 1,10,50, 100),
labels = c(0, 0.001,0.01, 0.1, 1,10,50, 100),
limits = c(0, 110)
) +
labs(x="Gender", y="Relative Abundance (%)",
title=paste0(TITLE_P1[2]," Bacteria Relative Abundance ",TITLE_P2[2]),
subtitle=SUBTITLE[1])+
annotate("text", x=1.5, y=90, label=paste0("p=",round(test_results$pvalue[i],4)))+
geom_segment(aes(x=1, xend=2,y=105,yend=105))+
geom_segment(aes(x=1, xend=1,y=109,yend=100))+
geom_segment(aes(x=2, xend=2,y=109,yend=100))+
theme_classic()
pWarning: Removed 749 rows containing non-finite values (stat_ydensity).Warning: Removed 817 rows containing missing values (geom_point).
ggsave("output/supplemental_figure2D_tcga_rna_combined.pdf", p, units = "in", width = DIM[1], height = DIM[2])Warning: Removed 749 rows containing non-finite values (stat_ydensity).Warning: Removed 840 rows containing missing values (geom_point).ggsave("output/supplemental_figure2D_tcga_rna_combined.png", p, units = "in", width = DIM[1], height = DIM[2])Warning: Removed 749 rows containing non-finite values (stat_ydensity).Warning: Removed 823 rows containing missing values (geom_point).i <- i+1
d <- analysis.dat %>%
filter(!is.na(Gender), source=="wgs")
m1<-wilcox.test(Abund ~ Gender, data=d, na.rm=TRUE, paired=FALSE, exact=FALSE, conf.int=TRUE)
m1
    Wilcoxon rank sum test with continuity correction

data:  Abund by Gender
W = 39218, p-value = 0.002236
alternative hypothesis: true location shift is not equal to 0
95 percent confidence interval:
 5.086163e-05 1.707932e-06
sample estimates:
difference in location
          2.790151e-05
test_results[i,4] <- m1$estimate
test_results[i,5] <- m1$p.value
p <- analysis.dat %>%
filter(source=="wgs", !is.na(Gender))%>%
ggplot(aes(x=Gender, y=Abund))+
geom_violin(scale="width", adjust=1)+
geom_jitter(alpha=0.5, width = 0.25)+
scale_y_continuous(
trans=scales::trans_new("root", root, invroot),
breaks=c(0, 0.001,0.01, 0.1, 1,10,50, 100),
labels = c(0, 0.001,0.01, 0.1, 1,10,50, 100),
limits = c(0, 110)
) +
labs(x="Gender", y="Relative Abundance (%)",
title=paste0(TITLE_P1[3]," Bacteria Relative Abundance ",TITLE_P2[2]),
subtitle=SUBTITLE[1])+
annotate("text", x=1.5, y=90, label=paste0("p=",round(test_results$pvalue[i],4)))+
geom_segment(aes(x=1, xend=2,y=105,yend=105))+
geom_segment(aes(x=1, xend=1,y=109,yend=100))+
geom_segment(aes(x=2, xend=2,y=109,yend=100))+
theme_classic()
pWarning: Removed 112 rows containing non-finite values (stat_ydensity).Warning: Removed 322 rows containing missing values (geom_point).
ggsave("output/supplemental_figure2D_tcga_wgs_combined.pdf", p, units = "in", width = DIM[1], height = DIM[2])Warning: Removed 112 rows containing non-finite values (stat_ydensity).Warning: Removed 305 rows containing missing values (geom_point).ggsave("output/supplemental_figure2D_tcga_wgs_combined.png", p, units = "in", width = DIM[1], height = DIM[2])Warning: Removed 112 rows containing non-finite values (stat_ydensity).Warning: Removed 314 rows containing missing values (geom_point).Subset by Bacterium
# merge datasets by subsetting to specific variables then merging
analysis.dat <- dat.16s.s %>%
  dplyr::mutate(ID = as.factor(accession.number),
                Gender = ifelse(gender=="M","Male","Female")) %>%
  dplyr::select(OTU, sample_type, tumor, Abundance, ID, source, Gender)

dat <- dat.rna.s %>%
  dplyr::mutate(Gender = ifelse(Gender=="male","Male","Female")) %>%
  dplyr::select(OTU, sample_type, tumor, Abundance, ID, source, Gender)
analysis.dat <- full_join(analysis.dat, dat)
Joining, by = c("OTU", "sample_type", "tumor", "Abundance", "ID", "source",
"Gender")dat <- dat.wgs.s %>%
dplyr::mutate(Gender = ifelse(Gender=="male","Male","Female")) %>%
dplyr::select(OTU, sample_type, tumor, Abundance, ID, source, Gender)
analysis.dat <- full_join(analysis.dat, dat) %>%
mutate(
pres = ifelse(Abundance > 0, 1, 0),
Abund = Abundance*100,
Tumor = ifelse(tumor==1, "Tumor", "No Tumor")
)Joining, by = c("OTU", "sample_type", "tumor", "Abundance", "ID", "source",
"Gender")i <- i+1
d <- analysis.dat %>%
filter(!is.na(Gender), source=="16s", OTU == "Fusobacterium nucleatum")
m1<-wilcox.test(Abund ~ Gender, data=d, na.rm=TRUE, paired=FALSE, exact=FALSE, conf.int=TRUE)
m1
    Wilcoxon rank sum test with continuity correction

data:  Abund by Gender
W = 1943, p-value = 0.9138
alternative hypothesis: true location shift is not equal to 0
95 percent confidence interval:
 -6.533984e-05  3.029709e-05
sample estimates:
difference in location
          3.441841e-06
test_results[i,4] <- m1$estimate
test_results[i,5] <- m1$p.value
p <- analysis.dat %>%
filter(!is.na(Gender), source=="16s", OTU == "Fusobacterium nucleatum")%>%
ggplot(aes(x=Gender, y=Abund))+
geom_violin(scale="width", adjust=1)+
geom_jitter(alpha=0.5, width = 0.25)+
scale_y_continuous(
trans=scales::trans_new("root", root, invroot),
breaks=c(0, 0.001,0.01, 0.1, 1,10,50, 100),
labels = c(0, 0.001,0.01, 0.1, 1,10,50, 100),
limits = c(0, 110)
) +
labs(x="Gender", y="Relative Abundance (%)",
title=paste0(TITLE_P1[1]," Bacteria Relative Abundance ",TITLE_P2[2]),
subtitle=SUBTITLE[2])+
annotate("text", x=1.5, y=90, label=paste0("p=",round(test_results$pvalue[i],4)))+
geom_segment(aes(x=1, xend=2,y=105,yend=105))+
geom_segment(aes(x=1, xend=1,y=109,yend=100))+
geom_segment(aes(x=2, xend=2,y=109,yend=100))+
theme_classic()
pWarning: Removed 39 rows containing missing values (geom_point).
ggsave("output/supplemental_figure2D_NCI_fuso.pdf", p, units = "in", width = DIM[1], height = DIM[2])Warning: Removed 39 rows containing missing values (geom_point).ggsave("output/supplemental_figure2D_NCI_fuso.png", p, units = "in", width = DIM[1], height = DIM[2])Warning: Removed 39 rows containing missing values (geom_point).i <- i+1
d <- analysis.dat %>%
filter(!is.na(Gender), source=="rna", OTU == "Fusobacterium nucleatum")
m1<-wilcox.test(Abund ~ Gender, data=d, na.rm=TRUE, paired=FALSE, exact=FALSE, conf.int=TRUE)
m1
    Wilcoxon rank sum test with continuity correction

data:  Abund by Gender
W = 377, p-value = 0.2027
alternative hypothesis: true location shift is not equal to 0
95 percent confidence interval:
 -0.003382977  0.014580208
sample estimates:
difference in location
           0.002984843
test_results[i,4] <- m1$estimate
test_results[i,5] <- m1$p.value
p <- analysis.dat %>%
filter(!is.na(Gender), source=="rna", OTU == "Fusobacterium nucleatum")%>%
ggplot(aes(x=Gender, y=Abund))+
geom_violin(scale="width", adjust=1)+
geom_jitter(alpha=0.5, width = 0.25)+
scale_y_continuous(
trans=scales::trans_new("root", root, invroot),
breaks=c(0, 0.001,0.01, 0.1, 1,10,50, 100),
labels = c(0, 0.001,0.01, 0.1, 1,10,50, 100),
limits = c(0, 110)
) +
labs(x="Gender", y="Relative Abundance (%)",
title=paste0(TITLE_P1[2]," Bacteria Relative Abundance ",TITLE_P2[2]),
subtitle=SUBTITLE[2])+
annotate("text", x=1.5, y=90, label=paste0("p=",round(test_results$pvalue[i],4)))+
geom_segment(aes(x=1, xend=2,y=105,yend=105))+
geom_segment(aes(x=1, xend=1,y=109,yend=100))+
geom_segment(aes(x=2, xend=2,y=109,yend=100))+
theme_classic()
pWarning: Removed 107 rows containing non-finite values (stat_ydensity).Warning: Removed 112 rows containing missing values (geom_point).
ggsave("output/supplemental_figure2D_tcga_rna_fuso.pdf", p, units = "in", width = DIM[1], height = DIM[2])Warning: Removed 107 rows containing non-finite values (stat_ydensity).Warning: Removed 111 rows containing missing values (geom_point).ggsave("output/supplemental_figure2D_tcga_rna_fuso.png", p, units = "in", width = DIM[1], height = DIM[2])Warning: Removed 107 rows containing non-finite values (stat_ydensity).Warning: Removed 110 rows containing missing values (geom_point).i <- i+1
d <- analysis.dat %>%
filter(!is.na(Gender), source=="wgs", OTU == "Fusobacterium nucleatum")
m1<-wilcox.test(Abund ~ Gender, data=d, na.rm=TRUE, paired=FALSE, exact=FALSE, conf.int=TRUE)
m1
    Wilcoxon rank sum test with continuity correction

data:  Abund by Gender
W = 927, p-value = 0.01802
alternative hypothesis: true location shift is not equal to 0
95 percent confidence interval:
 2.963471e-05 4.854826e-01
sample estimates:
difference in location
             0.1363069
test_results[i,4] <- m1$estimate
test_results[i,5] <- m1$p.value
p <- analysis.dat %>%
filter(!is.na(Gender), source=="wgs", OTU == "Fusobacterium nucleatum")%>%
ggplot(aes(x=Gender, y=Abund))+
geom_violin(scale="width", adjust=1)+
geom_jitter(alpha=0.5, width = 0.25)+
scale_y_continuous(
trans=scales::trans_new("root", root, invroot),
breaks=c(0, 0.001,0.01, 0.1, 1,10,50, 100),
labels = c(0, 0.001,0.01, 0.1, 1,10,50, 100),
limits = c(0, 110)
) +
labs(x="Gender", y="Relative Abundance (%)",
title=paste0(TITLE_P1[3]," Bacteria Relative Abundance ",TITLE_P2[2]),
subtitle=SUBTITLE[2])+
annotate("text", x=1.5, y=90, label=paste0("p=",round(test_results$pvalue[i],4)))+
geom_segment(aes(x=1, xend=2,y=105,yend=105))+
geom_segment(aes(x=1, xend=1,y=109,yend=100))+
geom_segment(aes(x=2, xend=2,y=109,yend=100))+
theme_classic()
pWarning: Removed 16 rows containing non-finite values (stat_ydensity).Warning: Removed 42 rows containing missing values (geom_point).
ggsave("output/supplemental_figure2D_tcga_wgs_fuso.pdf", p, units = "in", width = DIM[1], height = DIM[2])Warning: Removed 16 rows containing non-finite values (stat_ydensity).Warning: Removed 34 rows containing missing values (geom_point).ggsave("output/supplemental_figure2D_tcga_wgs_fuso.png", p, units = "in", width = DIM[1], height = DIM[2])Warning: Removed 16 rows containing non-finite values (stat_ydensity).Warning: Removed 41 rows containing missing values (geom_point).i <- i+1
d <- analysis.dat %>%
filter(!is.na(Gender), source=="16s", OTU == "Prevotella melaninogenica" | OTU =="Prevotella spp.")
m1<-wilcox.test(Abund ~ Gender, data=d, na.rm=TRUE, paired=FALSE, exact=FALSE, conf.int=TRUE)
m1
    Wilcoxon rank sum test with continuity correction

data:  Abund by Gender
W = 2251.5, p-value = 0.1379
alternative hypothesis: true location shift is not equal to 0
95 percent confidence interval:
 -2.685771e-05  2.199962e+00
sample estimates:
difference in location
              0.599959
test_results[i,4] <- m1$estimate
test_results[i,5] <- m1$p.value
p <- analysis.dat %>%
filter(!is.na(Gender), source=="16s", OTU == "Prevotella melaninogenica" | OTU =="Prevotella spp.")%>%
ggplot(aes(x=Gender, y=Abund))+
geom_violin(scale="width", adjust=1)+
geom_jitter(alpha=0.5, width = 0.25)+
scale_y_continuous(
trans=scales::trans_new("root", root, invroot),
breaks=c(0, 0.001,0.01, 0.1, 1,10,50, 100),
labels = c(0, 0.001,0.01, 0.1, 1,10,50, 100),
limits = c(0, 110)
) +
labs(x="Gender", y="Relative Abundance (%)",
title=paste0(TITLE_P1[1]," Bacteria Relative Abundance ",TITLE_P2[2]),
subtitle=SUBTITLE[3])+
annotate("text", x=1.5, y=90, label=paste0("p=",round(test_results$pvalue[i],4)))+
geom_segment(aes(x=1, xend=2,y=105,yend=105))+
geom_segment(aes(x=1, xend=1,y=109,yend=100))+
geom_segment(aes(x=2, xend=2,y=109,yend=100))+
theme_classic()
pWarning: Removed 26 rows containing missing values (geom_point).
ggsave("output/supplemental_figure2D_NCI_prevo.pdf", p, units = "in", width = DIM[1], height = DIM[2])Warning: Removed 22 rows containing missing values (geom_point).ggsave("output/supplemental_figure2D_NCI_prevo.png", p, units = "in", width = DIM[1], height = DIM[2])Warning: Removed 19 rows containing missing values (geom_point).i <- i+1
d <- analysis.dat %>%
filter(!is.na(Gender), source=="rna", OTU == "Prevotella melaninogenica")
m1<-wilcox.test(Abund ~ Gender, data=d, na.rm=TRUE, paired=FALSE, exact=FALSE, conf.int=TRUE)
m1
    Wilcoxon rank sum test with continuity correction

data:  Abund by Gender
W = 297, p-value = 0.9314
alternative hypothesis: true location shift is not equal to 0
95 percent confidence interval:
 -0.01169006  0.01106448
sample estimates:
difference in location
         -7.961707e-05
test_results[i,4] <- m1$estimate
test_results[i,5] <- m1$p.value
p <- analysis.dat %>%
filter(!is.na(Gender), source=="rna", OTU == "Prevotella melaninogenica")%>%
ggplot(aes(x=Gender, y=Abund))+
geom_violin(scale="width", adjust=1)+
geom_jitter(alpha=0.5, width = 0.25)+
scale_y_continuous(
trans=scales::trans_new("root", root, invroot),
breaks=c(0, 0.001,0.01, 0.1, 1,10,50, 100),
labels = c(0, 0.001,0.01, 0.1, 1,10,50, 100),
limits = c(0, 110)
) +
labs(x="Gender", y="Relative Abundance (%)",
title=paste0(TITLE_P1[2]," Bacteria Relative Abundance ",TITLE_P2[2]),
subtitle=SUBTITLE[3])+
annotate("text", x=1.5, y=90, label=paste0("p=",round(test_results$pvalue[i],4)))+
geom_segment(aes(x=1, xend=2,y=105,yend=105))+
geom_segment(aes(x=1, xend=1,y=109,yend=100))+
geom_segment(aes(x=2, xend=2,y=109,yend=100))+
theme_classic()
pWarning: Removed 107 rows containing non-finite values (stat_ydensity).Warning: Removed 111 rows containing missing values (geom_point).
ggsave("output/supplemental_figure2D_tcga_rna_prevo.pdf", p, units = "in", width = DIM[1], height = DIM[2])Warning: Removed 107 rows containing non-finite values (stat_ydensity).Warning: Removed 110 rows containing missing values (geom_point).ggsave("output/supplemental_figure2D_tcga_rna_prevo.png", p, units = "in", width = DIM[1], height = DIM[2])Warning: Removed 107 rows containing non-finite values (stat_ydensity).
Removed 110 rows containing missing values (geom_point).i <- i+1
d <- analysis.dat %>%
filter(!is.na(Gender), source=="wgs", OTU == "Prevotella melaninogenica")
m1<-wilcox.test(Abund ~ Gender, data=d, na.rm=TRUE, paired=FALSE, exact=FALSE, conf.int=TRUE)
m1
    Wilcoxon rank sum test with continuity correction

data:  Abund by Gender
W = 848, p-value = 0.1339
alternative hypothesis: true location shift is not equal to 0
95 percent confidence interval:
 -1.513898e-05  5.145027e+00
sample estimates:
difference in location
             0.3345322
test_results[i,4] <- m1$estimate
test_results[i,5] <- m1$p.value
p <- analysis.dat %>%
filter(!is.na(Gender), source=="wgs", OTU == "Prevotella melaninogenica")%>%
ggplot(aes(x=Gender, y=Abund))+
geom_violin(scale="width", adjust=1)+
geom_jitter(alpha=0.5, width = 0.25)+
scale_y_continuous(
trans=scales::trans_new("root", root, invroot),
breaks=c(0, 0.001,0.01, 0.1, 1,10,50, 100),
labels = c(0, 0.001,0.01, 0.1, 1,10,50, 100),
limits = c(0, 110)
) +
labs(x="Gender", y="Relative Abundance (%)",
title=paste0(TITLE_P1[3]," Bacteria Relative Abundance ",TITLE_P2[2]),
subtitle=SUBTITLE[3])+
annotate("text", x=1.5, y=90, label=paste0("p=",round(test_results$pvalue[i],4)))+
geom_segment(aes(x=1, xend=2,y=105,yend=105))+
geom_segment(aes(x=1, xend=1,y=109,yend=100))+
geom_segment(aes(x=2, xend=2,y=109,yend=100))+
theme_classic()
pWarning: Removed 16 rows containing non-finite values (stat_ydensity).Warning: Removed 29 rows containing missing values (geom_point).
ggsave("output/supplemental_figure2D_tcga_wgs_prevo.pdf", p, units = "in", width = DIM[1], height = DIM[2])Warning: Removed 16 rows containing non-finite values (stat_ydensity).Warning: Removed 32 rows containing missing values (geom_point).ggsave("output/supplemental_figure2D_tcga_wgs_prevo.png", p, units = "in", width = DIM[1], height = DIM[2])Warning: Removed 16 rows containing non-finite values (stat_ydensity).Warning: Removed 36 rows containing missing values (geom_point).i <- i+1
d <- analysis.dat %>%
filter(!is.na(Gender), source=="16s", OTU == "Campylobacter concisus")
m1<-wilcox.test(Abund ~ Gender, data=d, na.rm=TRUE, paired=FALSE, exact=FALSE, conf.int=TRUE)
m1
    Wilcoxon rank sum test with continuity correction

data:  Abund by Gender
W = 1896, p-value = 0.8834
alternative hypothesis: true location shift is not equal to 0
95 percent confidence interval:
 -4.967137e-05  2.342579e-05
sample estimates:
difference in location
         -6.464722e-05
test_results[i,4] <- m1$estimate
test_results[i,5] <- m1$p.value
p <- analysis.dat %>%
filter(!is.na(Gender), source=="16s", OTU == "Campylobacter concisus")%>%
ggplot(aes(x=Gender, y=Abund))+
geom_violin(scale="width", adjust=1)+
geom_jitter(alpha=0.5, width = 0.25)+
scale_y_continuous(
trans=scales::trans_new("root", root, invroot),
breaks=c(0, 0.001,0.01, 0.1, 1,10,50, 100),
labels = c(0, 0.001,0.01, 0.1, 1,10,50, 100),
limits = c(0, 110)
) +
labs(x="Gender", y="Relative Abundance (%)",
title=paste0(TITLE_P1[1]," Bacteria Relative Abundance ",TITLE_P2[2]),
subtitle=SUBTITLE[4])+
annotate("text", x=1.5, y=90, label=paste0("p=",round(test_results$pvalue[i],4)))+
geom_segment(aes(x=1, xend=2,y=105,yend=105))+
geom_segment(aes(x=1, xend=1,y=109,yend=100))+
geom_segment(aes(x=2, xend=2,y=109,yend=100))+
theme_classic()
pWarning: Removed 62 rows containing missing values (geom_point).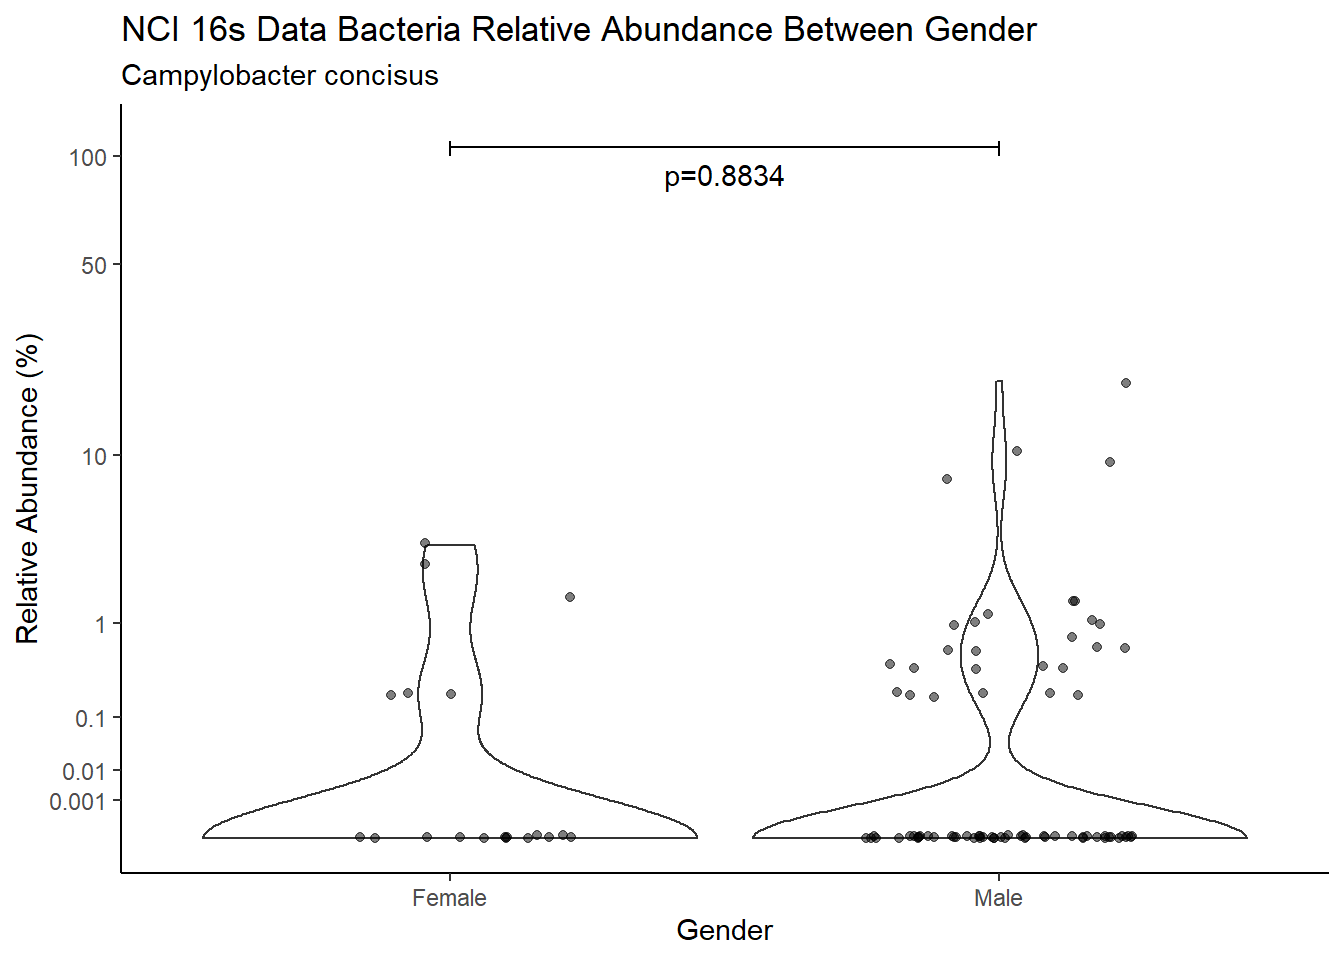
ggsave("output/supplemental_figure2D_NCI_campy.pdf", p, units = "in", width = DIM[1], height = DIM[2])Warning: Removed 63 rows containing missing values (geom_point).ggsave("output/supplemental_figure2D_NCI_campy.png", p, units = "in", width = DIM[1], height = DIM[2])Warning: Removed 65 rows containing missing values (geom_point).i <- i+1
d <- analysis.dat %>%
filter(!is.na(Gender), source=="rna", OTU == "Campylobacter concisus")
m1<-wilcox.test(Abund ~ Gender, data=d, na.rm=TRUE, paired=FALSE, exact=FALSE, conf.int=TRUE)
m1
    Wilcoxon rank sum test with continuity correction

data:  Abund by Gender
W = 314, p-value = 0.8239
alternative hypothesis: true location shift is not equal to 0
95 percent confidence interval:
 -3.552421e-05  4.297188e-05
sample estimates:
difference in location
          3.558703e-05
test_results[i,4] <- m1$estimate
test_results[i,5] <- m1$p.value
p <- analysis.dat %>%
filter(!is.na(Gender), source=="rna", OTU == "Campylobacter concisus")%>%
ggplot(aes(x=Gender, y=Abund))+
geom_violin(scale="width", adjust=1)+
geom_jitter(alpha=0.5, width = 0.25)+
scale_y_continuous(
trans=scales::trans_new("root", root, invroot),
breaks=c(0, 0.001,0.01, 0.1, 1,10,50, 100),
labels = c(0, 0.001,0.01, 0.1, 1,10,50, 100),
limits = c(0, 110)
) +
labs(x="Gender", y="Relative Abundance (%)",
title=paste0(TITLE_P1[2]," Bacteria Relative Abundance ",TITLE_P2[2]),
subtitle=SUBTITLE[4])+
annotate("text", x=1.5, y=90, label=paste0("p=",round(test_results$pvalue[i],4)))+
geom_segment(aes(x=1, xend=2,y=105,yend=105))+
geom_segment(aes(x=1, xend=1,y=109,yend=100))+
geom_segment(aes(x=2, xend=2,y=109,yend=100))+
theme_classic()
pWarning: Removed 107 rows containing non-finite values (stat_ydensity).Warning: Removed 123 rows containing missing values (geom_point).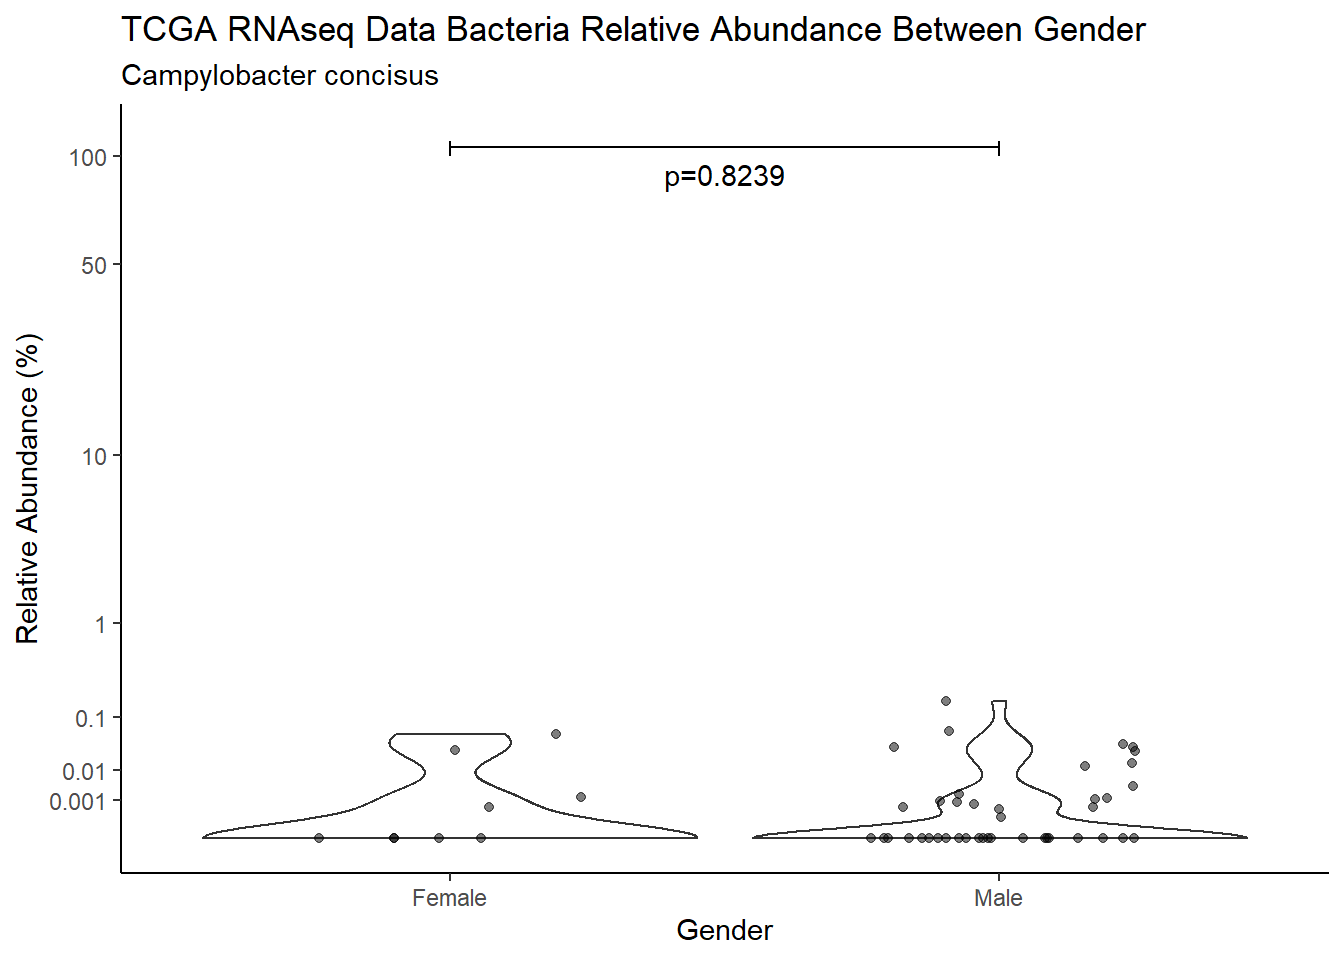
ggsave("output/supplemental_figure2D_tcga_rna_campy.pdf", p, units = "in", width = DIM[1], height = DIM[2])Warning: Removed 107 rows containing non-finite values (stat_ydensity).Warning: Removed 134 rows containing missing values (geom_point).ggsave("output/supplemental_figure2D_tcga_rna_campy.png", p, units = "in", width = DIM[1], height = DIM[2])Warning: Removed 107 rows containing non-finite values (stat_ydensity).Warning: Removed 129 rows containing missing values (geom_point).i <- i+1
d <- analysis.dat %>%
filter(!is.na(Gender), source=="wgs", OTU == "Campylobacter concisus")
m1<-wilcox.test(Abund ~ Gender, data=d, na.rm=TRUE, paired=FALSE, exact=FALSE, conf.int=TRUE)
m1
    Wilcoxon rank sum test with continuity correction

data:  Abund by Gender
W = 938.5, p-value = 0.006179
alternative hypothesis: true location shift is not equal to 0
95 percent confidence interval:
 7.95184e-05 3.09854e-02
sample estimates:
difference in location
          0.0009054198
test_results[i,4] <- m1$estimate
test_results[i,5] <- m1$p.value
p <- analysis.dat %>%
filter(!is.na(Gender), source=="wgs", OTU == "Campylobacter concisus")%>%
ggplot(aes(x=Gender, y=Abund))+
geom_violin(scale="width", adjust=1)+
geom_jitter(alpha=0.5, width = 0.25)+
scale_y_continuous(
trans=scales::trans_new("root", root, invroot),
breaks=c(0, 0.001,0.01, 0.1, 1,10,50, 100),
labels = c(0, 0.001,0.01, 0.1, 1,10,50, 100),
limits = c(0, 110)
) +
labs(x="Gender", y="Relative Abundance (%)",
title=paste0(TITLE_P1[3]," Bacteria Relative Abundance ",TITLE_P2[2]),
subtitle=SUBTITLE[4])+
annotate("text", x=1.5, y=90, label=paste0("p=",round(test_results$pvalue[i],4)))+
geom_segment(aes(x=1, xend=2,y=105,yend=105))+
geom_segment(aes(x=1, xend=1,y=109,yend=100))+
geom_segment(aes(x=2, xend=2,y=109,yend=100))+
theme_classic()
pWarning: Removed 16 rows containing non-finite values (stat_ydensity).Warning: Removed 41 rows containing missing values (geom_point).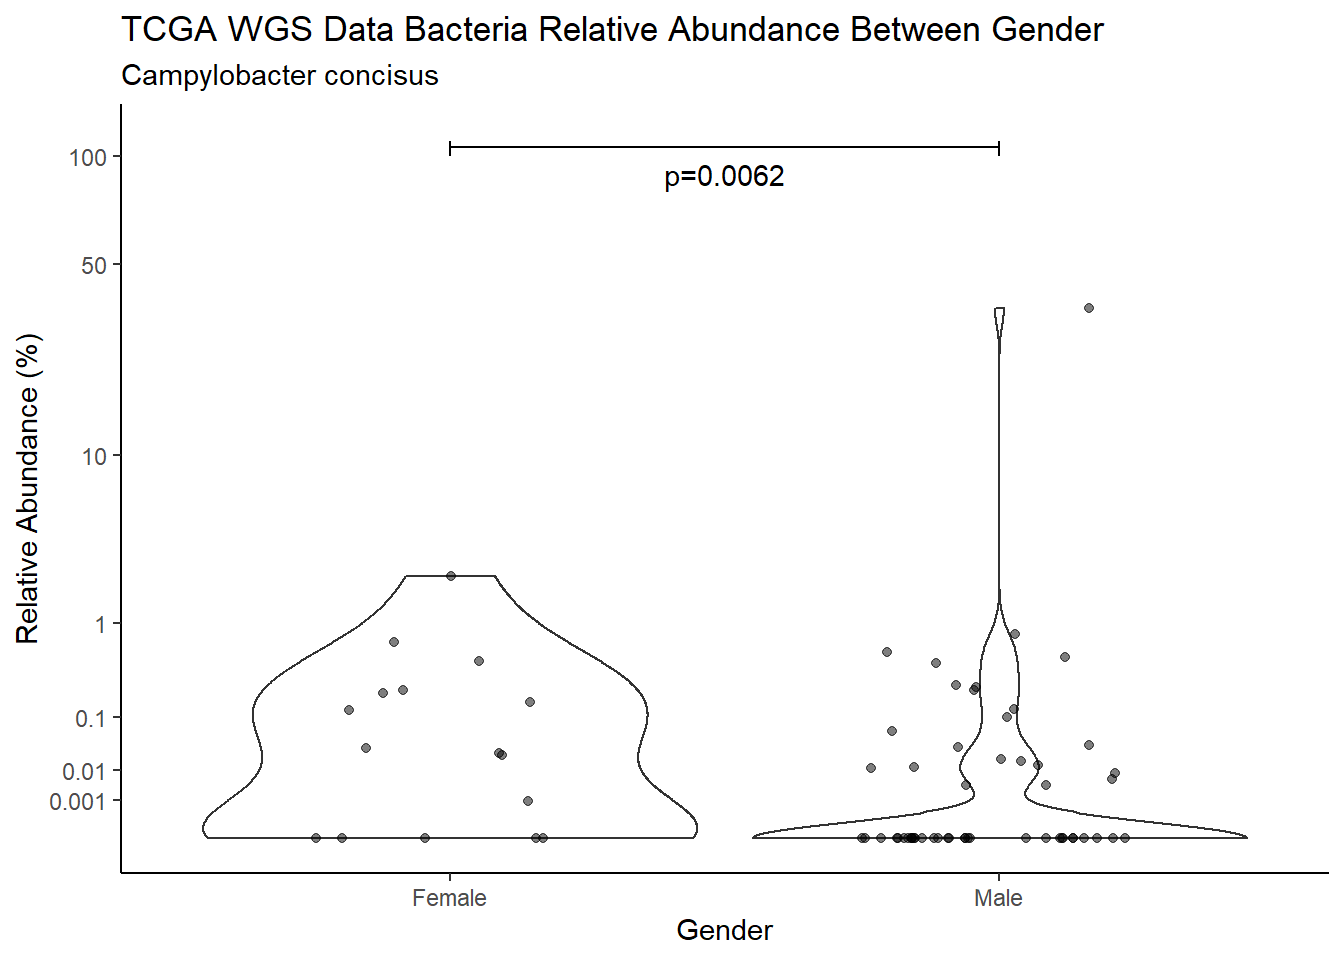
ggsave("output/supplemental_figure2D_tcga_wgs_campy.pdf", p, units = "in", width = DIM[1], height = DIM[2])Warning: Removed 16 rows containing non-finite values (stat_ydensity).Warning: Removed 48 rows containing missing values (geom_point).ggsave("output/supplemental_figure2D_tcga_wgs_campy.png", p, units = "in", width = DIM[1], height = DIM[2])Warning: Removed 16 rows containing non-finite values (stat_ydensity).
Removed 48 rows containing missing values (geom_point).i <- i+1
d <- analysis.dat %>%
filter(!is.na(Gender), source=="16s", OTU == "Streptococcus sanguinis")
m1<-wilcox.test(Abund ~ Gender, data=d, na.rm=TRUE, paired=FALSE, exact=FALSE, conf.int=TRUE)
m1
    Wilcoxon rank sum test with continuity correction

data:  Abund by Gender
W = 1859.5, p-value = 0.7902
alternative hypothesis: true location shift is not equal to 0
95 percent confidence interval:
 -8.980748  6.799926
sample estimates:
difference in location
            -0.7999949
test_results[i,4] <- m1$estimate
test_results[i,5] <- m1$p.value
p <- analysis.dat %>%
filter(!is.na(Gender), source=="16s", OTU == "Streptococcus sanguinis")%>%
ggplot(aes(x=Gender, y=Abund))+
geom_violin(scale="width", adjust=1)+
geom_jitter(alpha=0.5, width = 0.25)+
scale_y_continuous(
trans=scales::trans_new("root", root, invroot),
breaks=c(0, 0.001,0.01, 0.1, 1,10,50, 100),
labels = c(0, 0.001,0.01, 0.1, 1,10,50, 100),
limits = c(0, 110)
) +
labs(x="Gender", y="Relative Abundance (%)",
title=paste0(TITLE_P1[1]," Bacteria Relative Abundance ",TITLE_P2[2]),
subtitle=SUBTITLE[5])+
annotate("text", x=1.5, y=90, label=paste0("p=",round(test_results$pvalue[i],4)))+
geom_segment(aes(x=1, xend=2,y=105,yend=105))+
geom_segment(aes(x=1, xend=1,y=109,yend=100))+
geom_segment(aes(x=2, xend=2,y=109,yend=100))+
theme_classic()
pWarning: Removed 5 rows containing missing values (geom_point).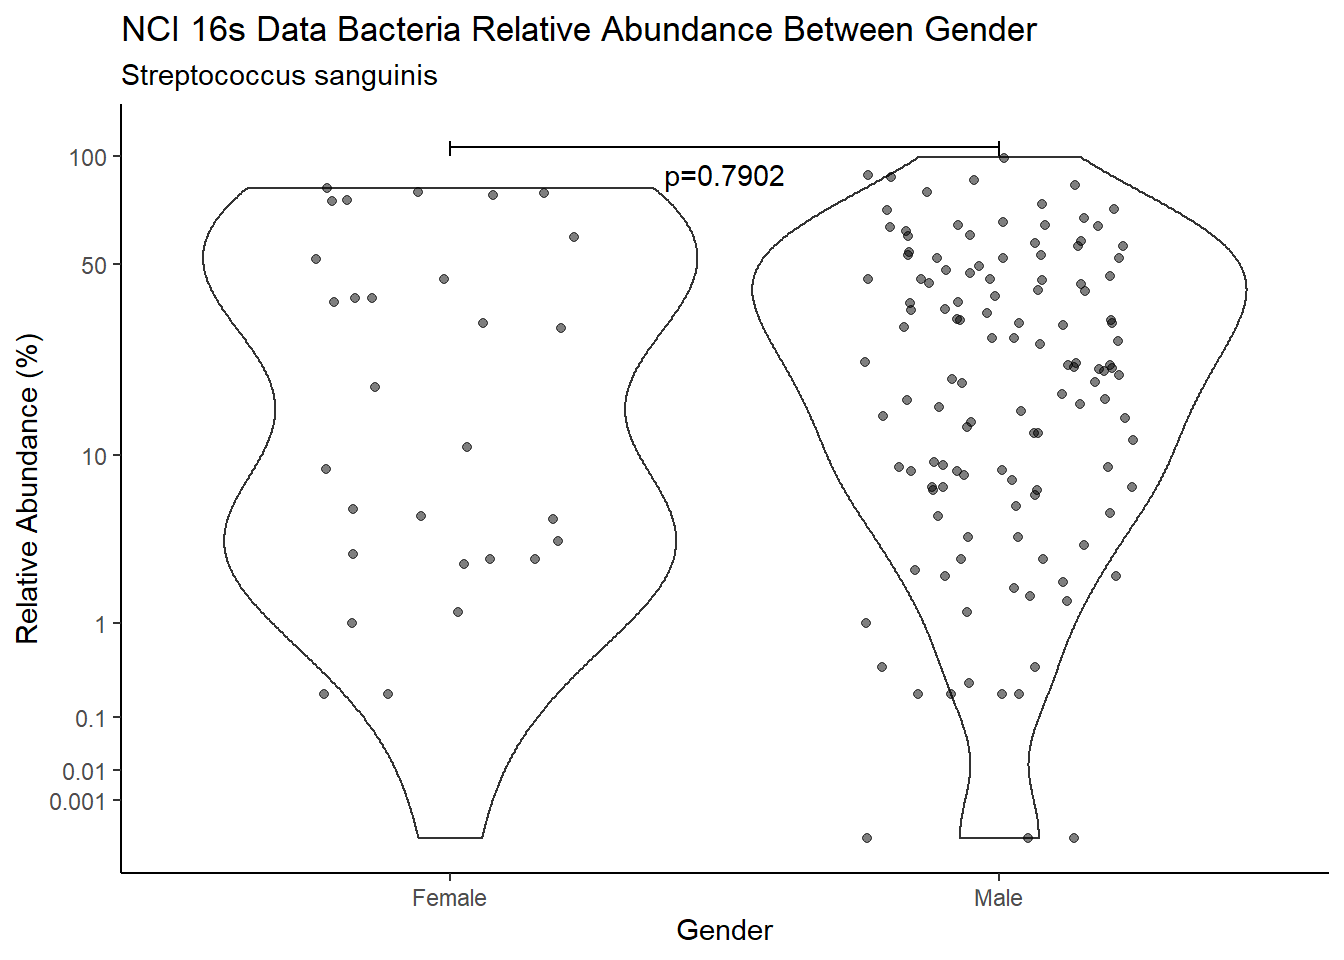
ggsave("output/supplemental_figure2D_NCI_strepto.pdf", p, units = "in", width = DIM[1], height = DIM[2])Warning: Removed 5 rows containing missing values (geom_point).ggsave("output/supplemental_figure2D_NCI_strepto.png", p, units = "in", width = DIM[1], height = DIM[2])Warning: Removed 2 rows containing missing values (geom_point).i <- i+1
d <- analysis.dat %>%
filter(!is.na(Gender), source=="rna", OTU == "Streptococcus sanguinis")
m1<-wilcox.test(Abund ~ Gender, data=d, na.rm=TRUE, paired=FALSE, exact=FALSE, conf.int=TRUE)
m1
    Wilcoxon rank sum test with continuity correction

data:  Abund by Gender
W = 314, p-value = 0.8497
alternative hypothesis: true location shift is not equal to 0
95 percent confidence interval:
 -0.003569662  0.003880488
sample estimates:
difference in location
          0.0002583106
test_results[i,4] <- m1$estimate
test_results[i,5] <- m1$p.value
p <- analysis.dat %>%
filter(!is.na(Gender), source=="rna", OTU == "Streptococcus sanguinis")%>%
ggplot(aes(x=Gender, y=Abund))+
geom_violin(scale="width", adjust=1)+
geom_jitter(alpha=0.5, width = 0.25)+
scale_y_continuous(
trans=scales::trans_new("root", root, invroot),
breaks=c(0, 0.001,0.01, 0.1, 1,10,50, 100),
labels = c(0, 0.001,0.01, 0.1, 1,10,50, 100),
limits = c(0, 110)
) +
labs(x="Gender", y="Relative Abundance (%)",
title=paste0(TITLE_P1[2]," Bacteria Relative Abundance ",TITLE_P2[2]),
subtitle=SUBTITLE[5])+
annotate("text", x=1.5, y=90, label=paste0("p=",round(test_results$pvalue[i],4)))+
geom_segment(aes(x=1, xend=2,y=105,yend=105))+
geom_segment(aes(x=1, xend=1,y=109,yend=100))+
geom_segment(aes(x=2, xend=2,y=109,yend=100))+
theme_classic()
pWarning: Removed 107 rows containing non-finite values (stat_ydensity).Warning: Removed 108 rows containing missing values (geom_point).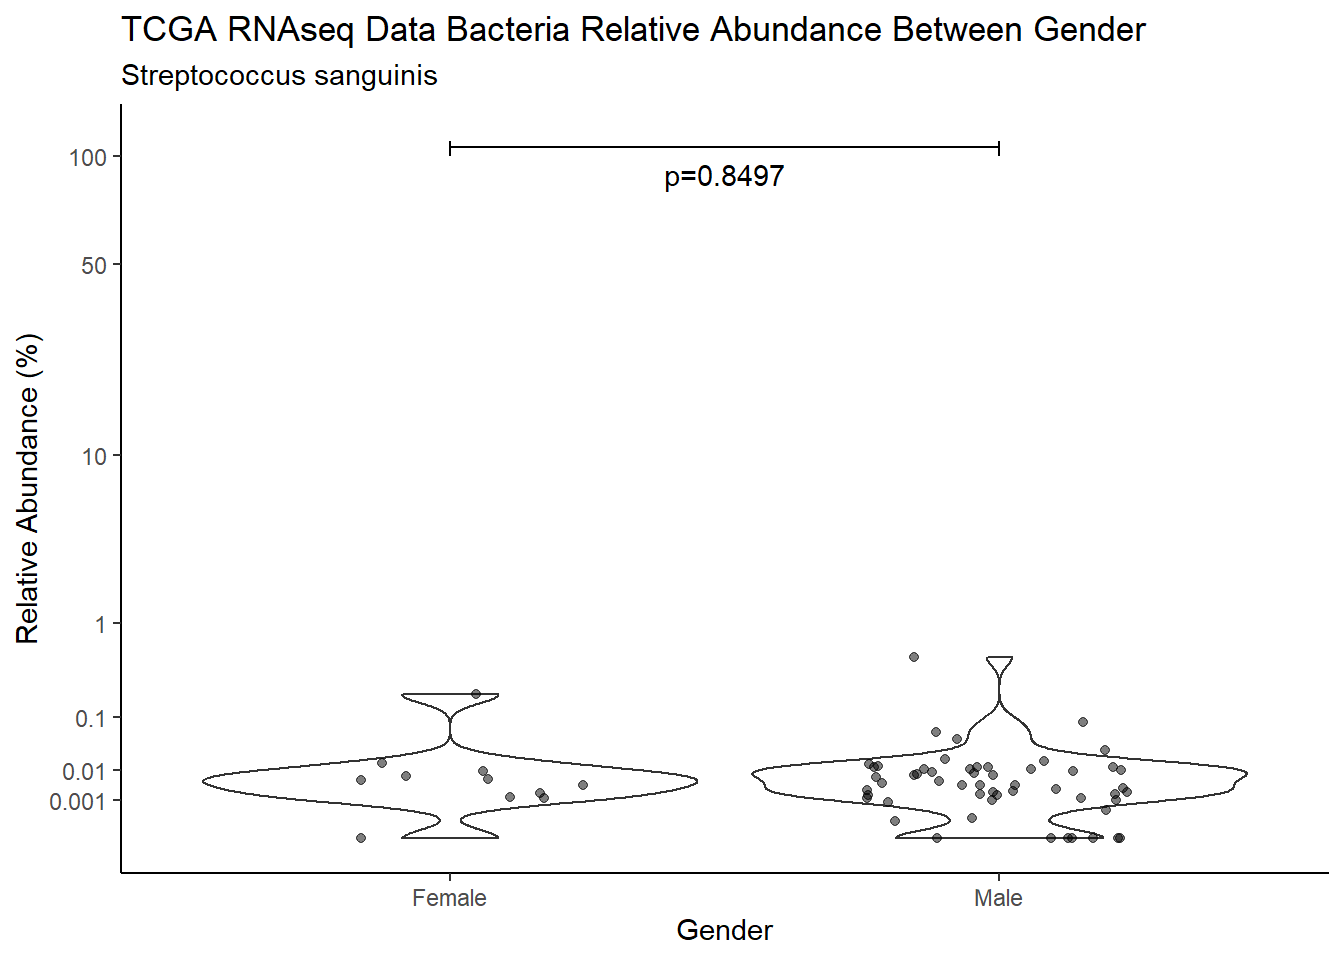
ggsave("output/supplemental_figure2D_tcga_rna_strepto.pdf", p, units = "in", width = DIM[1], height = DIM[2])Warning: Removed 107 rows containing non-finite values (stat_ydensity).Warning: Removed 111 rows containing missing values (geom_point).ggsave("output/supplemental_figure2D_tcga_rna_strepto.png", p, units = "in", width = DIM[1], height = DIM[2])Warning: Removed 107 rows containing non-finite values (stat_ydensity).Warning: Removed 109 rows containing missing values (geom_point).i <- i+1
d <- analysis.dat %>%
filter(!is.na(Gender), source=="wgs", OTU == "Streptococcus sanguinis")
m1<-wilcox.test(Abund ~ Gender, data=d, na.rm=TRUE, paired=FALSE, exact=FALSE, conf.int=TRUE)
m1
    Wilcoxon rank sum test with continuity correction

data:  Abund by Gender
W = 683, p-value = 0.9169
alternative hypothesis: true location shift is not equal to 0
95 percent confidence interval:
 -4.837276e-05  4.855190e-05
sample estimates:
difference in location
         -2.983699e-05
test_results[i,4] <- m1$estimate
test_results[i,5] <- m1$p.value
p <- analysis.dat %>%
filter(!is.na(Gender), source=="wgs", OTU == "Streptococcus sanguinis")%>%
ggplot(aes(x=Gender, y=Abund))+
geom_violin(scale="width", adjust=1)+
geom_jitter(alpha=0.5, width = 0.25)+
scale_y_continuous(
trans=scales::trans_new("root", root, invroot),
breaks=c(0, 0.001,0.01, 0.1, 1,10,50, 100),
labels = c(0, 0.001,0.01, 0.1, 1,10,50, 100),
limits = c(0, 110)
) +
labs(x="Gender", y="Relative Abundance (%)",
title=paste0(TITLE_P1[3]," Bacteria Relative Abundance ",TITLE_P2[2]),
subtitle=SUBTITLE[5])+
annotate("text", x=1.5, y=90, label=paste0("p=",round(test_results$pvalue[i],4)))+
geom_segment(aes(x=1, xend=2,y=105,yend=105))+
geom_segment(aes(x=1, xend=1,y=109,yend=100))+
geom_segment(aes(x=2, xend=2,y=109,yend=100))+
theme_classic()
pWarning: Removed 16 rows containing non-finite values (stat_ydensity).Warning: Removed 49 rows containing missing values (geom_point).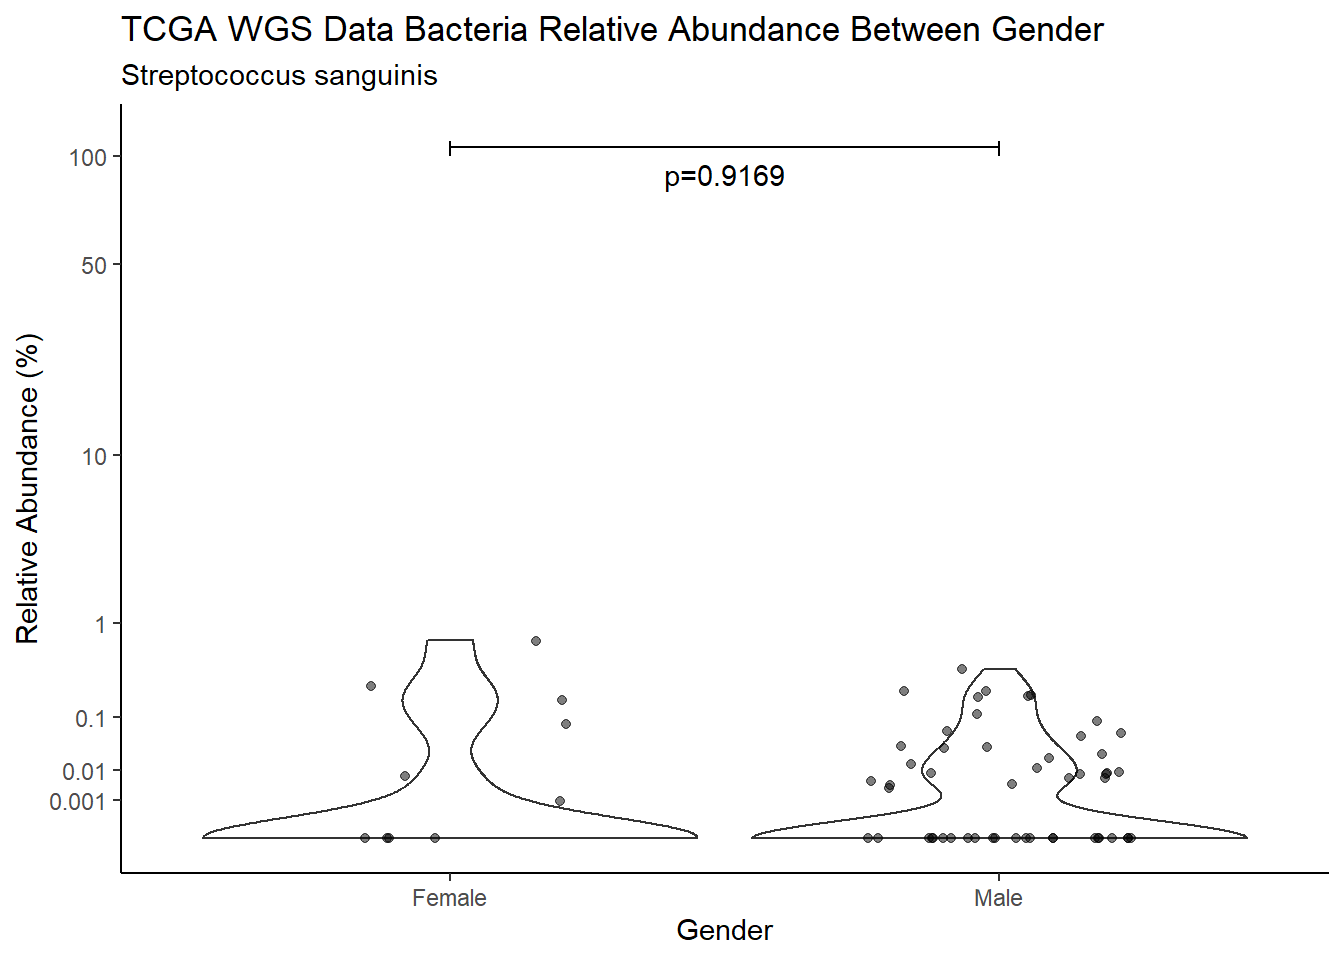
ggsave("output/supplemental_figure2D_tcga_wgs_strepto.pdf", p, units = "in", width = DIM[1], height = DIM[2])Warning: Removed 16 rows containing non-finite values (stat_ydensity).Warning: Removed 46 rows containing missing values (geom_point).ggsave("output/supplemental_figure2D_tcga_wgs_strepto.png", p, units = "in", width = DIM[1], height = DIM[2])Warning: Removed 16 rows containing non-finite values (stat_ydensity).Warning: Removed 45 rows containing missing values (geom_point).Race
#root function
root<-function(x){
  x <- ifelse(x < 0, 0, x)
  x**(0.25)
}
#inverse root function
invroot<-function(x){
  x**(4)
}
DIM <- c(6, 4)

# merge datasets by subsetting to specific variables then merging
analysis.dat <- dat.16s.s %>%
  dplyr::mutate(ID = as.factor(accession.number)) %>%
  dplyr::select(OTU, sample_type, tumor, Abundance, ID, source, Race)

dat <- dat.rna.s %>%
  dplyr::mutate(Race = race) %>%
  dplyr::select(OTU, sample_type, tumor, Abundance, ID, source, Race)
analysis.dat <- full_join(analysis.dat, dat)
Joining, by = c("OTU", "sample_type", "tumor", "Abundance", "ID", "source",
"Race")dat <- dat.wgs.s %>%
dplyr::mutate(Race = race) %>%
dplyr::select(OTU, sample_type, tumor, Abundance, ID, source, Race)
analysis.dat <- full_join(analysis.dat, dat) %>%
mutate(
pres = ifelse(Abundance > 0, 1, 0),
Abund = Abundance*100,
Tumor = ifelse(tumor==1, "Tumor", "No Tumor")
)Joining, by = c("OTU", "sample_type", "tumor", "Abundance", "ID", "source",
"Race")analysis.dat$Race[analysis.dat$Race == "asian"] <- NA
analysis.dat$Race[analysis.dat$Race == "B"] <- "AA"
analysis.dat$Race[analysis.dat$Race == "black or african american"] <- "AA"
analysis.dat$Race[analysis.dat$Race == "H"] <- NA
analysis.dat$Race[analysis.dat$Race == "O"] <- NA
analysis.dat$Race[analysis.dat$Race == "W"] <- "EA"
analysis.dat$Race[analysis.dat$Race == "white"] <- "EA"
i <- i+1
d <- analysis.dat %>%
filter(!is.na(Race), source=="16s")
m1<-wilcox.test(Abund ~ Race, data=d, na.rm=TRUE, paired=FALSE, exact=FALSE, conf.int=TRUE)
m1
    Wilcoxon rank sum test with continuity correction

data:  Abund by Race
W = 15296, p-value = 0.8229
alternative hypothesis: true location shift is not equal to 0
95 percent confidence interval:
 -6.877766e-02  3.687653e-05
sample estimates:
difference in location
         -2.061302e-05
test_results[i,4] <- m1$estimate
test_results[i,5] <- m1$p.value
p <- analysis.dat %>%
filter(!is.na(Race), source=="16s")%>%
ggplot(aes(x=Race, y=Abund))+
geom_violin(scale="width", adjust=1)+
geom_jitter(alpha=0.5, width = 0.25)+
scale_y_continuous(
trans=scales::trans_new("root", root, invroot),
breaks=c(0, 0.001,0.01, 0.1, 1,10,50, 100),
labels = c(0, 0.001,0.01, 0.1, 1,10,50, 100),
limits = c(0, 110)
) +
labs(x="Race", y="Relative Abundance (%)",
title=paste0(TITLE_P1[1]," Bacteria Relative Abundance ",TITLE_P2[3]),
subtitle=SUBTITLE[1])+
annotate("text", x=1.5, y=90, label=paste0("p=",round(test_results$pvalue[i],4)))+
geom_segment(aes(x=1, xend=2,y=105,yend=105))+
geom_segment(aes(x=1, xend=1,y=109,yend=100))+
geom_segment(aes(x=2, xend=2,y=109,yend=100))+
theme_classic()
pWarning: Removed 133 rows containing missing values (geom_point).
ggsave("output/supplemental_figure2E_NCI_combined.pdf", p, units = "in", width = DIM[1], height = DIM[2])Warning: Removed 134 rows containing missing values (geom_point).ggsave("output/supplemental_figure2E_NCI_combined.png", p, units = "in", width = DIM[1], height = DIM[2])Warning: Removed 130 rows containing missing values (geom_point).i <- i+1
d <- analysis.dat %>%
filter(!is.na(Race), source=="rna")
m1<-wilcox.test(Abund ~ Race, data=d, na.rm=TRUE, paired=FALSE, exact=FALSE, conf.int=TRUE)
m1
    Wilcoxon rank sum test with continuity correction

data:  Abund by Race
W = 1620, p-value = 0.002684
alternative hypothesis: true location shift is not equal to 0
95 percent confidence interval:
 0.002083263 0.154741366
sample estimates:
difference in location
             0.0851424
test_results[i,4] <- m1$estimate
test_results[i,5] <- m1$p.value
p <- analysis.dat %>%
filter(source=="rna", !is.na(Race))%>%
ggplot(aes(x=Race, y=Abund))+
geom_violin(scale="width", adjust=1)+
geom_jitter(alpha=0.5, width = 0.25)+
scale_y_continuous(
trans=scales::trans_new("root", root, invroot),
breaks=c(0, 0.001,0.01, 0.1, 1,10,50, 100),
labels = c(0, 0.001,0.01, 0.1, 1,10,50, 100),
limits = c(0, 110)
) +
labs(x="Race", y="Relative Abundance (%)",
title=paste0(TITLE_P1[2]," Bacteria Relative Abundance ",TITLE_P2[3]),
subtitle=SUBTITLE[1])+
annotate("text", x=1.5, y=90, label=paste0("p=",round(test_results$pvalue[i],4)))+
geom_segment(aes(x=1, xend=2,y=105,yend=105))+
geom_segment(aes(x=1, xend=1,y=109,yend=100))+
geom_segment(aes(x=2, xend=2,y=109,yend=100))+
theme_classic()
pWarning: Removed 532 rows containing non-finite values (stat_ydensity).Warning: Removed 583 rows containing missing values (geom_point).
ggsave("output/supplemental_figure2E_tcga_rna_combined.pdf", p, units = "in", width = DIM[1], height = DIM[2])Warning: Removed 532 rows containing non-finite values (stat_ydensity).Warning: Removed 577 rows containing missing values (geom_point).ggsave("output/supplemental_figure2E_tcga_rna_combined.png", p, units = "in", width = DIM[1], height = DIM[2])Warning: Removed 532 rows containing non-finite values (stat_ydensity).
Removed 577 rows containing missing values (geom_point).i <- i+1
d <- analysis.dat %>%
filter(!is.na(Race), source=="wgs")
m1<-wilcox.test(Abund ~ Race, data=d, na.rm=TRUE, paired=FALSE, exact=FALSE, conf.int=TRUE)
m1
    Wilcoxon rank sum test with continuity correction

data:  Abund by Race
W = 4875, p-value = 0.074
alternative hypothesis: true location shift is not equal to 0
95 percent confidence interval:
 -6.932770e-06  3.222919e-02
sample estimates:
difference in location
          3.318886e-05
test_results[i,4] <- m1$estimate
test_results[i,5] <- m1$p.value
p <- analysis.dat %>%
filter(source=="wgs", !is.na(Race))%>%
ggplot(aes(x=Race, y=Abund))+
geom_violin(scale="width", adjust=1)+
geom_jitter(alpha=0.5, width = 0.25)+
scale_y_continuous(
trans=scales::trans_new("root", root, invroot),
breaks=c(0, 0.001,0.01, 0.1, 1,10,50, 100),
labels = c(0, 0.001,0.01, 0.1, 1,10,50, 100),
limits = c(0, 110)
) +
labs(x="Race", y="Relative Abundance (%)",
title=paste0(TITLE_P1[3]," Bacteria Relative Abundance ",TITLE_P2[3]),
subtitle=SUBTITLE[1])+
annotate("text", x=1.5, y=90, label=paste0("p=",round(test_results$pvalue[i],4)))+
geom_segment(aes(x=1, xend=2,y=105,yend=105))+
geom_segment(aes(x=1, xend=1,y=109,yend=100))+
geom_segment(aes(x=2, xend=2,y=109,yend=100))+
theme_classic()
pWarning: Removed 77 rows containing non-finite values (stat_ydensity).Warning: Removed 180 rows containing missing values (geom_point).
ggsave("output/supplemental_figure2E_tcga_wgs_combined.pdf", p, units = "in", width = DIM[1], height = DIM[2])Warning: Removed 77 rows containing non-finite values (stat_ydensity).Warning: Removed 205 rows containing missing values (geom_point).ggsave("output/supplemental_figure2E_tcga_wgs_combined.png", p, units = "in", width = DIM[1], height = DIM[2])Warning: Removed 77 rows containing non-finite values (stat_ydensity).Warning: Removed 202 rows containing missing values (geom_point).Subset by Bacterium
# merge datasets by subsetting to specific variables then merging
analysis.dat <- dat.16s.s %>%
  dplyr::mutate(ID = as.factor(accession.number)) %>%
  dplyr::select(OTU, sample_type, tumor, Abundance, ID, source, Race)

dat <- dat.rna.s %>%
  dplyr::mutate(Race = race) %>%
  dplyr::select(OTU, sample_type, tumor, Abundance, ID, source, Race)
analysis.dat <- full_join(analysis.dat, dat)
Joining, by = c("OTU", "sample_type", "tumor", "Abundance", "ID", "source",
"Race")dat <- dat.wgs.s %>%
dplyr::mutate(Race = race) %>%
dplyr::select(OTU, sample_type, tumor, Abundance, ID, source, Race)
analysis.dat <- full_join(analysis.dat, dat) %>%
mutate(
pres = ifelse(Abundance > 0, 1, 0),
Abund = Abundance*100,
Tumor = ifelse(tumor==1, "Tumor", "No Tumor")
)Joining, by = c("OTU", "sample_type", "tumor", "Abundance", "ID", "source",
"Race")analysis.dat$Race[analysis.dat$Race == "asian"] <- NA
analysis.dat$Race[analysis.dat$Race == "B"] <- "AA"
analysis.dat$Race[analysis.dat$Race == "black or african american"] <- "AA"
analysis.dat$Race[analysis.dat$Race == "H"] <- NA
analysis.dat$Race[analysis.dat$Race == "O"] <- NA
analysis.dat$Race[analysis.dat$Race == "W"] <- "EA"
analysis.dat$Race[analysis.dat$Race == "white"] <- "EA"
i <- i+1
d <- analysis.dat %>%
filter(!is.na(Race), source=="16s", OTU == "Fusobacterium nucleatum")
m1<-wilcox.test(Abund ~ Race, data=d, na.rm=TRUE, paired=FALSE, exact=FALSE, conf.int=TRUE)
m1
    Wilcoxon rank sum test with continuity correction

data:  Abund by Race
W = 970, p-value = 0.9862
alternative hypothesis: true location shift is not equal to 0
95 percent confidence interval:
 -0.1999612  0.1979485
sample estimates:
difference in location
         -4.020351e-05
test_results[i,4] <- m1$estimate
test_results[i,5] <- m1$p.value
p <- analysis.dat %>%
filter(!is.na(Race), source=="16s", OTU == "Fusobacterium nucleatum")%>%
ggplot(aes(x=Race, y=Abund))+
geom_violin(scale="width", adjust=1)+
geom_jitter(alpha=0.5, width = 0.25)+
scale_y_continuous(
trans=scales::trans_new("root", root, invroot),
breaks=c(0, 0.001,0.01, 0.1, 1,10,50, 100),
labels = c(0, 0.001,0.01, 0.1, 1,10,50, 100),
limits = c(0, 110)
) +
labs(x="Race", y="Relative Abundance (%)",
title=paste0(TITLE_P1[1]," Bacteria Relative Abundance ",TITLE_P2[3]),
subtitle=SUBTITLE[2])+
annotate("text", x=1.5, y=90, label=paste0("p=",round(test_results$pvalue[i],4)))+
geom_segment(aes(x=1, xend=2,y=105,yend=105))+
geom_segment(aes(x=1, xend=1,y=109,yend=100))+
geom_segment(aes(x=2, xend=2,y=109,yend=100))+
theme_classic()
pWarning: Removed 46 rows containing missing values (geom_point).
ggsave("output/supplemental_figure2E_NCI_fuso.pdf", p, units = "in", width = DIM[1], height = DIM[2])Warning: Removed 36 rows containing missing values (geom_point).ggsave("output/supplemental_figure2E_NCI_fuso.png", p, units = "in", width = DIM[1], height = DIM[2])Warning: Removed 41 rows containing missing values (geom_point).i <- i+1
d <- analysis.dat %>%
filter(!is.na(Race), source=="rna", OTU == "Fusobacterium nucleatum")
m1<-wilcox.test(Abund ~ Race, data=d, na.rm=TRUE, paired=FALSE, exact=FALSE, conf.int=TRUE)
m1
    Wilcoxon rank sum test with continuity correction

data:  Abund by Race
W = 38, p-value = 0.1391
alternative hypothesis: true location shift is not equal to 0
95 percent confidence interval:
 -20.323901   4.521115
sample estimates:
difference in location
              4.515127
test_results[i,4] <- m1$estimate
test_results[i,5] <- m1$p.value
p <- analysis.dat %>%
filter(!is.na(Race), source=="rna", OTU == "Fusobacterium nucleatum")%>%
ggplot(aes(x=Race, y=Abund))+
geom_violin(scale="width", adjust=1)+
geom_jitter(alpha=0.5, width = 0.25)+
scale_y_continuous(
trans=scales::trans_new("root", root, invroot),
breaks=c(0, 0.001,0.01, 0.1, 1,10,50, 100),
labels = c(0, 0.001,0.01, 0.1, 1,10,50, 100),
limits = c(0, 110)
) +
labs(x="Race", y="Relative Abundance (%)",
title=paste0(TITLE_P1[2]," Bacteria Relative Abundance ",TITLE_P2[3]),
subtitle=SUBTITLE[2])+
annotate("text", x=1.5, y=90, label=paste0("p=",round(test_results$pvalue[i],4)))+
geom_segment(aes(x=1, xend=2,y=105,yend=105))+
geom_segment(aes(x=1, xend=1,y=109,yend=100))+
geom_segment(aes(x=2, xend=2,y=109,yend=100))+
theme_classic()
pWarning: Removed 76 rows containing non-finite values (stat_ydensity).Warning: Groups with fewer than two data points have been dropped.Warning: Removed 78 rows containing missing values (geom_point).
ggsave("output/supplemental_figure2E_tcga_rna_fuso.pdf", p, units = "in", width = DIM[1], height = DIM[2])Warning: Removed 76 rows containing non-finite values (stat_ydensity).Warning: Groups with fewer than two data points have been dropped.Warning: Removed 76 rows containing missing values (geom_point).ggsave("output/supplemental_figure2E_tcga_rna_fuso.png", p, units = "in", width = DIM[1], height = DIM[2])Warning: Removed 76 rows containing non-finite values (stat_ydensity).Warning: Groups with fewer than two data points have been dropped.Warning: Removed 77 rows containing missing values (geom_point).i <- i+1
d <- analysis.dat %>%
filter(!is.na(Race), source=="wgs", OTU == "Fusobacterium nucleatum")
m1<-wilcox.test(Abund ~ Race, data=d, na.rm=TRUE, paired=FALSE, exact=FALSE, conf.int=TRUE)
m1
    Wilcoxon rank sum test with continuity correction

data:  Abund by Race
W = 95.5, p-value = 0.6489
alternative hypothesis: true location shift is not equal to 0
95 percent confidence interval:
 -0.4853847  9.3518385
sample estimates:
difference in location
            0.04431116
test_results[i,4] <- m1$estimate
test_results[i,5] <- m1$p.value
p <- analysis.dat %>%
filter(!is.na(Race), source=="wgs", OTU == "Fusobacterium nucleatum")%>%
ggplot(aes(x=Race, y=Abund))+
geom_violin(scale="width", adjust=1)+
geom_jitter(alpha=0.5, width = 0.25)+
scale_y_continuous(
trans=scales::trans_new("root", root, invroot),
breaks=c(0, 0.001,0.01, 0.1, 1,10,50, 100),
labels = c(0, 0.001,0.01, 0.1, 1,10,50, 100),
limits = c(0, 110)
) +
labs(x="Race", y="Relative Abundance (%)",
title=paste0(TITLE_P1[3]," Bacteria Relative Abundance ",TITLE_P2[3]),
subtitle=SUBTITLE[2])+
annotate("text", x=1.5, y=90, label=paste0("p=",round(test_results$pvalue[i],4)))+
geom_segment(aes(x=1, xend=2,y=105,yend=105))+
geom_segment(aes(x=1, xend=1,y=109,yend=100))+
geom_segment(aes(x=2, xend=2,y=109,yend=100))+
theme_classic()
pWarning: Removed 11 rows containing non-finite values (stat_ydensity).Warning: Removed 26 rows containing missing values (geom_point).
ggsave("output/supplemental_figure2E_tcga_wgs_fuso.pdf", p, units = "in", width = DIM[1], height = DIM[2])Warning: Removed 11 rows containing non-finite values (stat_ydensity).Warning: Removed 24 rows containing missing values (geom_point).ggsave("output/supplemental_figure2E_tcga_wgs_fuso.png", p, units = "in", width = DIM[1], height = DIM[2])Warning: Removed 11 rows containing non-finite values (stat_ydensity).Warning: Removed 26 rows containing missing values (geom_point).i <- i+1
d <- analysis.dat %>%
filter(!is.na(Race), source=="16s", OTU == "Prevotella melaninogenica" | OTU =="Prevotella spp.")
m1<-wilcox.test(Abund ~ Race, data=d, na.rm=TRUE, paired=FALSE, exact=FALSE, conf.int=TRUE)
m1
    Wilcoxon rank sum test with continuity correction

data:  Abund by Race
W = 911.5, p-value = 0.696
alternative hypothesis: true location shift is not equal to 0
95 percent confidence interval:
 -1.6108658  0.2000605
sample estimates:
difference in location
         -1.826919e-05
test_results[i,4] <- m1$estimate
test_results[i,5] <- m1$p.value
p <- analysis.dat %>%
filter(!is.na(Race), source=="16s", OTU == "Prevotella melaninogenica" | OTU =="Prevotella spp.")%>%
ggplot(aes(x=Race, y=Abund))+
geom_violin(scale="width", adjust=1)+
geom_jitter(alpha=0.5, width = 0.25)+
scale_y_continuous(
trans=scales::trans_new("root", root, invroot),
breaks=c(0, 0.001,0.01, 0.1, 1,10,50, 100),
labels = c(0, 0.001,0.01, 0.1, 1,10,50, 100),
limits = c(0, 110)
) +
labs(x="Race", y="Relative Abundance (%)",
title=paste0(TITLE_P1[1]," Bacteria Relative Abundance ",TITLE_P2[3]),
subtitle=SUBTITLE[3])+
annotate("text", x=1.5, y=90, label=paste0("p=",round(test_results$pvalue[i],4)))+
geom_segment(aes(x=1, xend=2,y=105,yend=105))+
geom_segment(aes(x=1, xend=1,y=109,yend=100))+
geom_segment(aes(x=2, xend=2,y=109,yend=100))+
theme_classic()
pWarning: Removed 17 rows containing missing values (geom_point).
ggsave("output/supplemental_figure2E_NCI_prevo.pdf", p, units = "in", width = DIM[1], height = DIM[2])Warning: Removed 23 rows containing missing values (geom_point).ggsave("output/supplemental_figure2E_NCI_prevo.png", p, units = "in", width = DIM[1], height = DIM[2])Warning: Removed 24 rows containing missing values (geom_point).i <- i+1
d <- analysis.dat %>%
filter(!is.na(Race), source=="rna", , OTU == "Prevotella melaninogenica")
m1<-wilcox.test(Abund ~ Race, data=d, na.rm=TRUE, paired=FALSE, exact=FALSE, conf.int=TRUE)
m1
    Wilcoxon rank sum test with continuity correction

data:  Abund by Race
W = 39, p-value = 0.1178
alternative hypothesis: true location shift is not equal to 0
95 percent confidence interval:
 -0.3855819  0.7931673
sample estimates:
difference in location
             0.7877327
test_results[i,4] <- m1$estimate
test_results[i,5] <- m1$p.value
p <- analysis.dat %>%
filter(!is.na(Race), source=="rna", OTU == "Prevotella melaninogenica")%>%
ggplot(aes(x=Race, y=Abund))+
geom_violin(scale="width", adjust=1)+
geom_jitter(alpha=0.5, width = 0.25)+
scale_y_continuous(
trans=scales::trans_new("root", root, invroot),
breaks=c(0, 0.001,0.01, 0.1, 1,10,50, 100),
labels = c(0, 0.001,0.01, 0.1, 1,10,50, 100),
limits = c(0, 110)
) +
labs(x="Race", y="Relative Abundance (%)",
title=paste0(TITLE_P1[2]," Bacteria Relative Abundance ",TITLE_P2[3]),
subtitle=SUBTITLE[3])+
annotate("text", x=1.5, y=90, label=paste0("p=",round(test_results$pvalue[i],4)))+
geom_segment(aes(x=1, xend=2,y=105,yend=105))+
geom_segment(aes(x=1, xend=1,y=109,yend=100))+
geom_segment(aes(x=2, xend=2,y=109,yend=100))+
theme_classic()
pWarning: Removed 76 rows containing non-finite values (stat_ydensity).Warning: Groups with fewer than two data points have been dropped.Warning: Removed 78 rows containing missing values (geom_point).
ggsave("output/supplemental_figure2E_tcga_rna_prevo.pdf", p, units = "in", width = DIM[1], height = DIM[2])Warning: Removed 76 rows containing non-finite values (stat_ydensity).Warning: Groups with fewer than two data points have been dropped.Warning: Removed 78 rows containing missing values (geom_point).ggsave("output/supplemental_figure2E_tcga_rna_prevo.png", p, units = "in", width = DIM[1], height = DIM[2])Warning: Removed 76 rows containing non-finite values (stat_ydensity).Warning: Groups with fewer than two data points have been dropped.Warning: Removed 78 rows containing missing values (geom_point).i <- i+1
d <- analysis.dat %>%
filter(!is.na(Race), source=="wgs", OTU == "Prevotella melaninogenica")
m1<-wilcox.test(Abund ~ Race, data=d, na.rm=TRUE, paired=FALSE, exact=FALSE, conf.int=TRUE)
m1
    Wilcoxon rank sum test with continuity correction

data:  Abund by Race
W = 82.5, p-value = 1
alternative hypothesis: true location shift is not equal to 0
95 percent confidence interval:
 -0.741561 19.890186
sample estimates:
difference in location
           5.70719e-05
test_results[i,4] <- m1$estimate
test_results[i,5] <- m1$p.value
p <- analysis.dat %>%
filter(!is.na(Race), source=="wgs", OTU == "Prevotella melaninogenica")%>%
ggplot(aes(x=Race, y=Abund))+
geom_violin(scale="width", adjust=1)+
geom_jitter(alpha=0.5, width = 0.25)+
scale_y_continuous(
trans=scales::trans_new("root", root, invroot),
breaks=c(0, 0.001,0.01, 0.1, 1,10,50, 100),
labels = c(0, 0.001,0.01, 0.1, 1,10,50, 100),
limits = c(0, 110)
) +
labs(x="Race", y="Relative Abundance (%)",
title=paste0(TITLE_P1[3]," Bacteria Relative Abundance ",TITLE_P2[3]),
subtitle=SUBTITLE[3])+
annotate("text", x=1.5, y=90, label=paste0("p=",round(test_results$pvalue[i],4)))+
geom_segment(aes(x=1, xend=2,y=105,yend=105))+
geom_segment(aes(x=1, xend=1,y=109,yend=100))+
geom_segment(aes(x=2, xend=2,y=109,yend=100))+
theme_classic()
pWarning: Removed 11 rows containing non-finite values (stat_ydensity).Warning: Removed 19 rows containing missing values (geom_point).
ggsave("output/supplemental_figure2E_tcga_wgs_prevo.pdf", p, units = "in", width = DIM[1], height = DIM[2])Warning: Removed 11 rows containing non-finite values (stat_ydensity).Warning: Removed 21 rows containing missing values (geom_point).ggsave("output/supplemental_figure2E_tcga_wgs_prevo.png", p, units = "in", width = DIM[1], height = DIM[2])Warning: Removed 11 rows containing non-finite values (stat_ydensity).
Removed 21 rows containing missing values (geom_point).i <- i+1
d <- analysis.dat %>%
filter(!is.na(Race), source=="16s", OTU == "Campylobacter concisus")
m1<-wilcox.test(Abund ~ Race, data=d, na.rm=TRUE, paired=FALSE, exact=FALSE, conf.int=TRUE)
m1
    Wilcoxon rank sum test with continuity correction

data:  Abund by Race
W = 1058, p-value = 0.4462
alternative hypothesis: true location shift is not equal to 0
95 percent confidence interval:
 -5.697284e-05  6.744310e-06
sample estimates:
difference in location
          1.455216e-05
test_results[i,4] <- m1$estimate
test_results[i,5] <- m1$p.value
p <- analysis.dat %>%
filter(!is.na(Race), source=="16s", OTU == "Campylobacter concisus")%>%
ggplot(aes(x=Race, y=Abund))+
geom_violin(scale="width", adjust=1)+
geom_jitter(alpha=0.5, width = 0.25)+
scale_y_continuous(
trans=scales::trans_new("root", root, invroot),
breaks=c(0, 0.001,0.01, 0.1, 1,10,50, 100),
labels = c(0, 0.001,0.01, 0.1, 1,10,50, 100),
limits = c(0, 110)
) +
labs(x="Race", y="Relative Abundance (%)",
title=paste0(TITLE_P1[1]," Bacteria Relative Abundance ",TITLE_P2[3]),
subtitle=SUBTITLE[4])+
annotate("text", x=1.5, y=90, label=paste0("p=",round(test_results$pvalue[i],4)))+
geom_segment(aes(x=1, xend=2,y=105,yend=105))+
geom_segment(aes(x=1, xend=1,y=109,yend=100))+
geom_segment(aes(x=2, xend=2,y=109,yend=100))+
theme_classic()
pWarning: Removed 61 rows containing missing values (geom_point).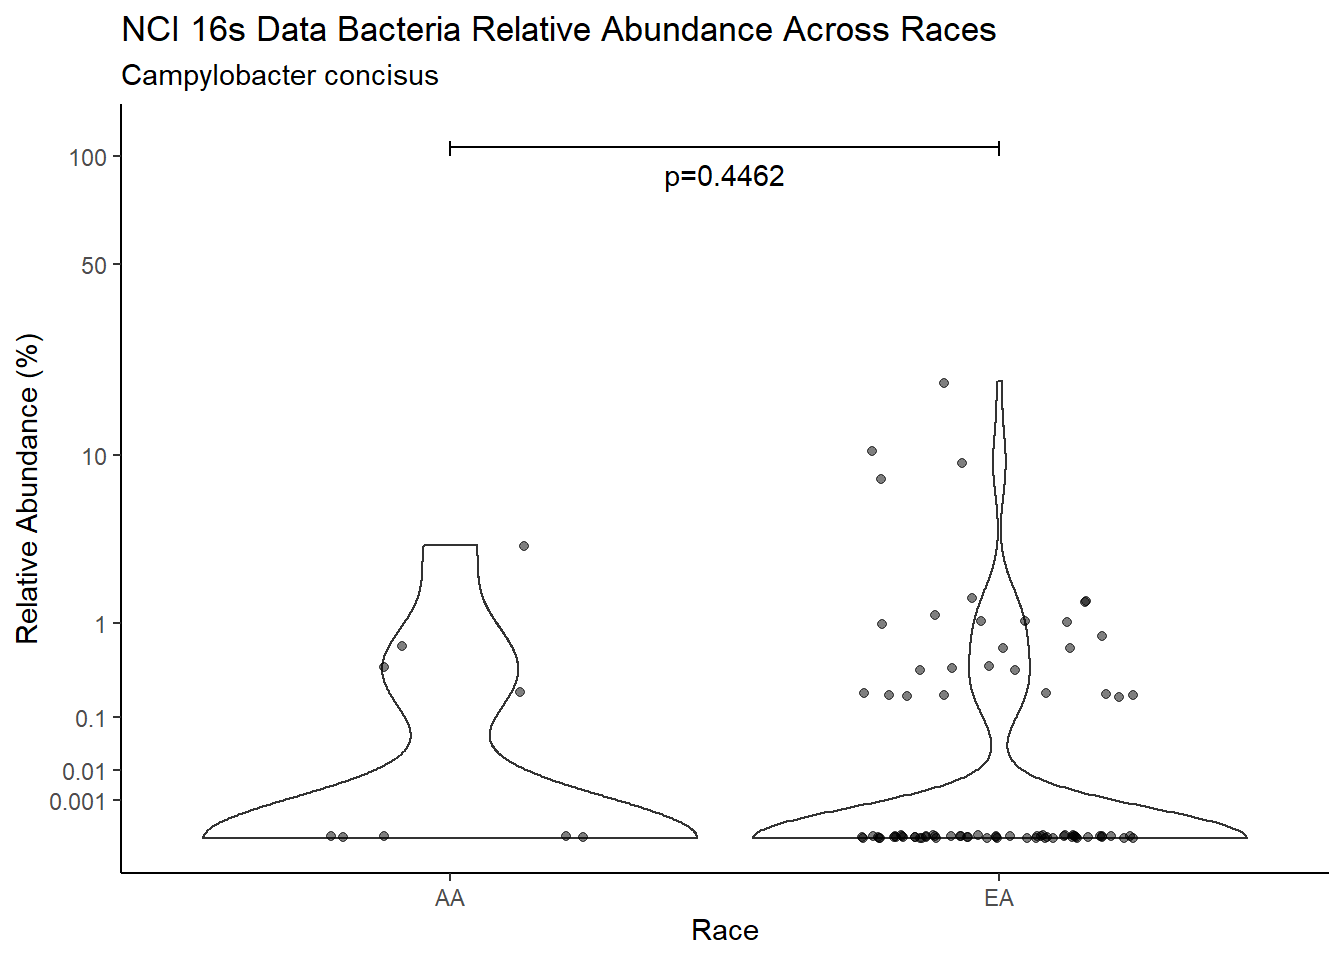
ggsave("output/supplemental_figure2E_NCI_campy.pdf", p, units = "in", width = DIM[1], height = DIM[2])Warning: Removed 57 rows containing missing values (geom_point).ggsave("output/supplemental_figure2E_NCI_campy.png", p, units = "in", width = DIM[1], height = DIM[2])Warning: Removed 69 rows containing missing values (geom_point).i <- i+1
d <- analysis.dat %>%
filter(!is.na(Race), source=="rna", OTU == "Campylobacter concisus")
m1<-wilcox.test(Abund ~ Race, data=d, na.rm=TRUE, paired=FALSE, exact=FALSE, conf.int=TRUE)
m1
    Wilcoxon rank sum test with continuity correction

data:  Abund by Race
W = 39, p-value = 0.06438
alternative hypothesis: true location shift is not equal to 0
95 percent confidence interval:
 -0.02223931  0.03198255
sample estimates:
difference in location
            0.03198255
test_results[i,4] <- m1$estimate
test_results[i,5] <- m1$p.value
p <- analysis.dat %>%
filter(!is.na(Race), source=="rna", OTU == "Campylobacter concisus")%>%
ggplot(aes(x=Race, y=Abund))+
geom_violin(scale="width", adjust=1)+
geom_jitter(alpha=0.5, width = 0.25)+
scale_y_continuous(
trans=scales::trans_new("root", root, invroot),
breaks=c(0, 0.001,0.01, 0.1, 1,10,50, 100),
labels = c(0, 0.001,0.01, 0.1, 1,10,50, 100),
limits = c(0, 110)
) +
labs(x="Race", y="Relative Abundance (%)",
title=paste0(TITLE_P1[2]," Bacteria Relative Abundance ",TITLE_P2[3]),
subtitle=SUBTITLE[4])+
annotate("text", x=1.5, y=90, label=paste0("p=",round(test_results$pvalue[i],4)))+
geom_segment(aes(x=1, xend=2,y=105,yend=105))+
geom_segment(aes(x=1, xend=1,y=109,yend=100))+
geom_segment(aes(x=2, xend=2,y=109,yend=100))+
theme_classic()
pWarning: Removed 76 rows containing non-finite values (stat_ydensity).Warning: Groups with fewer than two data points have been dropped.Warning: Removed 86 rows containing missing values (geom_point).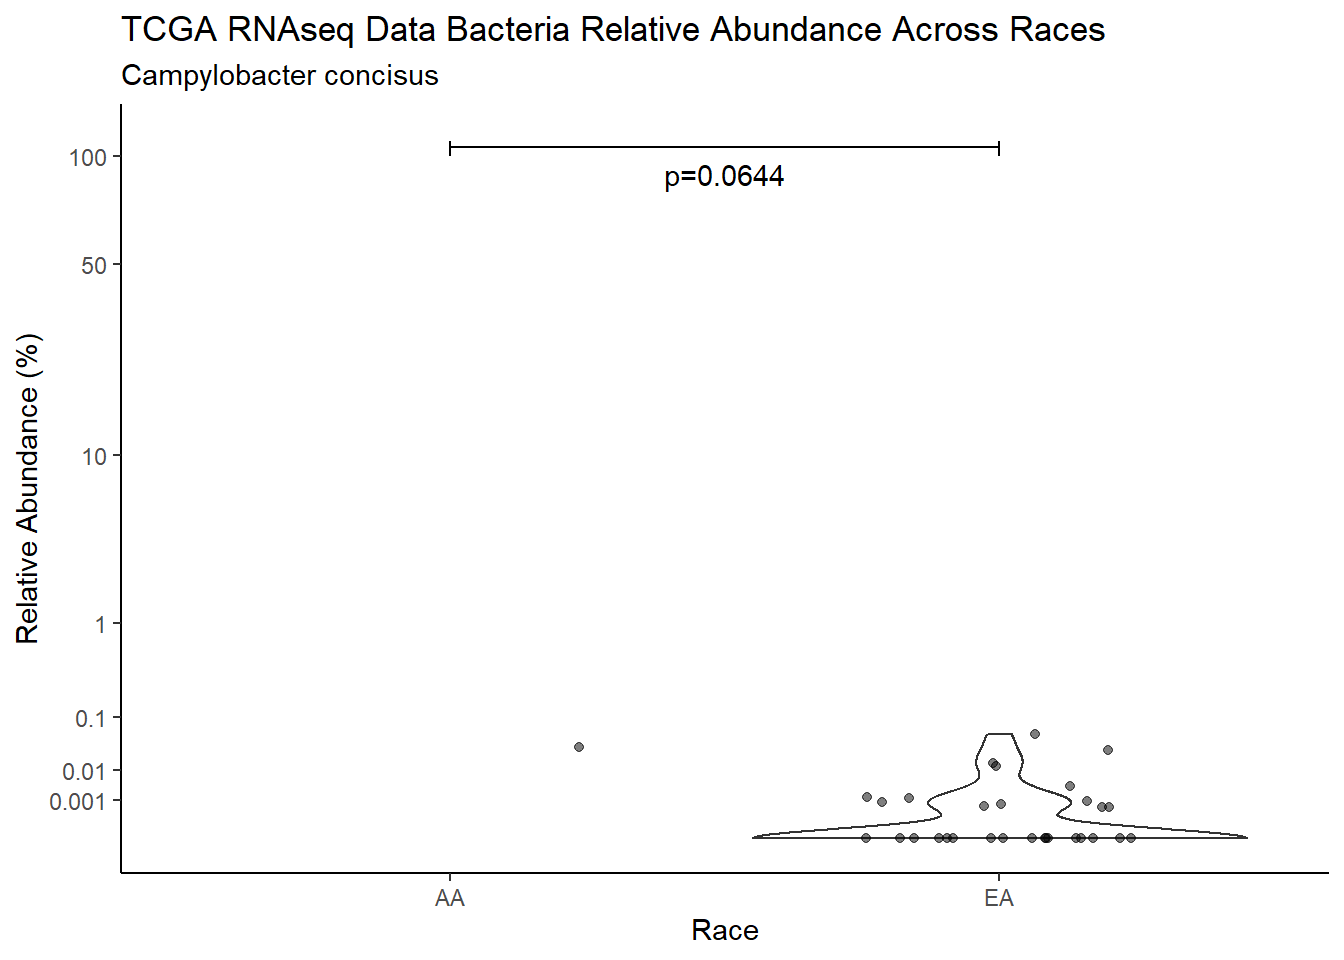
ggsave("output/supplemental_figure2E_tcga_rna_campy.pdf", p, units = "in", width = DIM[1], height = DIM[2])Warning: Removed 76 rows containing non-finite values (stat_ydensity).Warning: Groups with fewer than two data points have been dropped.Warning: Removed 92 rows containing missing values (geom_point).ggsave("output/supplemental_figure2E_tcga_rna_campy.png", p, units = "in", width = DIM[1], height = DIM[2])Warning: Removed 76 rows containing non-finite values (stat_ydensity).Warning: Groups with fewer than two data points have been dropped.Warning: Removed 89 rows containing missing values (geom_point).i <- i+1
d <- analysis.dat %>%
filter(!is.na(Race), source=="wgs", OTU == "Campylobacter concisus")
m1<-wilcox.test(Abund ~ Race, data=d, na.rm=TRUE, paired=FALSE, exact=FALSE, conf.int=TRUE)
m1
    Wilcoxon rank sum test with continuity correction

data:  Abund by Race
W = 80, p-value = 0.9358
alternative hypothesis: true location shift is not equal to 0
95 percent confidence interval:
 -0.02889812  0.13061982
sample estimates:
difference in location
         -4.615721e-05
test_results[i,4] <- m1$estimate
test_results[i,5] <- m1$p.value
p <- analysis.dat %>%
filter(!is.na(Race), source=="wgs", OTU == "Campylobacter concisus")%>%
ggplot(aes(x=Race, y=Abund))+
geom_violin(scale="width", adjust=1)+
geom_jitter(alpha=0.5, width = 0.25)+
scale_y_continuous(
trans=scales::trans_new("root", root, invroot),
breaks=c(0, 0.001,0.01, 0.1, 1,10,50, 100),
labels = c(0, 0.001,0.01, 0.1, 1,10,50, 100),
limits = c(0, 110)
) +
labs(x="Race", y="Relative Abundance (%)",
title=paste0(TITLE_P1[3]," Bacteria Relative Abundance ",TITLE_P2[3]),
subtitle=SUBTITLE[4])+
annotate("text", x=1.5, y=90, label=paste0("p=",round(test_results$pvalue[i],4)))+
geom_segment(aes(x=1, xend=2,y=105,yend=105))+
geom_segment(aes(x=1, xend=1,y=109,yend=100))+
geom_segment(aes(x=2, xend=2,y=109,yend=100))+
theme_classic()
pWarning: Removed 11 rows containing non-finite values (stat_ydensity).Warning: Removed 26 rows containing missing values (geom_point).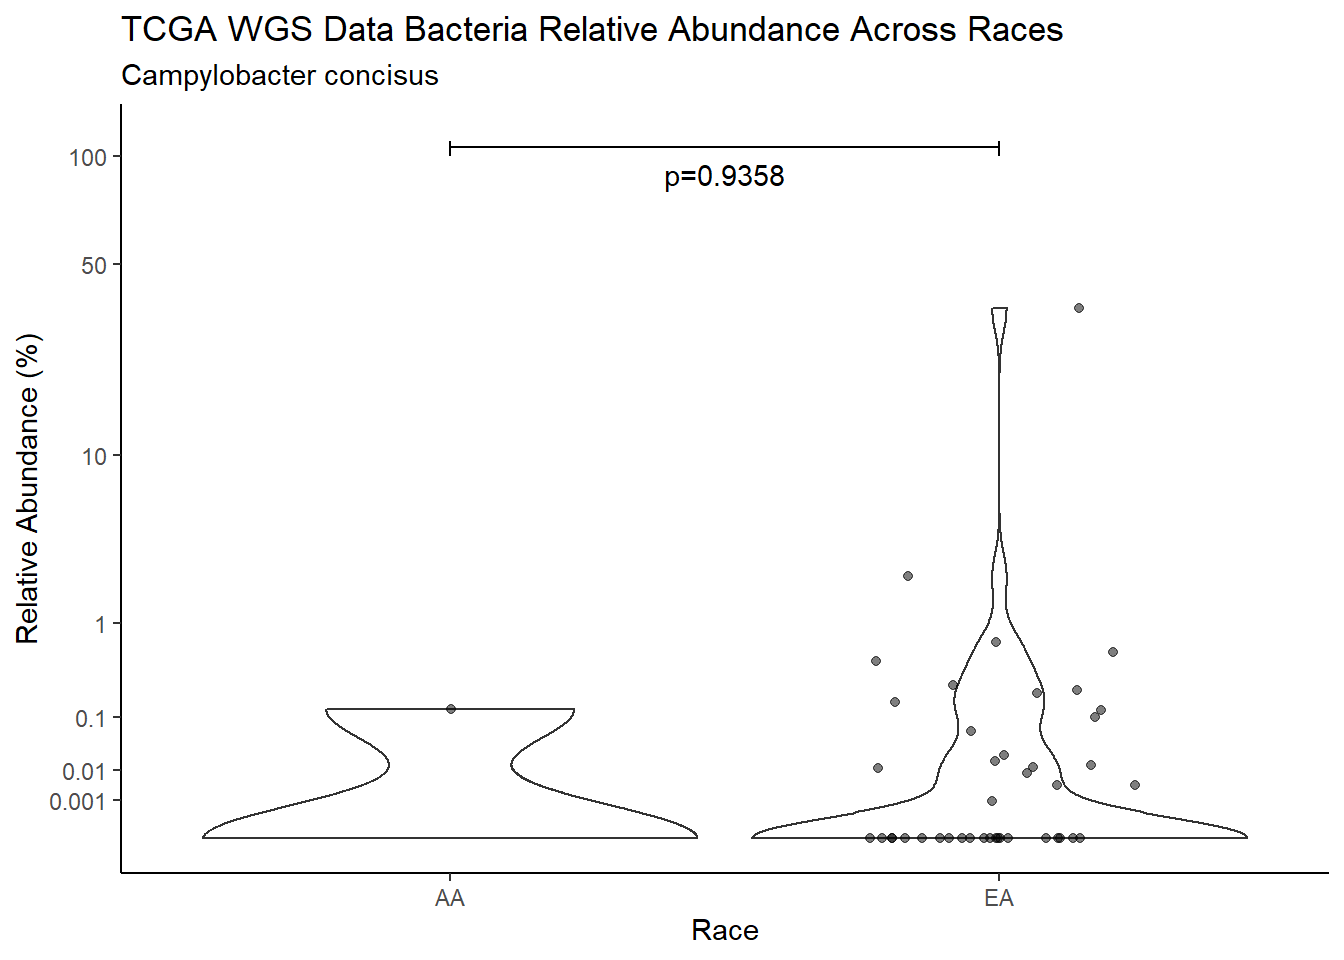
ggsave("output/supplemental_figure2E_tcga_wgs_campy.pdf", p, units = "in", width = DIM[1], height = DIM[2])Warning: Removed 11 rows containing non-finite values (stat_ydensity).Warning: Removed 27 rows containing missing values (geom_point).ggsave("output/supplemental_figure2E_tcga_wgs_campy.png", p, units = "in", width = DIM[1], height = DIM[2])Warning: Removed 11 rows containing non-finite values (stat_ydensity).Warning: Removed 30 rows containing missing values (geom_point).i <- i+1
d <- analysis.dat %>%
filter(!is.na(Race), source=="16s", OTU == "Streptococcus sanguinis")
m1<-wilcox.test(Abund ~ Race, data=d, na.rm=TRUE, paired=FALSE, exact=FALSE, conf.int=TRUE)
m1
    Wilcoxon rank sum test with continuity correction

data:  Abund by Race
W = 879, p-value = 0.554
alternative hypothesis: true location shift is not equal to 0
95 percent confidence interval:
 -17.199936   7.599966
sample estimates:
difference in location
             -2.552039
test_results[i,4] <- m1$estimate
test_results[i,5] <- m1$p.value
p <- analysis.dat %>%
filter(!is.na(Race), source=="16s", OTU == "Streptococcus sanguinis")%>%
ggplot(aes(x=Race, y=Abund))+
geom_violin(scale="width", adjust=1)+
geom_jitter(alpha=0.5, width = 0.25)+
scale_y_continuous(
trans=scales::trans_new("root", root, invroot),
breaks=c(0, 0.001,0.01, 0.1, 1,10,50, 100),
labels = c(0, 0.001,0.01, 0.1, 1,10,50, 100),
limits = c(0, 110)
) +
labs(x="Race", y="Relative Abundance (%)",
title=paste0(TITLE_P1[1]," Bacteria Relative Abundance ",TITLE_P2[3]),
subtitle=SUBTITLE[5])+
annotate("text", x=1.5, y=90, label=paste0("p=",round(test_results$pvalue[i],4)))+
geom_segment(aes(x=1, xend=2,y=105,yend=105))+
geom_segment(aes(x=1, xend=1,y=109,yend=100))+
geom_segment(aes(x=2, xend=2,y=109,yend=100))+
theme_classic()
pWarning: Removed 3 rows containing missing values (geom_point).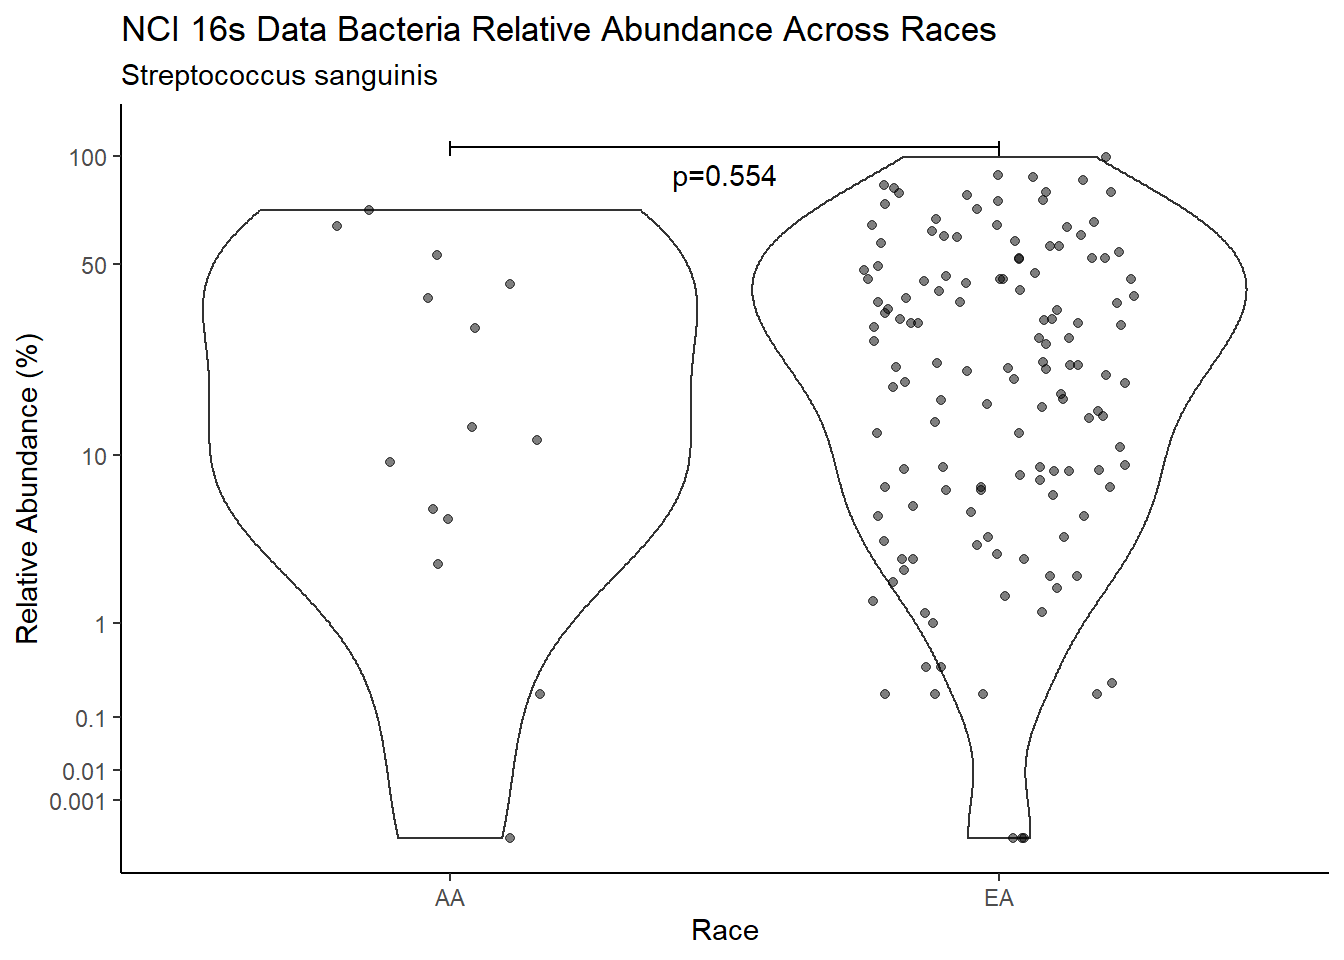
ggsave("output/supplemental_figure2E_NCI_strepto.pdf", p, units = "in", width = DIM[1], height = DIM[2])Warning: Removed 2 rows containing missing values (geom_point).ggsave("output/supplemental_figure2E_NCI_strepto.png", p, units = "in", width = DIM[1], height = DIM[2])Warning: Removed 2 rows containing missing values (geom_point).i <- i+1
d <- analysis.dat %>%
filter(!is.na(Race), source=="rna", OTU == "Streptococcus sanguinis")
m1<-wilcox.test(Abund ~ Race, data=d, na.rm=TRUE, paired=FALSE, exact=FALSE, conf.int=TRUE)
m1
    Wilcoxon rank sum test with continuity correction

data:  Abund by Race
W = 12, p-value = 0.526
alternative hypothesis: true location shift is not equal to 0
95 percent confidence interval:
 -0.19667754  0.00213217
sample estimates:
difference in location
          -0.003235715
test_results[i,4] <- m1$estimate
test_results[i,5] <- m1$p.value
p <- analysis.dat %>%
filter(!is.na(Race), source=="rna", OTU == "Streptococcus sanguinis")%>%
ggplot(aes(x=Race, y=Abund))+
geom_violin(scale="width", adjust=1)+
geom_jitter(alpha=0.5, width = 0.25)+
scale_y_continuous(
trans=scales::trans_new("root", root, invroot),
breaks=c(0, 0.001,0.01, 0.1, 1,10,50, 100),
labels = c(0, 0.001,0.01, 0.1, 1,10,50, 100),
limits = c(0, 110)
) +
labs(x="Race", y="Relative Abundance (%)",
title=paste0(TITLE_P1[2]," Bacteria Relative Abundance ",TITLE_P2[3]),
subtitle=SUBTITLE[5])+
annotate("text", x=1.5, y=90, label=paste0("p=",round(test_results$pvalue[i],4)))+
geom_segment(aes(x=1, xend=2,y=105,yend=105))+
geom_segment(aes(x=1, xend=1,y=109,yend=100))+
geom_segment(aes(x=2, xend=2,y=109,yend=100))+
theme_classic()
pWarning: Removed 76 rows containing non-finite values (stat_ydensity).Warning: Groups with fewer than two data points have been dropped.Warning: Removed 77 rows containing missing values (geom_point).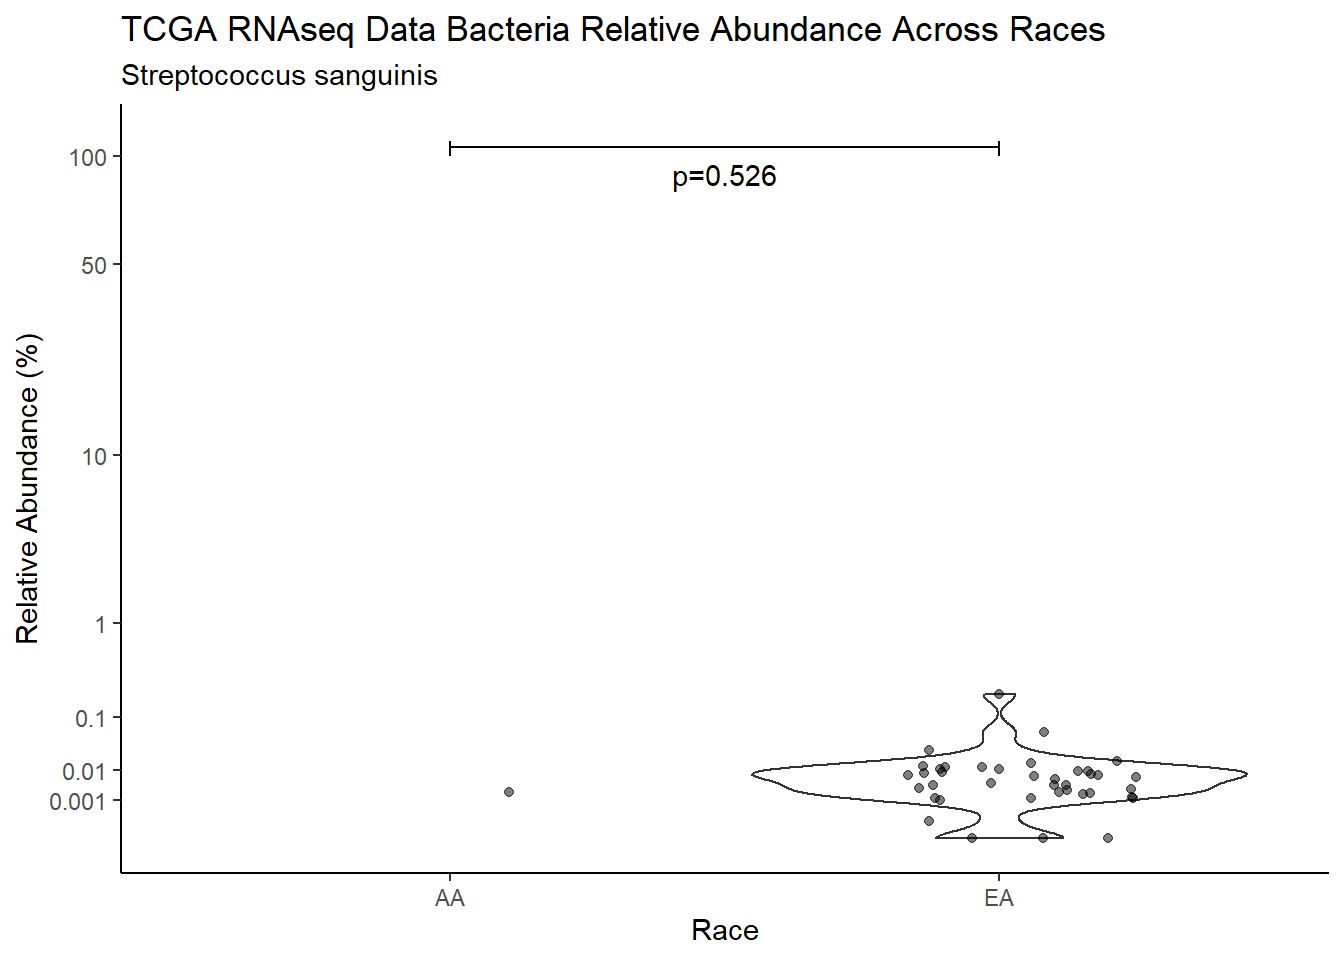
ggsave("output/supplemental_figure2E_tcga_rna_strepto.pdf", p, units = "in", width = DIM[1], height = DIM[2])Warning: Removed 76 rows containing non-finite values (stat_ydensity).Warning: Groups with fewer than two data points have been dropped.Warning: Removed 77 rows containing missing values (geom_point).ggsave("output/supplemental_figure2E_tcga_rna_strepto.png", p, units = "in", width = DIM[1], height = DIM[2])Warning: Removed 76 rows containing non-finite values (stat_ydensity).Warning: Groups with fewer than two data points have been dropped.Warning: Removed 78 rows containing missing values (geom_point).i <- i+1
d <- analysis.dat %>%
filter(!is.na(Race), source=="wgs", OTU == "Streptococcus sanguinis")
m1<-wilcox.test(Abund ~ Race, data=d, na.rm=TRUE, paired=FALSE, exact=FALSE, conf.int=TRUE)
m1
    Wilcoxon rank sum test with continuity correction

data:  Abund by Race
W = 116.5, p-value = 0.1514
alternative hypothesis: true location shift is not equal to 0
95 percent confidence interval:
 -0.0000364912  0.0321872928
sample estimates:
difference in location
           0.008332025
test_results[i,4] <- m1$estimate
test_results[i,5] <- m1$p.value
p <- analysis.dat %>%
filter(!is.na(Race), source=="wgs", OTU == "Streptococcus sanguinis")%>%
ggplot(aes(x=Race, y=Abund))+
geom_violin(scale="width", adjust=1)+
geom_jitter(alpha=0.5, width = 0.25)+
scale_y_continuous(
trans=scales::trans_new("root", root, invroot),
breaks=c(0, 0.001,0.01, 0.1, 1,10,50, 100),
labels = c(0, 0.001,0.01, 0.1, 1,10,50, 100),
limits = c(0, 110)
) +
labs(x="Race", y="Relative Abundance (%)",
title=paste0(TITLE_P1[3]," Bacteria Relative Abundance ",TITLE_P2[3]),
subtitle=SUBTITLE[5])+
annotate("text", x=1.5, y=90, label=paste0("p=",round(test_results$pvalue[i],4)))+
geom_segment(aes(x=1, xend=2,y=105,yend=105))+
geom_segment(aes(x=1, xend=1,y=109,yend=100))+
geom_segment(aes(x=2, xend=2,y=109,yend=100))+
theme_classic()
pWarning: Removed 11 rows containing non-finite values (stat_ydensity).Warning: Removed 29 rows containing missing values (geom_point).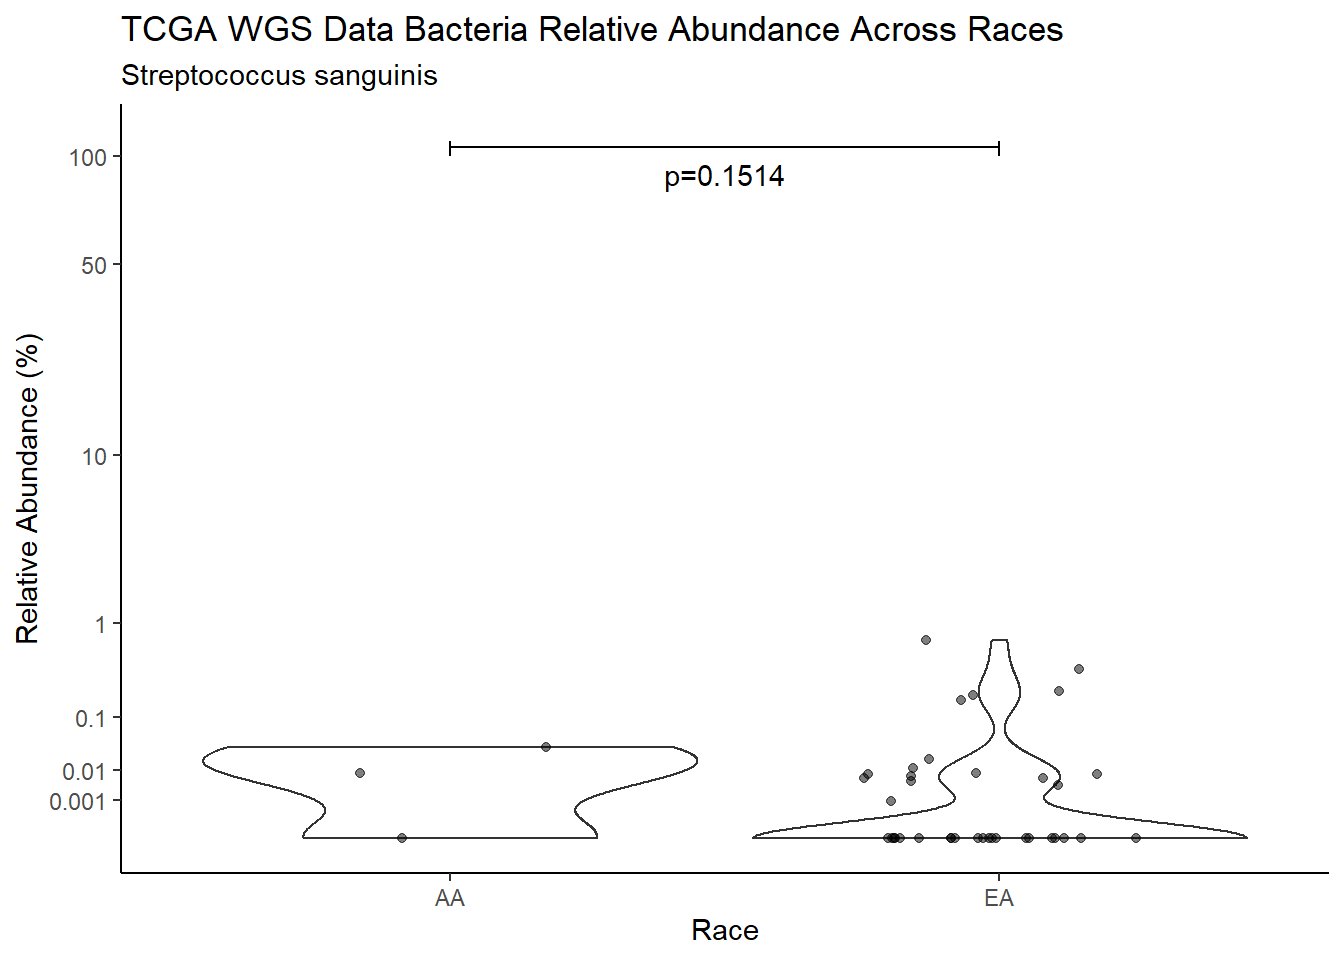
ggsave("output/supplemental_figure2E_tcga_wgs_strepto.pdf", p, units = "in", width = DIM[1], height = DIM[2])Warning: Removed 11 rows containing non-finite values (stat_ydensity).
Removed 29 rows containing missing values (geom_point).ggsave("output/supplemental_figure2E_tcga_wgs_strepto.png", p, units = "in", width = DIM[1], height = DIM[2])Warning: Removed 11 rows containing non-finite values (stat_ydensity).Warning: Removed 34 rows containing missing values (geom_point).Stage
#root function
root<-function(x){
  x <- ifelse(x < 0, 0, x)
  x**(0.25)
}
#inverse root function
invroot<-function(x){
  x**(4)
}
DIM <- c(6, 4)

# merge datasets by subsetting to specific variables then merging
analysis.dat <- dat.16s.s %>%
  dplyr::mutate(ID = as.factor(accession.number)) %>%
  dplyr::select(OTU, sample_type, tumor, Abundance, ID, source, tumor.stage)

dat <- dat.rna.s %>%
  dplyr::select(OTU, sample_type, tumor, Abundance, ID, source, tumor.stage)
analysis.dat <- full_join(analysis.dat, dat)
Joining, by = c("OTU", "sample_type", "tumor", "Abundance", "ID", "source",
"tumor.stage")dat <- dat.wgs.s %>%
dplyr::select(OTU, sample_type, tumor, Abundance, ID, source, tumor.stage)
analysis.dat <- full_join(analysis.dat, dat) %>%
mutate(
pres = ifelse(Abundance > 0, 1, 0),
Abund = Abundance*100,
Tumor = ifelse(tumor==1, "Tumor", "No Tumor"),
Tumor_Stage = tumor.stage
)Joining, by = c("OTU", "sample_type", "tumor", "Abundance", "ID", "source",
"tumor.stage")analysis.dat$Tumor_Stage[analysis.dat$Tumor_Stage == "1"] <- "I"
i <- i+1
d <- analysis.dat %>%
filter(!is.na(Tumor_Stage), source=="16s")
m1<-kruskal.test(Abund ~ Tumor_Stage, data=d)
m1
    Kruskal-Wallis rank sum test

data:  Abund by Tumor_Stage
Kruskal-Wallis chi-squared = 4.1193, df = 4, p-value = 0.3901
test_results[i,4] <- m1$statistic
test_results[i,5] <- m1$p.value
p <- analysis.dat %>%
filter(!is.na(Tumor_Stage), source=="16s")%>%
ggplot(aes(x=Tumor_Stage, y=Abund))+
geom_violin(scale="width", adjust=1)+
geom_jitter(alpha=0.5, width = 0.25)+
scale_y_continuous(
trans=scales::trans_new("root", root, invroot),
breaks=c(0, 0.001,0.01, 0.1, 1,10,50, 100),
labels = c(0, 0.001,0.01, 0.1, 1,10,50, 100),
limits = c(0, 110)
) +
labs(x="Tumor_Stage", y="Relative Abundance (%)",
title=paste0(TITLE_P1[1]," Bacteria Relative Abundance ",TITLE_P2[4]),
subtitle=SUBTITLE[1])+
annotate("text", x=2.5, y=90, label=paste0("p=",round(test_results$pvalue[i],4)))+
geom_segment(aes(x=1, xend=5,y=105,yend=105))+
geom_segment(aes(x=1, xend=1,y=109,yend=100))+
geom_segment(aes(x=5, xend=5,y=109,yend=100))+
theme_classic()
pWarning: Removed 127 rows containing missing values (geom_point).
ggsave("output/supplemental_figure2F_NCI_combined.pdf", p, units = "in", width = DIM[1], height = DIM[2])Warning: Removed 126 rows containing missing values (geom_point).ggsave("output/supplemental_figure2F_NCI_combined.png", p, units = "in", width = DIM[1], height = DIM[2])Warning: Removed 129 rows containing missing values (geom_point).i <- i+1
d <- analysis.dat %>%
filter(!is.na(Tumor_Stage), source=="rna")
m1<-kruskal.test(Abund ~ Tumor_Stage, data=d)
m1
    Kruskal-Wallis rank sum test

data:  Abund by Tumor_Stage
Kruskal-Wallis chi-squared = 5.8932, df = 3, p-value = 0.1169
test_results[i,4] <- m1$statistic
test_results[i,5] <- m1$p.value
p <- analysis.dat %>%
filter(source=="rna", !is.na(Tumor_Stage))%>%
ggplot(aes(x=Tumor_Stage, y=Abund))+
geom_violin(scale="width", adjust=1)+
geom_jitter(alpha=0.5, width = 0.25)+
scale_y_continuous(
trans=scales::trans_new("root", root, invroot),
breaks=c(0, 0.001,0.01, 0.1, 1,10,50, 100),
labels = c(0, 0.001,0.01, 0.1, 1,10,50, 100),
limits = c(0, 110)
) +
labs(x="Tumor_Stage", y="Relative Abundance (%)",
title=paste0(TITLE_P1[2]," Bacteria Relative Abundance ",TITLE_P2[4]),
subtitle=SUBTITLE[1])+
annotate("text", x=2.5, y=90, label=paste0("p=",round(test_results$pvalue[i],4)))+
geom_segment(aes(x=1, xend=4,y=105,yend=105))+
geom_segment(aes(x=1, xend=1,y=109,yend=100))+
geom_segment(aes(x=4, xend=4,y=109,yend=100))+
theme_classic()
pWarning: Removed 658 rows containing non-finite values (stat_ydensity).Warning: Removed 728 rows containing missing values (geom_point).
ggsave("output/supplemental_figure2F_tcga_rna_combined.pdf", p, units = "in", width = DIM[1], height = DIM[2])Warning: Removed 658 rows containing non-finite values (stat_ydensity).Warning: Removed 730 rows containing missing values (geom_point).ggsave("output/supplemental_figure2F_tcga_rna_combined.png", p, units = "in", width = DIM[1], height = DIM[2])Warning: Removed 658 rows containing non-finite values (stat_ydensity).Warning: Removed 734 rows containing missing values (geom_point).i <- i+1
d <- analysis.dat %>%
filter(!is.na(Tumor_Stage), source=="wgs")
m1<-kruskal.test(Abund ~ Tumor_Stage, data=d)
m1
    Kruskal-Wallis rank sum test

data:  Abund by Tumor_Stage
Kruskal-Wallis chi-squared = 10.886, df = 3, p-value = 0.01236
test_results[i,4] <- m1$statistic
test_results[i,5] <- m1$p.value
p <- analysis.dat %>%
filter(source=="wgs", !is.na(Tumor_Stage))%>%
ggplot(aes(x=Tumor_Stage, y=Abund))+
geom_violin(scale="width", adjust=1)+
geom_jitter(alpha=0.5, width = 0.25)+
scale_y_continuous(
trans=scales::trans_new("root", root, invroot),
breaks=c(0, 0.001,0.01, 0.1, 1,10,50, 100),
labels = c(0, 0.001,0.01, 0.1, 1,10,50, 100),
limits = c(0, 110)
) +
labs(x="Tumor_Stage", y="Relative Abundance (%)",
title=paste0(TITLE_P1[3]," Bacteria Relative Abundance ",TITLE_P2[4]),
subtitle=SUBTITLE[1])+
annotate("text", x=2.5, y=90, label=paste0("p=",round(test_results$pvalue[i],4)))+
geom_segment(aes(x=1, xend=4,y=105,yend=105))+
geom_segment(aes(x=1, xend=1,y=109,yend=100))+
geom_segment(aes(x=4, xend=4,y=109,yend=100))+
theme_classic()
pWarning: Removed 98 rows containing non-finite values (stat_ydensity).Warning: Removed 276 rows containing missing values (geom_point).
ggsave("output/supplemental_figure2F_tcga_wgs_combined.pdf", p, units = "in", width = DIM[1], height = DIM[2])Warning: Removed 98 rows containing non-finite values (stat_ydensity).Warning: Removed 282 rows containing missing values (geom_point).ggsave("output/supplemental_figure2F_tcga_wgs_combined.png", p, units = "in", width = DIM[1], height = DIM[2])Warning: Removed 98 rows containing non-finite values (stat_ydensity).Warning: Removed 295 rows containing missing values (geom_point).Subset by Bacterium
# merge datasets by subsetting to specific variables then merging
analysis.dat <- dat.16s.s %>%
  dplyr::mutate(ID = as.factor(accession.number)) %>%
  dplyr::select(OTU, sample_type, tumor, Abundance, ID, source, tumor.stage)

dat <- dat.rna.s %>%
  dplyr::mutate(Race = race) %>%
  dplyr::select(OTU, sample_type, tumor, Abundance, ID, source, tumor.stage)
analysis.dat <- full_join(analysis.dat, dat)
Joining, by = c("OTU", "sample_type", "tumor", "Abundance", "ID", "source",
"tumor.stage")dat <- dat.wgs.s %>%
dplyr::mutate(Race = race) %>%
dplyr::select(OTU, sample_type, tumor, Abundance, ID, source, tumor.stage)
analysis.dat <- full_join(analysis.dat, dat) %>%
mutate(
pres = ifelse(Abundance > 0, 1, 0),
Abund = Abundance*100,
Tumor = ifelse(tumor==1, "Tumor", "No Tumor"),
Tumor_Stage = tumor.stage
)Joining, by = c("OTU", "sample_type", "tumor", "Abundance", "ID", "source",
"tumor.stage")analysis.dat$Tumor_Stage[analysis.dat$Tumor_Stage == "1"] <- "I"
i <- i+1
d <- analysis.dat %>%
filter(!is.na(Tumor_Stage), source=="16s", OTU == "Fusobacterium nucleatum")
m1<-kruskal.test(Abund ~ Tumor_Stage, data=d)
m1
    Kruskal-Wallis rank sum test

data:  Abund by Tumor_Stage
Kruskal-Wallis chi-squared = 6.5465, df = 4, p-value = 0.1619
test_results[i,4] <- m1$statistic
test_results[i,5] <- m1$p.value
p <- analysis.dat %>%
filter(!is.na(Tumor_Stage), source=="16s", OTU == "Fusobacterium nucleatum")%>%
ggplot(aes(x=Tumor_Stage, y=Abund))+
geom_violin(scale="width", adjust=1)+
geom_jitter(alpha=0.5, width = 0.25)+
scale_y_continuous(
trans=scales::trans_new("root", root, invroot),
breaks=c(0, 0.001,0.01, 0.1, 1,10,50, 100),
labels = c(0, 0.001,0.01, 0.1, 1,10,50, 100),
limits = c(0, 110)
) +
labs(x="Tumor_Stage", y="Relative Abundance (%)",
title=paste0(TITLE_P1[1]," Bacteria Relative Abundance ",TITLE_P2[4]),
subtitle=SUBTITLE[2])+
annotate("text", x=2.5, y=90, label=paste0("p=",round(test_results$pvalue[i],4)))+
geom_segment(aes(x=1, xend=5,y=105,yend=105))+
geom_segment(aes(x=1, xend=1,y=109,yend=100))+
geom_segment(aes(x=5, xend=5,y=109,yend=100))+
theme_classic()
pWarning: Removed 46 rows containing missing values (geom_point).
ggsave("output/supplemental_figure2F_NCI_fuso.pdf", p, units = "in", width = DIM[1], height = DIM[2])Warning: Removed 46 rows containing missing values (geom_point).ggsave("output/supplemental_figure2F_NCI_fuso.png", p, units = "in", width = DIM[1], height = DIM[2])Warning: Removed 40 rows containing missing values (geom_point).i <- i+1
d <- analysis.dat %>%
filter(!is.na(Tumor_Stage), source=="rna", OTU == "Fusobacterium nucleatum")
m1<-kruskal.test(Abund ~ Tumor_Stage, data=d)
m1
    Kruskal-Wallis rank sum test

data:  Abund by Tumor_Stage
Kruskal-Wallis chi-squared = 6.1378, df = 3, p-value = 0.1051
test_results[i,4] <- m1$statistic
test_results[i,5] <- m1$p.value
p <- analysis.dat %>%
filter(!is.na(Tumor_Stage), source=="rna", OTU == "Fusobacterium nucleatum")%>%
ggplot(aes(x=Tumor_Stage, y=Abund))+
geom_violin(scale="width", adjust=1)+
geom_jitter(alpha=0.5, width = 0.25)+
scale_y_continuous(
trans=scales::trans_new("root", root, invroot),
breaks=c(0, 0.001,0.01, 0.1, 1,10,50, 100),
labels = c(0, 0.001,0.01, 0.1, 1,10,50, 100),
limits = c(0, 110)
) +
labs(x="Tumor_Stage", y="Relative Abundance (%)",
title=paste0(TITLE_P1[2]," Bacteria Relative Abundance ",TITLE_P2[4]),
subtitle=SUBTITLE[2])+
annotate("text", x=2.5, y=90, label=paste0("p=",round(test_results$pvalue[i],4)))+
geom_segment(aes(x=1, xend=4,y=105,yend=105))+
geom_segment(aes(x=1, xend=1,y=109,yend=100))+
geom_segment(aes(x=4, xend=4,y=109,yend=100))+
theme_classic()
pWarning: Removed 94 rows containing non-finite values (stat_ydensity).Warning: Removed 97 rows containing missing values (geom_point).
ggsave("output/supplemental_figure2F_tcga_rna_fuso.pdf", p, units = "in", width = DIM[1], height = DIM[2])Warning: Removed 94 rows containing non-finite values (stat_ydensity).
Removed 97 rows containing missing values (geom_point).ggsave("output/supplemental_figure2F_tcga_rna_fuso.png", p, units = "in", width = DIM[1], height = DIM[2])Warning: Removed 94 rows containing non-finite values (stat_ydensity).Warning: Removed 96 rows containing missing values (geom_point).i <- i+1
d <- analysis.dat %>%
filter(!is.na(Tumor_Stage), source=="wgs", OTU == "Fusobacterium nucleatum")
m1<-kruskal.test(Abund ~ Tumor_Stage, data=d)
m1
    Kruskal-Wallis rank sum test

data:  Abund by Tumor_Stage
Kruskal-Wallis chi-squared = 5.2948, df = 3, p-value = 0.1514
test_results[i,4] <- m1$statistic
test_results[i,5] <- m1$p.value
p <- analysis.dat %>%
filter(!is.na(Tumor_Stage), source=="wgs", OTU == "Fusobacterium nucleatum")%>%
ggplot(aes(x=Tumor_Stage, y=Abund))+
geom_violin(scale="width", adjust=1)+
geom_jitter(alpha=0.5, width = 0.25)+
scale_y_continuous(
trans=scales::trans_new("root", root, invroot),
breaks=c(0, 0.001,0.01, 0.1, 1,10,50, 100),
labels = c(0, 0.001,0.01, 0.1, 1,10,50, 100),
limits = c(0, 110)
) +
labs(x="Tumor_Stage", y="Relative Abundance (%)",
title=paste0(TITLE_P1[3]," Bacteria Relative Abundance ",TITLE_P2[4]),
subtitle=SUBTITLE[2])+
annotate("text", x=2.5, y=90, label=paste0("p=",round(test_results$pvalue[i],4)))+
geom_segment(aes(x=1, xend=4,y=105,yend=105))+
geom_segment(aes(x=1, xend=1,y=109,yend=100))+
geom_segment(aes(x=4, xend=4,y=109,yend=100))+
theme_classic()
pWarning: Removed 14 rows containing non-finite values (stat_ydensity).Warning: Removed 38 rows containing missing values (geom_point).
ggsave("output/supplemental_figure2F_tcga_wgs_fuso.pdf", p, units = "in", width = DIM[1], height = DIM[2])Warning: Removed 14 rows containing non-finite values (stat_ydensity).Warning: Removed 35 rows containing missing values (geom_point).ggsave("output/supplemental_figure2F_tcga_wgs_fuso.png", p, units = "in", width = DIM[1], height = DIM[2])Warning: Removed 14 rows containing non-finite values (stat_ydensity).Warning: Removed 36 rows containing missing values (geom_point).i <- i+1
d <- analysis.dat %>%
filter(!is.na(Tumor_Stage), source=="16s", OTU == "Prevotella melaninogenica" | OTU =="Prevotella spp.")
m1<-kruskal.test(Abund ~ Tumor_Stage, data=d)
m1
    Kruskal-Wallis rank sum test

data:  Abund by Tumor_Stage
Kruskal-Wallis chi-squared = 2.7637, df = 4, p-value = 0.5981
test_results[i,4] <- m1$statistic
test_results[i,5] <- m1$p.value
p <- analysis.dat %>%
filter(!is.na(Tumor_Stage), source=="16s", OTU == "Prevotella melaninogenica" | OTU =="Prevotella spp.")%>%
ggplot(aes(x=Tumor_Stage, y=Abund))+
geom_violin(scale="width", adjust=1)+
geom_jitter(alpha=0.5, width = 0.25)+
scale_y_continuous(
trans=scales::trans_new("root", root, invroot),
breaks=c(0, 0.001,0.01, 0.1, 1,10,50, 100),
labels = c(0, 0.001,0.01, 0.1, 1,10,50, 100),
limits = c(0, 110)
) +
labs(x="Tumor_Stage", y="Relative Abundance (%)",
title=paste0(TITLE_P1[1]," Bacteria Relative Abundance ",TITLE_P2[4]),
subtitle=SUBTITLE[3])+
annotate("text", x=2.5, y=90, label=paste0("p=",round(test_results$pvalue[i],4)))+
geom_segment(aes(x=1, xend=5,y=105,yend=105))+
geom_segment(aes(x=1, xend=1,y=109,yend=100))+
geom_segment(aes(x=5, xend=5,y=109,yend=100))+
theme_classic()
pWarning: Removed 20 rows containing missing values (geom_point).
ggsave("output/supplemental_figure2F_NCI_prevo.pdf", p, units = "in", width = DIM[1], height = DIM[2])Warning: Removed 18 rows containing missing values (geom_point).ggsave("output/supplemental_figure2F_NCI_prevo.png", p, units = "in", width = DIM[1], height = DIM[2])Warning: Removed 14 rows containing missing values (geom_point).i <- i+1
d <- analysis.dat %>%
filter(!is.na(Tumor_Stage), source=="rna", OTU == "Prevotella melaninogenica")
m1<-kruskal.test(Abund ~ Tumor_Stage, data=d)
m1
    Kruskal-Wallis rank sum test

data:  Abund by Tumor_Stage
Kruskal-Wallis chi-squared = 9.3195, df = 3, p-value = 0.02533
test_results[i,4] <- m1$statistic
test_results[i,5] <- m1$p.value
p <- analysis.dat %>%
filter(!is.na(Tumor_Stage), source=="rna", OTU == "Prevotella melaninogenica")%>%
ggplot(aes(x=Tumor_Stage, y=Abund))+
geom_violin(scale="width", adjust=1)+
geom_jitter(alpha=0.5, width = 0.25)+
scale_y_continuous(
trans=scales::trans_new("root", root, invroot),
breaks=c(0, 0.001,0.01, 0.1, 1,10,50, 100),
labels = c(0, 0.001,0.01, 0.1, 1,10,50, 100),
limits = c(0, 110)
) +
labs(x="Tumor_Stage", y="Relative Abundance (%)",
title=paste0(TITLE_P1[2]," Bacteria Relative Abundance ",TITLE_P2[4]),
subtitle=SUBTITLE[3])+
annotate("text", x=2.5, y=90, label=paste0("p=",round(test_results$pvalue[i],4)))+
geom_segment(aes(x=1, xend=4,y=105,yend=105))+
geom_segment(aes(x=1, xend=1,y=109,yend=100))+
geom_segment(aes(x=4, xend=4,y=109,yend=100))+
theme_classic()
pWarning: Removed 94 rows containing non-finite values (stat_ydensity).Warning: Removed 97 rows containing missing values (geom_point).
ggsave("output/supplemental_figure2F_tcga_rna_prevo.pdf", p, units = "in", width = DIM[1], height = DIM[2])Warning: Removed 94 rows containing non-finite values (stat_ydensity).Warning: Removed 96 rows containing missing values (geom_point).ggsave("output/supplemental_figure2F_tcga_rna_prevo.png", p, units = "in", width = DIM[1], height = DIM[2])Warning: Removed 94 rows containing non-finite values (stat_ydensity).Warning: Removed 97 rows containing missing values (geom_point).i <- i+1
d <- analysis.dat %>%
filter(!is.na(Tumor_Stage), source=="wgs", OTU == "Prevotella melaninogenica")
m1<-kruskal.test(Abund ~ Tumor_Stage, data=d)
m1
Kruskal-Wallis rank sum test
data: Abund by Tumor_Stage
Kruskal-Wallis chi-squared = 2.5034, df = 3, p-value = 0.4747test_results[i,4] <- m1$statistic
test_results[i,5] <- m1$p.value
p <- analysis.dat %>%
filter(!is.na(Tumor_Stage), source=="wgs", OTU == "Prevotella melaninogenica")%>%
ggplot(aes(x=Tumor_Stage, y=Abund))+
geom_violin(scale="width", adjust=1)+
geom_jitter(alpha=0.5, width = 0.25)+
scale_y_continuous(
trans=scales::trans_new("root", root, invroot),
breaks=c(0, 0.001,0.01, 0.1, 1,10,50, 100),
labels = c(0, 0.001,0.01, 0.1, 1,10,50, 100),
limits = c(0, 110)
) +
labs(x="Tumor_Stage", y="Relative Abundance (%)",
title=paste0(TITLE_P1[3]," Bacteria Relative Abundance ",TITLE_P2[4]),
subtitle=SUBTITLE[3])+
annotate("text", x=2.5, y=90, label=paste0("p=",round(test_results$pvalue[i],4)))+
geom_segment(aes(x=1, xend=4,y=105,yend=105))+
geom_segment(aes(x=1, xend=1,y=109,yend=100))+
geom_segment(aes(x=4, xend=4,y=109,yend=100))+
theme_classic()
pWarning: Removed 14 rows containing non-finite values (stat_ydensity).Warning: Removed 31 rows containing missing values (geom_point).
ggsave("output/supplemental_figure2F_tcga_wgs_prevo.pdf", p, units = "in", width = DIM[1], height = DIM[2])Warning: Removed 14 rows containing non-finite values (stat_ydensity).Warning: Removed 29 rows containing missing values (geom_point).ggsave("output/supplemental_figure2F_tcga_wgs_prevo.png", p, units = "in", width = DIM[1], height = DIM[2])Warning: Removed 14 rows containing non-finite values (stat_ydensity).Warning: Removed 34 rows containing missing values (geom_point).i <- i+1
d <- analysis.dat %>%
filter(!is.na(Tumor_Stage), source=="16s", OTU == "Campylobacter concisus")
m1<-kruskal.test(Abund ~ Tumor_Stage, data=d)
m1
Kruskal-Wallis rank sum test
data: Abund by Tumor_Stage
Kruskal-Wallis chi-squared = 4.8348, df = 4, p-value = 0.3047test_results[i,4] <- m1$statistic
test_results[i,5] <- m1$p.value
p <- analysis.dat %>%
filter(!is.na(Tumor_Stage), source=="16s", OTU == "Campylobacter concisus")%>%
ggplot(aes(x=Tumor_Stage, y=Abund))+
geom_violin(scale="width", adjust=1)+
geom_jitter(alpha=0.5, width = 0.25)+
scale_y_continuous(
trans=scales::trans_new("root", root, invroot),
breaks=c(0, 0.001,0.01, 0.1, 1,10,50, 100),
labels = c(0, 0.001,0.01, 0.1, 1,10,50, 100),
limits = c(0, 110)
) +
labs(x="Tumor_Stage", y="Relative Abundance (%)",
title=paste0(TITLE_P1[1]," Bacteria Relative Abundance ",TITLE_P2[4]),
subtitle=SUBTITLE[4])+
annotate("text", x=2.5, y=90, label=paste0("p=",round(test_results$pvalue[i],4)))+
geom_segment(aes(x=1, xend=5,y=105,yend=105))+
geom_segment(aes(x=1, xend=1,y=109,yend=100))+
geom_segment(aes(x=5, xend=5,y=109,yend=100))+
theme_classic()
pWarning: Removed 66 rows containing missing values (geom_point).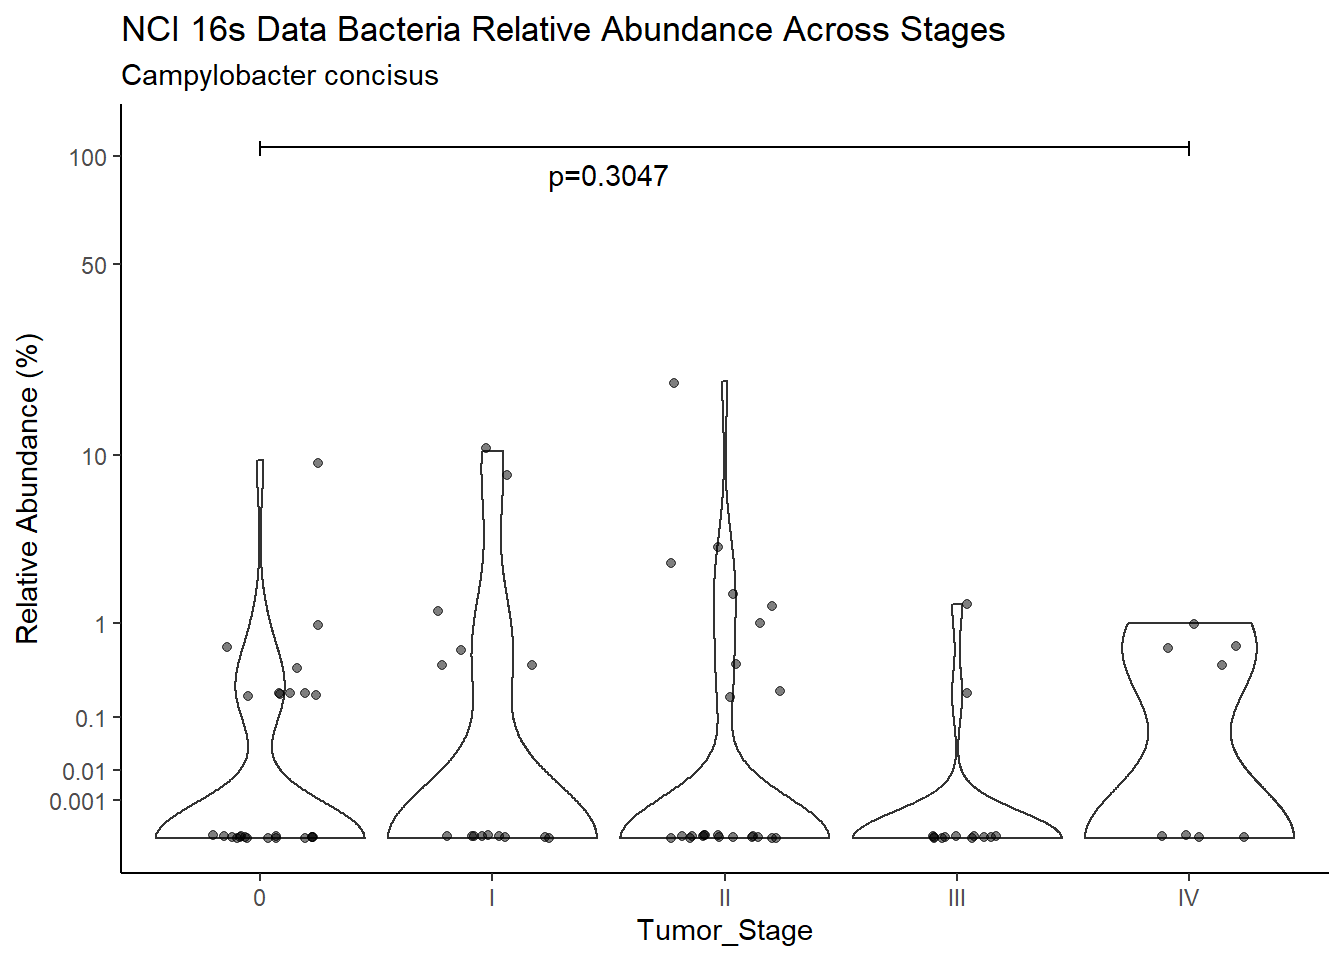
ggsave("output/supplemental_figure2F_NCI_campy.pdf", p, units = "in", width = DIM[1], height = DIM[2])Warning: Removed 57 rows containing missing values (geom_point).ggsave("output/supplemental_figure2F_NCI_campy.png", p, units = "in", width = DIM[1], height = DIM[2])Warning: Removed 66 rows containing missing values (geom_point).i <- i+1
d <- analysis.dat %>%
filter(!is.na(Tumor_Stage), source=="rna", OTU == "Campylobacter concisus")
m1<-kruskal.test(Abund ~ Tumor_Stage, data=d)
m1
Kruskal-Wallis rank sum test
data: Abund by Tumor_Stage
Kruskal-Wallis chi-squared = 2.5152, df = 3, p-value = 0.4725test_results[i,4] <- m1$statistic
test_results[i,5] <- m1$p.value
p <- analysis.dat %>%
filter(!is.na(Tumor_Stage), source=="rna", OTU == "Campylobacter concisus")%>%
ggplot(aes(x=Tumor_Stage, y=Abund))+
geom_violin(scale="width", adjust=1)+
geom_jitter(alpha=0.5, width = 0.25)+
scale_y_continuous(
trans=scales::trans_new("root", root, invroot),
breaks=c(0, 0.001,0.01, 0.1, 1,10,50, 100),
labels = c(0, 0.001,0.01, 0.1, 1,10,50, 100),
limits = c(0, 110)
) +
labs(x="Tumor_Stage", y="Relative Abundance (%)",
title=paste0(TITLE_P1[2]," Bacteria Relative Abundance ",TITLE_P2[4]),
subtitle=SUBTITLE[4])+
annotate("text", x=2.5, y=90, label=paste0("p=",round(test_results$pvalue[i],4)))+
geom_segment(aes(x=1, xend=4,y=105,yend=105))+
geom_segment(aes(x=1, xend=1,y=109,yend=100))+
geom_segment(aes(x=4, xend=4,y=109,yend=100))+
theme_classic()
pWarning: Removed 94 rows containing non-finite values (stat_ydensity).Warning: Removed 112 rows containing missing values (geom_point).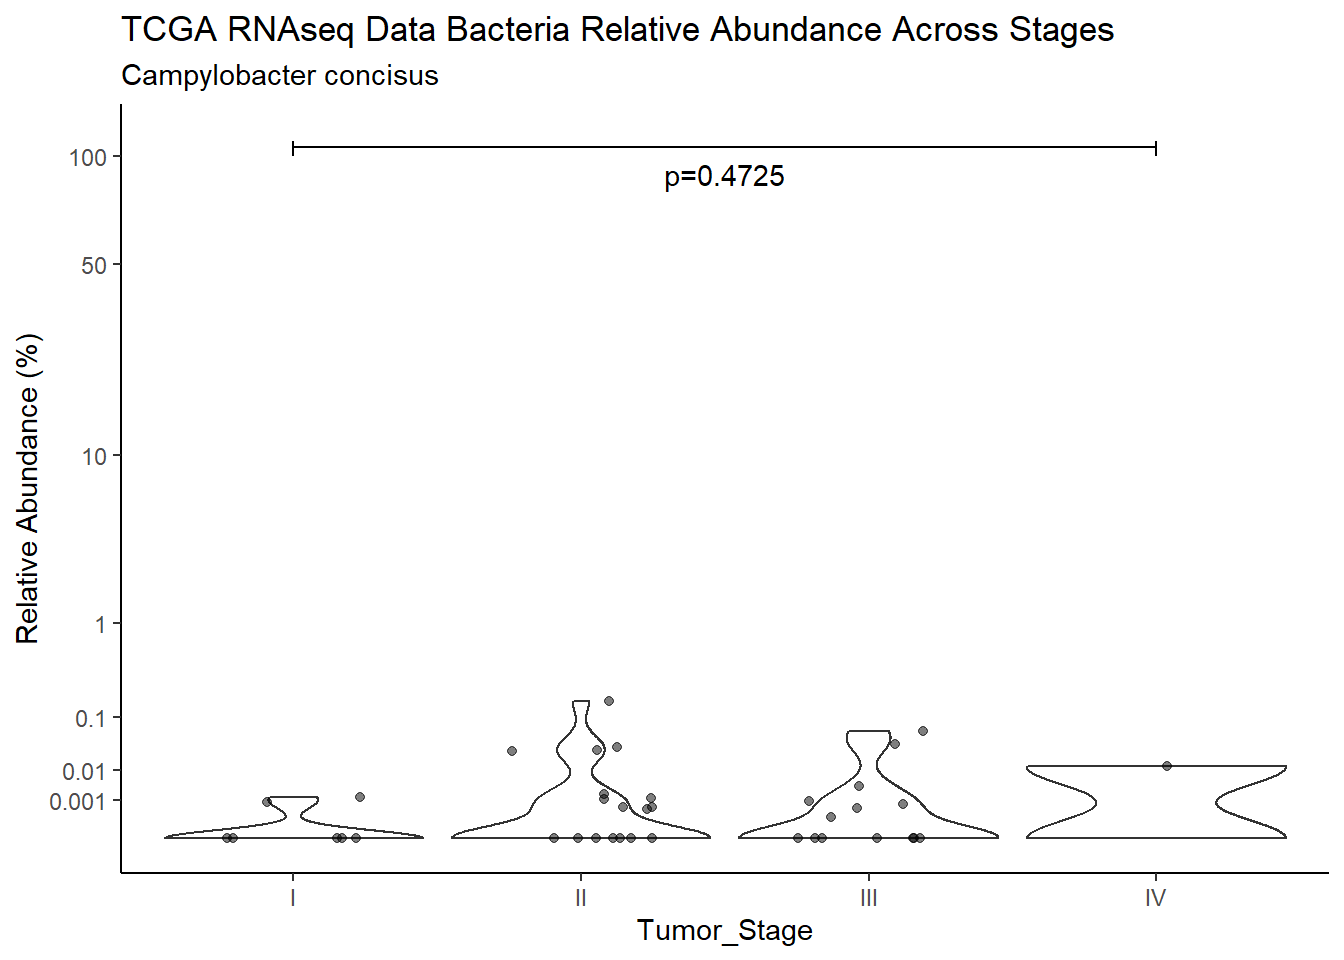
ggsave("output/supplemental_figure2F_tcga_rna_campy.pdf", p, units = "in", width = DIM[1], height = DIM[2])Warning: Removed 94 rows containing non-finite values (stat_ydensity).Warning: Removed 118 rows containing missing values (geom_point).ggsave("output/supplemental_figure2F_tcga_rna_campy.png", p, units = "in", width = DIM[1], height = DIM[2])Warning: Removed 94 rows containing non-finite values (stat_ydensity).Warning: Removed 103 rows containing missing values (geom_point).i <- i+1
d <- analysis.dat %>%
filter(!is.na(Tumor_Stage), source=="wgs", OTU == "Campylobacter concisus")
m1<-kruskal.test(Abund ~ Tumor_Stage, data=d)
m1
Kruskal-Wallis rank sum test
data: Abund by Tumor_Stage
Kruskal-Wallis chi-squared = 1.014, df = 3, p-value = 0.7979test_results[i,4] <- m1$statistic
test_results[i,5] <- m1$p.value
p <- analysis.dat %>%
filter(!is.na(Tumor_Stage), source=="wgs", OTU == "Campylobacter concisus")%>%
ggplot(aes(x=Tumor_Stage, y=Abund))+
geom_violin(scale="width", adjust=1)+
geom_jitter(alpha=0.5, width = 0.25)+
scale_y_continuous(
trans=scales::trans_new("root", root, invroot),
breaks=c(0, 0.001,0.01, 0.1, 1,10,50, 100),
labels = c(0, 0.001,0.01, 0.1, 1,10,50, 100),
limits = c(0, 110)
) +
labs(x="Tumor_Stage", y="Relative Abundance (%)",
title=paste0(TITLE_P1[3]," Bacteria Relative Abundance ",TITLE_P2[4]),
subtitle=SUBTITLE[4])+
annotate("text", x=2.5, y=90, label=paste0("p=",round(test_results$pvalue[i],4)))+
geom_segment(aes(x=1, xend=4,y=105,yend=105))+
geom_segment(aes(x=1, xend=1,y=109,yend=100))+
geom_segment(aes(x=4, xend=4,y=109,yend=100))+
theme_classic()
pWarning: Removed 14 rows containing non-finite values (stat_ydensity).Warning: Removed 39 rows containing missing values (geom_point).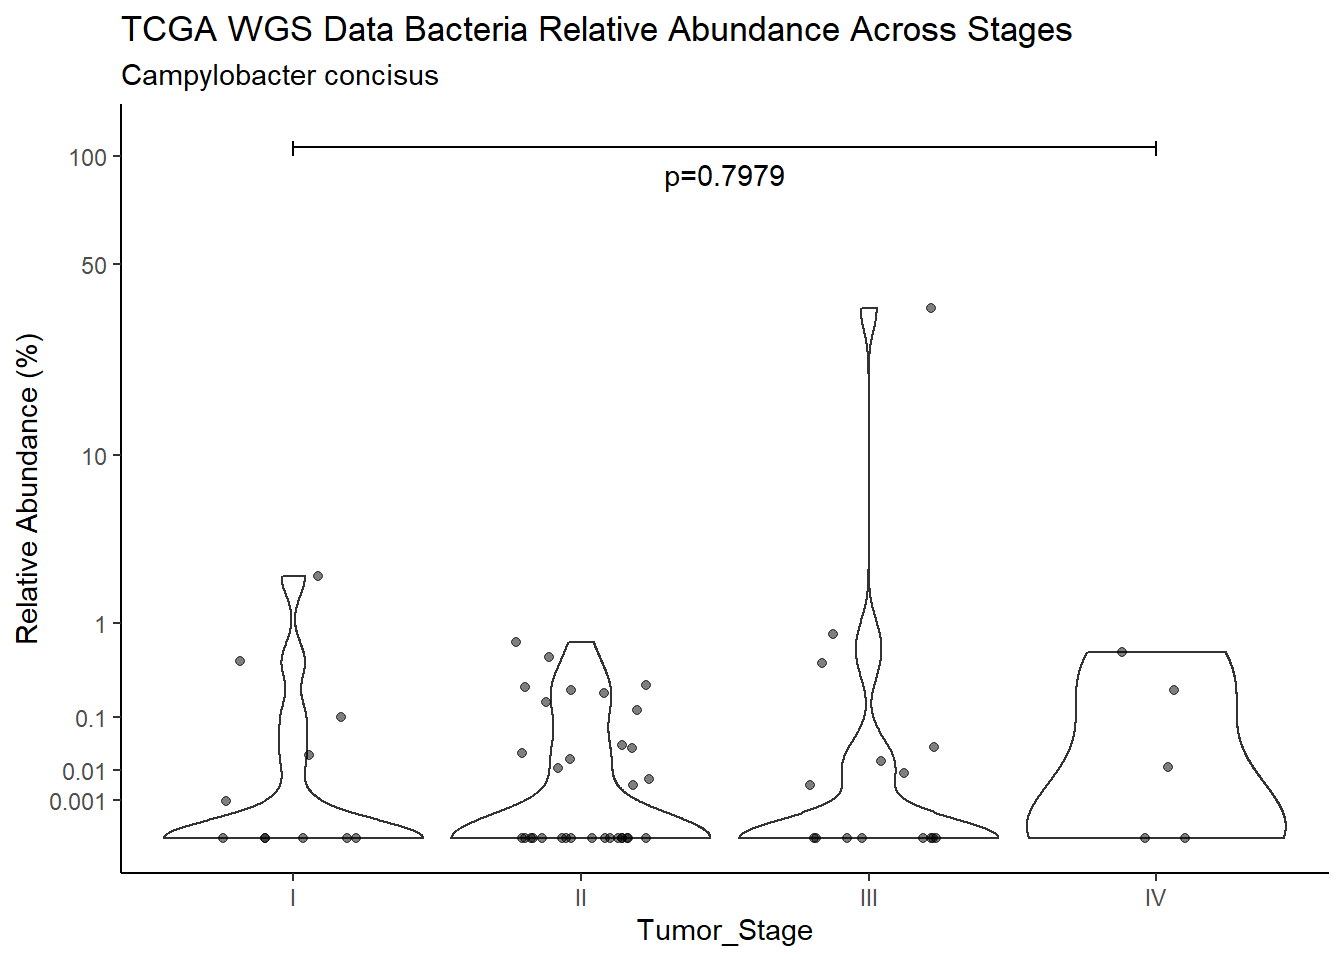
ggsave("output/supplemental_figure2F_tcga_wgs_campy.pdf", p, units = "in", width = DIM[1], height = DIM[2])Warning: Removed 14 rows containing non-finite values (stat_ydensity).Warning: Removed 41 rows containing missing values (geom_point).ggsave("output/supplemental_figure2F_tcga_wgs_campy.png", p, units = "in", width = DIM[1], height = DIM[2])Warning: Removed 14 rows containing non-finite values (stat_ydensity).Warning: Removed 48 rows containing missing values (geom_point).i <- i+1
d <- analysis.dat %>%
filter(!is.na(Tumor_Stage), source=="16s", OTU == "Streptococcus sanguinis")
m1<-kruskal.test(Abund ~ Tumor_Stage, data=d)
m1
Kruskal-Wallis rank sum test
data: Abund by Tumor_Stage
Kruskal-Wallis chi-squared = 5.9573, df = 4, p-value = 0.2024test_results[i,4] <- m1$statistic
test_results[i,5] <- m1$p.value
p <- analysis.dat %>%
filter(!is.na(Tumor_Stage), source=="16s", OTU == "Streptococcus sanguinis")%>%
ggplot(aes(x=Tumor_Stage, y=Abund))+
geom_violin(scale="width", adjust=1)+
geom_jitter(alpha=0.5, width = 0.25)+
scale_y_continuous(
trans=scales::trans_new("root", root, invroot),
breaks=c(0, 0.001,0.01, 0.1, 1,10,50, 100),
labels = c(0, 0.001,0.01, 0.1, 1,10,50, 100),
limits = c(0, 110)
) +
labs(x="Tumor_Stage", y="Relative Abundance (%)",
title=paste0(TITLE_P1[1]," Bacteria Relative Abundance ",TITLE_P2[4]),
subtitle=SUBTITLE[5])+
annotate("text", x=2.5, y=90, label=paste0("p=",round(test_results$pvalue[i],4)))+
geom_segment(aes(x=1, xend=5,y=105,yend=105))+
geom_segment(aes(x=1, xend=1,y=109,yend=100))+
geom_segment(aes(x=5, xend=5,y=109,yend=100))+
theme_classic()
pWarning: Removed 6 rows containing missing values (geom_point).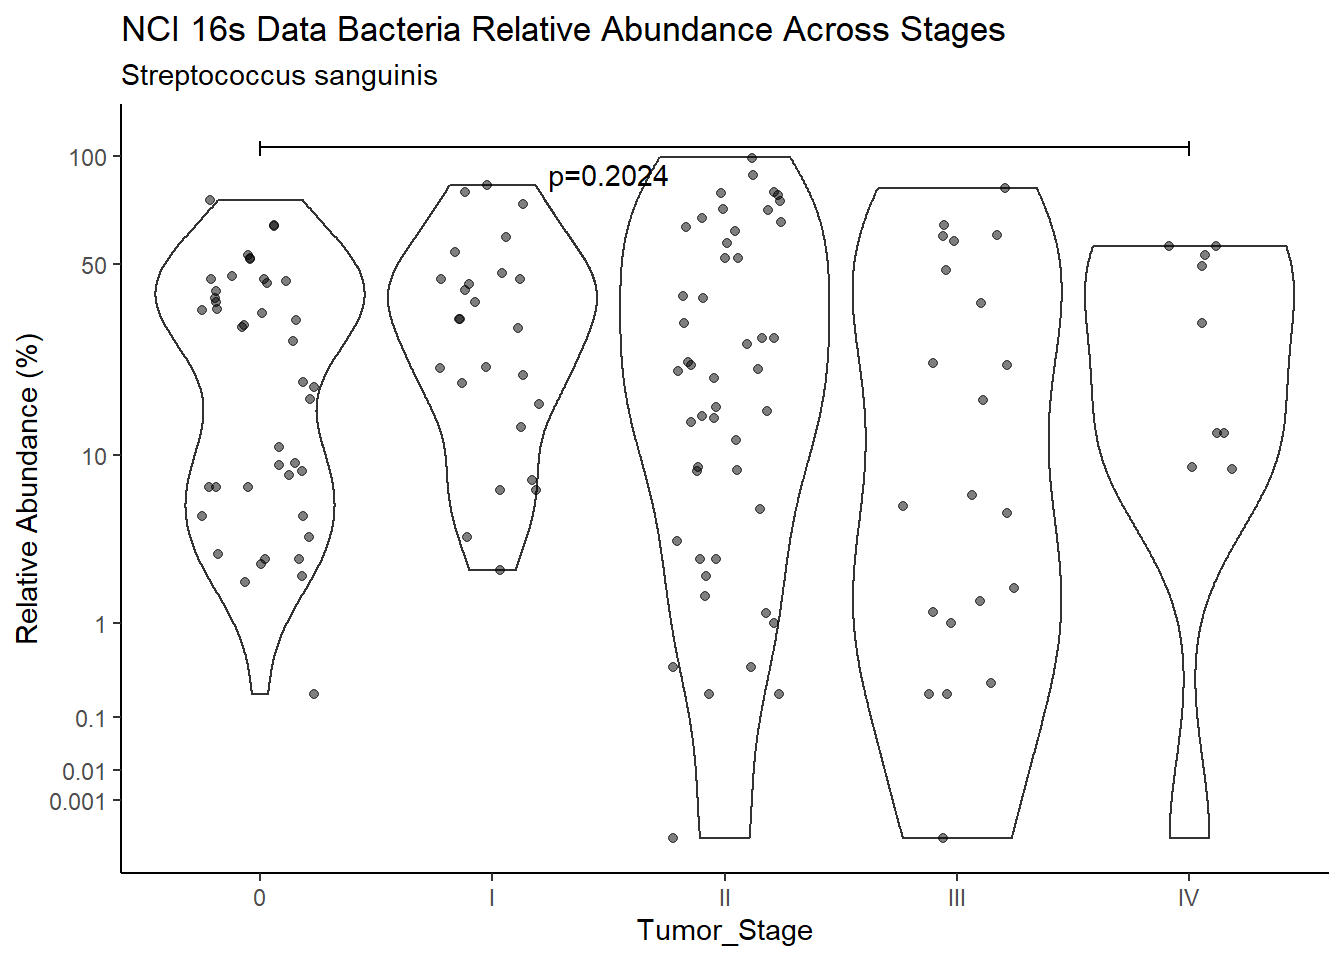
ggsave("output/supplemental_figure2F_NCI_strepto.pdf", p, units = "in", width = DIM[1], height = DIM[2])Warning: Removed 4 rows containing missing values (geom_point).ggsave("output/supplemental_figure2F_NCI_strepto.png", p, units = "in", width = DIM[1], height = DIM[2])Warning: Removed 4 rows containing missing values (geom_point).i <- i+1
d <- analysis.dat %>%
filter(!is.na(Tumor_Stage), source=="rna", OTU == "Streptococcus sanguinis")
m1<-kruskal.test(Abund ~ Tumor_Stage, data=d)
m1
Kruskal-Wallis rank sum test
data: Abund by Tumor_Stage
Kruskal-Wallis chi-squared = 5.817, df = 3, p-value = 0.1209test_results[i,4] <- m1$statistic
test_results[i,5] <- m1$p.value
p <- analysis.dat %>%
filter(!is.na(Tumor_Stage), source=="rna", OTU == "Streptococcus sanguinis")%>%
ggplot(aes(x=Tumor_Stage, y=Abund))+
geom_violin(scale="width", adjust=1)+
geom_jitter(alpha=0.5, width = 0.25)+
scale_y_continuous(
trans=scales::trans_new("root", root, invroot),
breaks=c(0, 0.001,0.01, 0.1, 1,10,50, 100),
labels = c(0, 0.001,0.01, 0.1, 1,10,50, 100),
limits = c(0, 110)
) +
labs(x="Tumor_Stage", y="Relative Abundance (%)",
title=paste0(TITLE_P1[2]," Bacteria Relative Abundance ",TITLE_P2[4]),
subtitle=SUBTITLE[5])+
annotate("text", x=2.5, y=90, label=paste0("p=",round(test_results$pvalue[i],4)))+
geom_segment(aes(x=1, xend=4,y=105,yend=105))+
geom_segment(aes(x=1, xend=1,y=109,yend=100))+
geom_segment(aes(x=4, xend=4,y=109,yend=100))+
theme_classic()
pWarning: Removed 94 rows containing non-finite values (stat_ydensity).Warning: Removed 97 rows containing missing values (geom_point).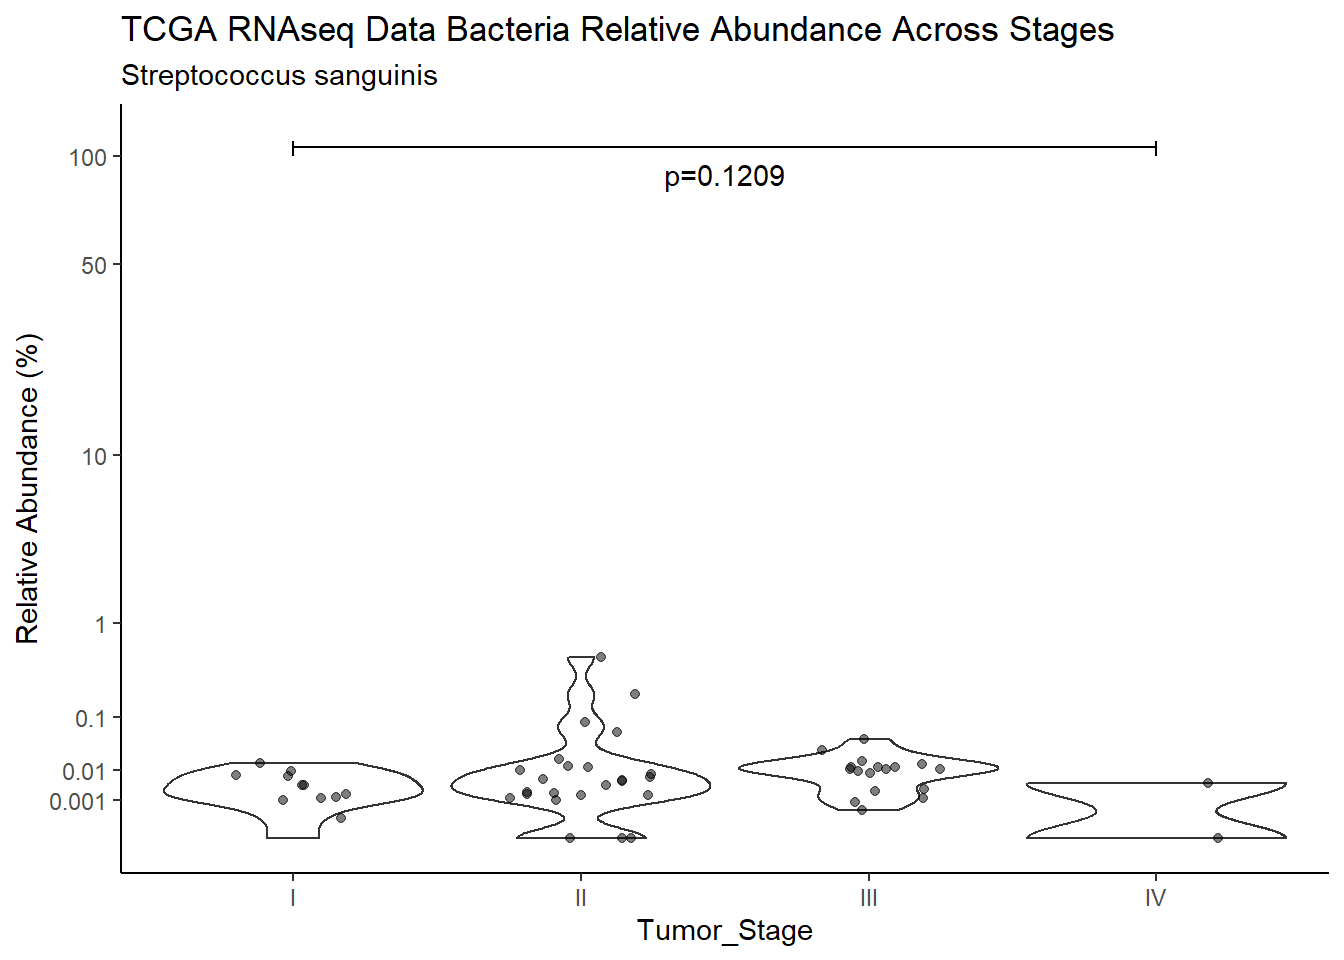
ggsave("output/supplemental_figure2F_tcga_rna_strepto.pdf", p, units = "in", width = DIM[1], height = DIM[2])Warning: Removed 94 rows containing non-finite values (stat_ydensity).Warning: Removed 96 rows containing missing values (geom_point).ggsave("output/supplemental_figure2F_tcga_rna_strepto.png", p, units = "in", width = DIM[1], height = DIM[2])Warning: Removed 94 rows containing non-finite values (stat_ydensity).
Removed 96 rows containing missing values (geom_point).i <- i+1
d <- analysis.dat %>%
filter(!is.na(Tumor_Stage), source=="wgs", OTU == "Streptococcus sanguinis")
m1<-kruskal.test(Abund ~ Tumor_Stage, data=d)
m1
Kruskal-Wallis rank sum test
data: Abund by Tumor_Stage
Kruskal-Wallis chi-squared = 2.9396, df = 3, p-value = 0.401test_results[i,4] <- m1$statistic
test_results[i,5] <- m1$p.value
p <- analysis.dat %>%
filter(!is.na(Tumor_Stage), source=="wgs", OTU == "Streptococcus sanguinis")%>%
ggplot(aes(x=Tumor_Stage, y=Abund))+
geom_violin(scale="width", adjust=1)+
geom_jitter(alpha=0.5, width = 0.25)+
scale_y_continuous(
trans=scales::trans_new("root", root, invroot),
breaks=c(0, 0.001,0.01, 0.1, 1,10,50, 100),
labels = c(0, 0.001,0.01, 0.1, 1,10,50, 100),
limits = c(0, 110)
) +
labs(x="Tumor_Stage", y="Relative Abundance (%)",
title=paste0(TITLE_P1[3]," Bacteria Relative Abundance ",TITLE_P2[4]),
subtitle=SUBTITLE[5])+
annotate("text", x=2.5, y=90, label=paste0("p=",round(test_results$pvalue[i],4)))+
geom_segment(aes(x=1, xend=4,y=105,yend=105))+
geom_segment(aes(x=1, xend=1,y=109,yend=100))+
geom_segment(aes(x=4, xend=4,y=109,yend=100))+
theme_classic()
pWarning: Removed 14 rows containing non-finite values (stat_ydensity).Warning: Removed 45 rows containing missing values (geom_point).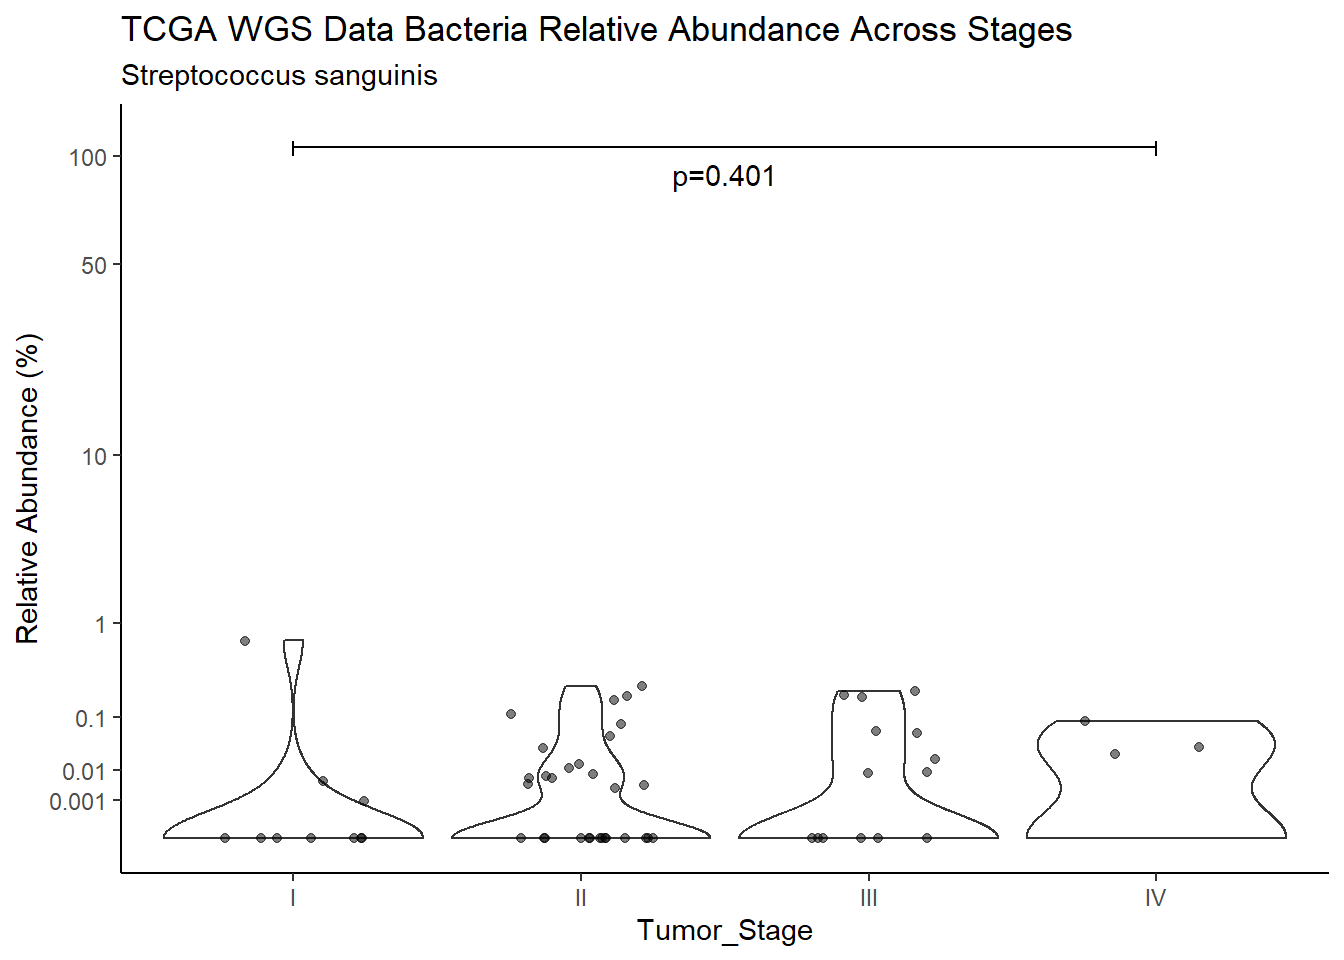
ggsave("output/supplemental_figure2F_tcga_wgs_strepto.pdf", p, units = "in", width = DIM[1], height = DIM[2])Warning: Removed 14 rows containing non-finite values (stat_ydensity).Warning: Removed 42 rows containing missing values (geom_point).ggsave("output/supplemental_figure2F_tcga_wgs_strepto.png", p, units = "in", width = DIM[1], height = DIM[2])Warning: Removed 14 rows containing non-finite values (stat_ydensity).Warning: Removed 45 rows containing missing values (geom_point).Statistical Significance
test_results$sig <- ""
for(i in 1:nrow(test_results)){
test_results[i,6] <- ifelse(test_results[i,5] < .05, "*", "")
}
kable(test_results, digits=4, format="html")%>%
kable_styling(full_width = T) %>%
scroll_box(width="100%", height="600px")| Data | Bacteria | Outcome | est | pvalue | sig |
|---|---|---|---|---|---|
| NCI 16s Data | Combined across bacteria | Between Barretts Status | 0.0000 | 0.7934 | |
| TCGA RNAseq Data | Combined across bacteria | Between Barretts Status | 0.0000 | 0.0424 |
|
| TCGA WGS Data | Combined across bacteria | Between Barretts Status | 0.0000 | 0.0372 |
|
| NCI 16s Data | Fusobacterium nucleatum | Between Barretts Status | 0.0000 | 0.9471 | |
| TCGA RNAseq Data | Fusobacterium nucleatum | Between Barretts Status | 0.0010 | 0.3695 | |
| TCGA WGS Data | Fusobacterium nucleatum | Between Barretts Status | 0.0000 | 0.5109 | |
| NCI 16s Data | Prevotella melaninogenica | Between Barretts Status | 0.0001 | 0.9859 | |
| TCGA RNAseq Data | Prevotella melaninogenica | Between Barretts Status | 0.0037 | 0.1500 | |
| TCGA WGS Data | Prevotella melaninogenica | Between Barretts Status | 0.0363 | 0.1088 | |
| NCI 16s Data | Campylobacter concisus | Between Barretts Status | 0.0000 | 0.6722 | |
| TCGA RNAseq Data | Campylobacter concisus | Between Barretts Status | 0.0000 | 0.1411 | |
| TCGA WGS Data | Campylobacter concisus | Between Barretts Status | 0.0000 | 0.5648 | |
| NCI 16s Data | Streptococcus sanguinis | Between Barretts Status | 3.4000 | 0.2285 | |
| TCGA RNAseq Data | Streptococcus sanguinis | Between Barretts Status | 0.0011 | 0.6267 | |
| TCGA WGS Data | Streptococcus sanguinis | Between Barretts Status | 0.0000 | 0.9064 | |
| NCI 16s Data | Combined across bacteria | Between Gender | 0.0000 | 0.6573 | |
| TCGA RNAseq Data | Combined across bacteria | Between Gender | 0.0000 | 0.1944 | |
| TCGA WGS Data | Combined across bacteria | Between Gender | 0.0000 | 0.0022 |
|
| NCI 16s Data | Fusobacterium nucleatum | Between Gender | 0.0000 | 0.9138 | |
| TCGA RNAseq Data | Fusobacterium nucleatum | Between Gender | 0.0030 | 0.2027 | |
| TCGA WGS Data | Fusobacterium nucleatum | Between Gender | 0.1363 | 0.0180 |
|
| NCI 16s Data | Prevotella melaninogenica | Between Gender | 0.6000 | 0.1379 | |
| TCGA RNAseq Data | Prevotella melaninogenica | Between Gender | -0.0001 | 0.9314 | |
| TCGA WGS Data | Prevotella melaninogenica | Between Gender | 0.3345 | 0.1339 | |
| NCI 16s Data | Campylobacter concisus | Between Gender | -0.0001 | 0.8834 | |
| TCGA RNAseq Data | Campylobacter concisus | Between Gender | 0.0000 | 0.8239 | |
| TCGA WGS Data | Campylobacter concisus | Between Gender | 0.0009 | 0.0062 |
|
| NCI 16s Data | Streptococcus sanguinis | Between Gender | -0.8000 | 0.7902 | |
| TCGA RNAseq Data | Streptococcus sanguinis | Between Gender | 0.0003 | 0.8497 | |
| TCGA WGS Data | Streptococcus sanguinis | Between Gender | 0.0000 | 0.9169 | |
| NCI 16s Data | Combined across bacteria | Across Races | 0.0000 | 0.8229 | |
| TCGA RNAseq Data | Combined across bacteria | Across Races | 0.0851 | 0.0027 |
|
| TCGA WGS Data | Combined across bacteria | Across Races | 0.0000 | 0.0740 | |
| NCI 16s Data | Fusobacterium nucleatum | Across Races | 0.0000 | 0.9862 | |
| TCGA RNAseq Data | Fusobacterium nucleatum | Across Races | 4.5151 | 0.1391 | |
| TCGA WGS Data | Fusobacterium nucleatum | Across Races | 0.0443 | 0.6489 | |
| NCI 16s Data | Prevotella melaninogenica | Across Races | 0.0000 | 0.6960 | |
| TCGA RNAseq Data | Prevotella melaninogenica | Across Races | 0.7877 | 0.1178 | |
| TCGA WGS Data | Prevotella melaninogenica | Across Races | 0.0001 | 1.0000 | |
| NCI 16s Data | Campylobacter concisus | Across Races | 0.0000 | 0.4462 | |
| TCGA RNAseq Data | Campylobacter concisus | Across Races | 0.0320 | 0.0644 | |
| TCGA WGS Data | Campylobacter concisus | Across Races | 0.0000 | 0.9358 | |
| NCI 16s Data | Streptococcus sanguinis | Across Races | -2.5520 | 0.5540 | |
| TCGA RNAseq Data | Streptococcus sanguinis | Across Races | -0.0032 | 0.5260 | |
| TCGA WGS Data | Streptococcus sanguinis | Across Races | 0.0083 | 0.1514 | |
| NCI 16s Data | Combined across bacteria | Across Stages | 4.1193 | 0.3901 | |
| TCGA RNAseq Data | Combined across bacteria | Across Stages | 5.8932 | 0.1169 | |
| TCGA WGS Data | Combined across bacteria | Across Stages | 10.8856 | 0.0124 |
|
| NCI 16s Data | Fusobacterium nucleatum | Across Stages | 6.5465 | 0.1619 | |
| TCGA RNAseq Data | Fusobacterium nucleatum | Across Stages | 6.1378 | 0.1051 | |
| TCGA WGS Data | Fusobacterium nucleatum | Across Stages | 5.2948 | 0.1514 | |
| NCI 16s Data | Prevotella melaninogenica | Across Stages | 2.7637 | 0.5981 | |
| TCGA RNAseq Data | Prevotella melaninogenica | Across Stages | 9.3195 | 0.0253 |
|
| TCGA WGS Data | Prevotella melaninogenica | Across Stages | 2.5034 | 0.4747 | |
| NCI 16s Data | Campylobacter concisus | Across Stages | 4.8348 | 0.3047 | |
| TCGA RNAseq Data | Campylobacter concisus | Across Stages | 2.5152 | 0.4725 | |
| TCGA WGS Data | Campylobacter concisus | Across Stages | 1.0140 | 0.7979 | |
| NCI 16s Data | Streptococcus sanguinis | Across Stages | 5.9573 | 0.2024 | |
| TCGA RNAseq Data | Streptococcus sanguinis | Across Stages | 5.8170 | 0.1209 | |
| TCGA WGS Data | Streptococcus sanguinis | Across Stages | 2.9396 | 0.4010 |
sessionInfo()R version 4.2.0 (2022-04-22 ucrt)
Platform: x86_64-w64-mingw32/x64 (64-bit)
Running under: Windows 10 x64 (build 22000)
Matrix products: default
locale:
[1] LC_COLLATE=English_United States.utf8
[2] LC_CTYPE=English_United States.utf8
[3] LC_MONETARY=English_United States.utf8
[4] LC_NUMERIC=C
[5] LC_TIME=English_United States.utf8
attached base packages:
[1] stats graphics grDevices utils datasets methods base
other attached packages:
[1] cowplot_1.1.1 dendextend_1.16.0 ggdendro_0.1.23 reshape2_1.4.4
[5] car_3.1-0 carData_3.0-5 gvlma_1.0.0.3 patchwork_1.1.1
[9] viridis_0.6.2 viridisLite_0.4.0 gridExtra_2.3 xtable_1.8-4
[13] kableExtra_1.3.4 MASS_7.3-56 data.table_1.14.2 readxl_1.4.0
[17] forcats_0.5.1 stringr_1.4.0 dplyr_1.0.9 purrr_0.3.4
[21] readr_2.1.2 tidyr_1.2.0 tibble_3.1.7 ggplot2_3.3.6
[25] tidyverse_1.3.2 lmerTest_3.1-3 lme4_1.1-30 Matrix_1.4-1
[29] vegan_2.6-2 lattice_0.20-45 permute_0.9-7 phyloseq_1.40.0
[33] workflowr_1.7.0
loaded via a namespace (and not attached):
[1] googledrive_2.0.0 minqa_1.2.4 colorspace_2.0-3
[4] ellipsis_0.3.2 rprojroot_2.0.3 XVector_0.36.0
[7] fs_1.5.2 rstudioapi_0.13 farver_2.1.1
[10] fansi_1.0.3 lubridate_1.8.0 xml2_1.3.3
[13] codetools_0.2-18 splines_4.2.0 cachem_1.0.6
[16] knitr_1.39 ade4_1.7-19 jsonlite_1.8.0
[19] nloptr_2.0.3 broom_1.0.0 cluster_2.1.3
[22] dbplyr_2.2.1 BiocManager_1.30.18 compiler_4.2.0
[25] httr_1.4.3 backports_1.4.1 assertthat_0.2.1
[28] fastmap_1.1.0 gargle_1.2.0 cli_3.3.0
[31] later_1.3.0 htmltools_0.5.2 tools_4.2.0
[34] igraph_1.3.4 gtable_0.3.0 glue_1.6.2
[37] GenomeInfoDbData_1.2.8 Rcpp_1.0.8.3 Biobase_2.56.0
[40] cellranger_1.1.0 jquerylib_0.1.4 vctrs_0.4.1
[43] Biostrings_2.64.0 rhdf5filters_1.8.0 multtest_2.52.0
[46] svglite_2.1.0 ape_5.6-2 nlme_3.1-157
[49] iterators_1.0.14 xfun_0.31 ps_1.7.0
[52] rvest_1.0.2 lifecycle_1.0.1 googlesheets4_1.0.0
[55] getPass_0.2-2 zlibbioc_1.42.0 scales_1.2.0
[58] hms_1.1.1 promises_1.2.0.1 parallel_4.2.0
[61] biomformat_1.24.0 rhdf5_2.40.0 yaml_2.3.5
[64] sass_0.4.2 stringi_1.7.6 highr_0.9
[67] S4Vectors_0.34.0 foreach_1.5.2 BiocGenerics_0.42.0
[70] boot_1.3-28 GenomeInfoDb_1.32.2 systemfonts_1.0.4
[73] rlang_1.0.2 pkgconfig_2.0.3 bitops_1.0-7
[76] evaluate_0.15 Rhdf5lib_1.18.2 processx_3.7.0
[79] tidyselect_1.1.2 plyr_1.8.7 magrittr_2.0.3
[82] R6_2.5.1 IRanges_2.30.0 generics_0.1.3
[85] DBI_1.1.3 withr_2.5.0 pillar_1.8.0
[88] haven_2.5.0 whisker_0.4 mgcv_1.8-40
[91] abind_1.4-5 survival_3.3-1 RCurl_1.98-1.8
[94] modelr_0.1.8 crayon_1.5.1 utf8_1.2.2
[97] tzdb_0.3.0 rmarkdown_2.14 grid_4.2.0
[100] callr_3.7.1 git2r_0.30.1 webshot_0.5.3
[103] reprex_2.0.1 digest_0.6.29 httpuv_1.6.5
[106] numDeriv_2016.8-1.1 stats4_4.2.0 munsell_0.5.0
[109] bslib_0.4.0